gold on sell#XAUUSD on retest, price on a third pattern which needs to correct below.
Firstly breakout below 3317, target 3310-3303, stop loss 3326
The manipulation in the market is strong, breakout above 3330 can not fully buy but reverse down below.
Beyond Technical Analysis

Bullish ICT Entry 15 minute Entry:
1. Sell - side liquidity swept.
2. BOS up onM15 confirm shift.
3. Entry from bullish OB or FVG after pullback.
4. SL below liquidity sweep.
5. TP internal high/TP2 premium zone.

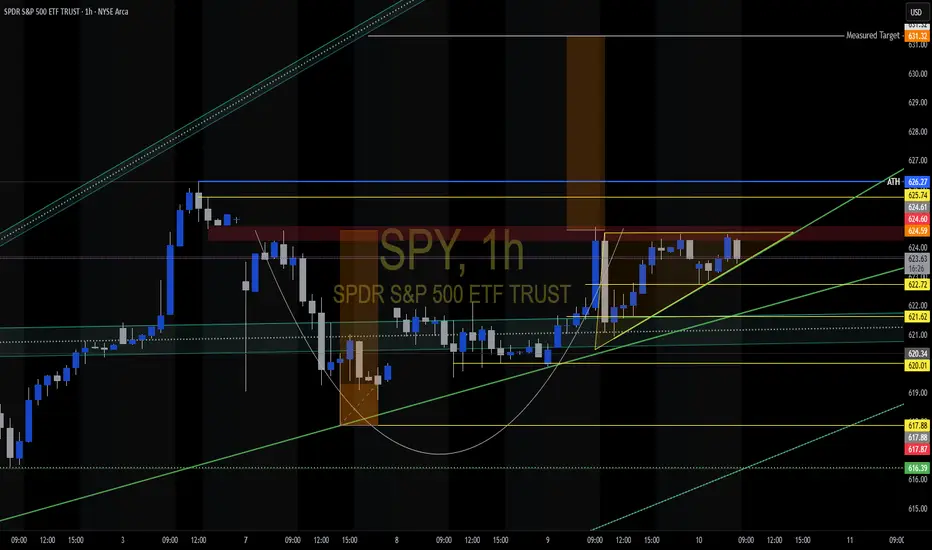
SPY Bullish Patterns C&H Pattern W/ Right Angle Wedge. Wait for confirmation and retest to have a high probability of success.
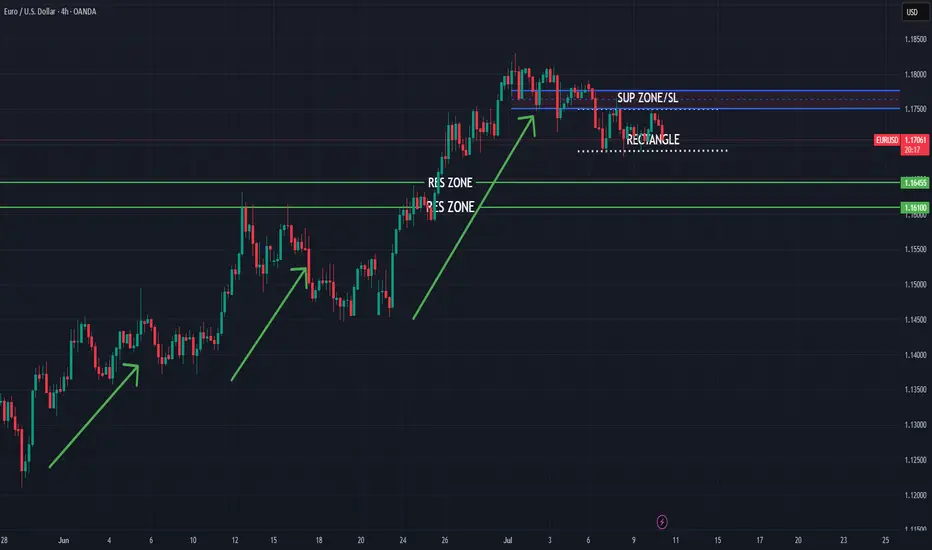
EURUSD bearish push expected
FX:EURUSD trend based analysis, few bullish pushes we are have in last periods, currently expecting from here short bearish push.
SUP zone: 1.17500
RES zone: 1.16450, 1.16100
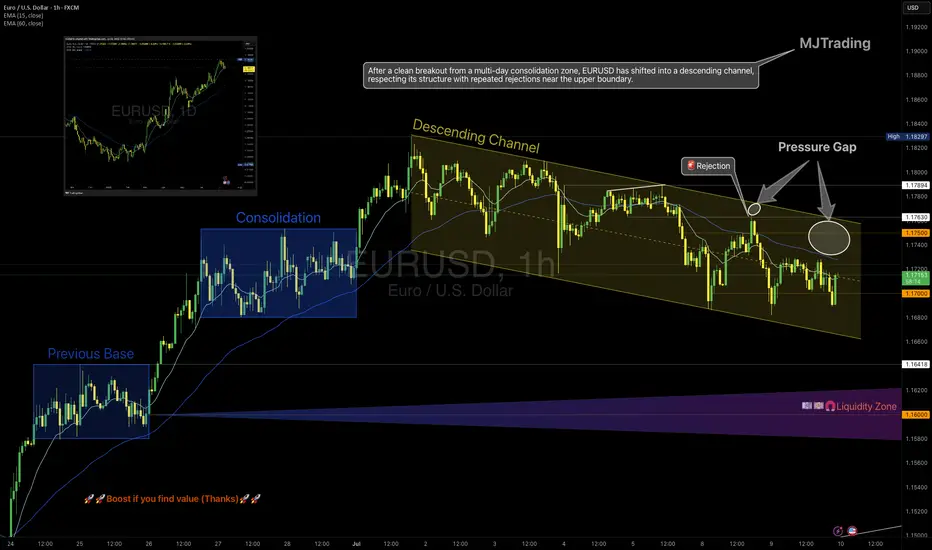
EURUSD – From Structure to Shift
1H Technical Outlook by MJTrading
EURUSD moved cleanly through a sequence of structural phases:
• Previous Base
• Multi-day Consolidation (potential quiet accumulation)
• Transition into a well-respected Descending Channel
Price has since shown repeated rejections from the upper boundary, including a decisive selloff from the 1.1750 zone, forming what we now label a "Pressure Gap" — a space where aggressive sellers overwhelmed price.
🧭 Key Scenarios Ahead:
🔻 Bearish Continuation:
Breakdown below 1.1700 opens room toward:
• 1.1640 (channel bottom)
• 1.1600 Liquidity Zone
Watch for impulsive sell candles + EMA rejection
🔁 Short-Term Bounce or Trap:
Holding above 1.1700 could spark a rebound toward 1.1750
This may serve as a final test before another leg lower
Only a clean break and hold above 1.1763 flips structure bullish
🔍 Bonus Confluence:
1D Chart shows broader bullish context (inset)
EMAs tightening = expect volatility burst
Well-defined structure gives clear invalidation and targets
Every trend tells a story — from base building to breakout, and now a possible breakdown. Trade the structure, not the prediction.
#EURUSD #Forex #TradingView #TechnicalAnalysis #PriceAction #DescendingChannel #LiquidityZone #SmartMoney #MJTrading
SellPrevious Day Low
Trend Line Break
Divergence Volume
London Session
Previous Week High Breach
Market Structure Shift Bearish

EURAUD higher bearish for expect
OANDA:EURAUD bullish trend nearly last two months.
Good structure visible, we have breaked trend line, sup zone (1.79100) breaked and DESCENDINGING TRIANGL is breaked, we are have and RBA and RBNZ in last days.
EUR looks like is start losing power and like cant more pushing, from here expectations are for more bearish.
SUP zone: 1.79500
RES zone: 177500, 177000

CRT on Weekly timeframe / Bullish 🎯 Trade Idea:
If you're already in: Good entry, but keep a tight stop below 0.5770.
If you're not in yet: Wait for a bullish confirmation candle (engulfing, hammer, etc.) on the daily or weekly before entering.
TP Zones:
TP1: 0.5900 (minor resistance)
TP2: 0.6040 (key structure zone)

GoldI am the best Trader in the World !
Even if other many professional traders says that Gold will go up , I am here to tell you No ! the Gold will very soon Collapse more than 11% !

USDJPY IS THE ONLY FALLING h4Price dips below 143.000 support
Attracts breakout sellers
Sharp reversal back toward resistance at 146.500+
Target zone: 147.800 – 149.000

DXYInstitutions are currently holding a net short position on the Dollar, indicating bearish sentiment. With a net position of -4,282, we may expect continued weakness in the DXY, especially if price reacts from key supply zones. Swing traders should remain cautious with long setups and prioritize opportunities aligned with USD weakness across major pairs.

BTC: Demand Zone + QML + Trendline Flip = Perfect SETUPHello guys!
BTC is showing signs of a potential bullish reversal, forming a Quasimodo Level (QML) setup inside a valid S&D zone that remains unbroken despite multiple tests.
The downward trendline has been broken and is now acting as support, aligning perfectly with the QML and demand zone. giving us a solid confluence area.
Important to watch:
Rejection wicks and volume building at $106.6K–$107.4K zone show strong buyer interest.
If price can reclaim $109K and consolidate above, we could see a move toward $112K and higher.
Invalidation below $106.4K suggests the demand has failed, and bears may regain control.


ETHUSD h4 next move downThe resistance at 1.36554 may be weak due to:
Multiple taps already
Reduced seller interest
A breakout above this zone could trigger short covering → sharp rally
✅ 2. Higher Low Structure
Recent low at 1.35475 held strong
Current consolidation appears like a bullish flag or accumulation range
Could indicate continuation, not rejection
✅ 3. Fakeout Reversal Setup
If price dips into the support at 1.35475 again, it might:
Trap breakout traders
Reverse and form a new impulse leg upward
Target = 1.3700–1.3750 zone

ETH Pullback Before Next Rally? Hello guys!
Ethereum is currently testing a strong resistance zone around the $2,678 level, which has previously acted as a key barrier. Price action has been climbing steadily within an ascending channel, indicating a clear bullish trend in play.
However, since ETH is right at the resistance, we could see a short-term correction or pullback toward the $2,560–$2,580 support range (highlighted zone), which also aligns with the midline of the channel and previous consolidation structure.
If this support holds, a healthy bounce from this area would likely push ETH toward the next bullish target around the $2,760–$2,800 zone, which sits near the upper boundary of the current channel.

Bullish on ETHWe took out SSL, then price broke down and inverted towards bullish price action. Target is previous double tops at 4200

Steal the Breakout: Broadcom Bulls Are In!💎🔓 "Broadcom Break-In: Bullish Vault Raid in Progress!" 🔓💎
🌟Hi! Hola! Ola! Bonjour! Hallo! Marhaba!🌟
Dear Money Makers & Market Robbers 🤑💰✈️,
It’s time for a high-stakes raid on BROADCOM, INC (AVGO) — all based on our secret Thief Trading Strategy™, combining sharp technicals & a sniff of fundamentals.
🕵️♂️ Mission Brief:
Our target is the Bullish Vault – a swing/day trade play with upside momentum. The chart reveals a possible trap at overbought zones where unsuspecting bears get lured in... and we walk out rich! 😏💸
🎯 The Heist Blueprint:
📥 Entry (Buy-In Point):
🚪 “The vault’s open – grab the bullish bags!”
Swipe any bullish setup on the 15m/30m timeframe
Ideal: Buy Limit near recent swing low (support levels)
📳 Set alerts to stay ready – we rob smart, not fast
🛑 Stop-Loss (Escape Plan):
Place SL below recent 30m swing low — approx. 269.00
Adjust by your lot size & number of trades
Don't risk the whole bag – we ain't greedy thieves 😈
📈 Target (Take-Profit Point):
🎯 First Exit Zone: 296.00
💨 Or vanish before the cops (market reversal) arrive
🧲 Scalpers’ Secret:
Only scalp long – don’t fight the bullish flow
Got big capital? Enter early. Small bag? Join the swing crew
Use Trailing SL to guard your stolen gains 🏦🔐
💡 Behind the Heist:
AVGO is showing bullishness thanks to:
📰 Macro Drivers • COT Reports • Institutional Bias
📊 Sentiment Analysis • Index Correlations
💥 Geopolitical Developments – Always stay updated
🔎 Want more intel? Dive into the news, fundamentals, & positioning data that power this trade idea 💣
⚠️ Trade Smart, Thieves:
📛 News events cause chaos – avoid fresh entries during releases
📉 Use trailing stops to secure your loot & dodge slippage
💖 Like the Heist Plan? Hit Boost!
Let’s build the most notorious money-making crew on TradingView! 🚀
Daily gains using the Thief Style™ – not for the faint-hearted.
🔒 Stay sharp, trade like a phantom, and keep stacking that digital cash!
💬 Drop a comment if you’re in the gang – another plan’s coming soon! 🤑🐱👤
📌 Note: This is a general market analysis. Do your own due diligence before risking real capital.
📌 Stay updated — the market changes fast. Adapt or get trapped.

USD/CHF Weakness Alert: Retail Bulls vs. Smart Money FlowHere’s the latest aggregated data on the pair:
📊 4 out of 5 indicators suggest potential for further downside.
Sentiment - Bearish!
A quick note on sentiment in the table:
✅ It’s structured hierarchically — from the broadest view (COT reports) to specific entry points (algorithmic setups).
So, Retail traders are massively long USD/CHF — over 80% still buying , expecting strength.
But here’s the problem: the options flow tells a different story .
Looking at recent data from CME , we’re seeing fresh calls buying and growing open interest at key strikes upper current Swiss futures price — a sign that option traders are preparing for strong CHF
💡 Use this data in your trading OR quick check for market conditions at glance!
🎯 No Valuable Data, No Edge!

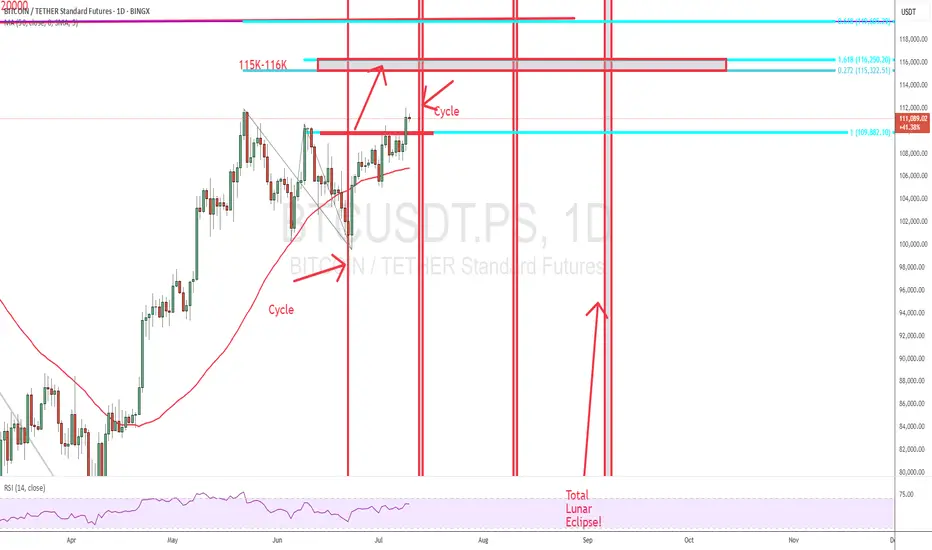
BTCUSD BULLISH MORE all time high again The price may briefly break above the 113,000–114,000 level (first target) to trap long positions, then sharply reverse.
Support Break Warning:
If BTC fails to hold the 110,000–108,000 support zone, it could accelerate a drop to deeper supports:
Support Area 1: 106,000
Support Area 2: 102,000
Extreme Bearish Target: 96,000–94,000
What to Watch:
Bearish divergence on lower timeframes
Volume drop on new highs = possible fakeout
Candle rejection from 113,000–114,000 zone

USDJPY Analysis : Bearish Setup from Reversal Zone + Target⚠️ Overview:
The USDJPY 4H chart reveals a smart money-driven bearish setup, unfolding precisely from a major Reversal Zone, which aligns with a key supply area. Price action is now offering high-probability short trade opportunities, supported by structural breaks, clear CHoCHs (Change of Character), and BOS (Breaks of Structure).
🔎 Detailed Technical Breakdown:
🔹 Bearish Pattern + Channel Formation:
The pair formed a bearish price pattern earlier, which initiated the previous downtrend. This move developed into a well-formed descending channel, showing controlled distribution from the institutional side. The channel break marked a liquidity grab below previous lows, trapping retail sellers before shifting structure.
🔹 Channel Insider Demand + Breakout:
After reaching the Channel Insider Demand, USDJPY made a strong bullish push, causing a Minor BOS — a sign of temporary bullish pressure. However, this move served to rebalance price into a premium zone, which is the current Reversal Zone. This zone lies near previous imbalance/fair value gaps and coincides with a supply structure, making it a high-reaction area.
🔹 Reversal Zone (Premium Area):
Price tapped the Reversal Zone and began rejecting aggressively. This reaction indicates the presence of large sellers and order blocks. The current price action now displays a Minor CHoCH, suggesting a short-term bearish shift in order flow.
This is a textbook case of premium vs. discount pricing, where price seeks liquidity above recent highs before reversing to more balanced zones.
🔹 Price Flow Expectations (Downside Targets):
The first confirmation of bearish continuation will come with a clean break below the Minor CHoCH level (~144.400). Following that, momentum is expected to carry USDJPY toward:
🥇 Target 1: 144.00 – Local support / liquidity pocket
🥈 Target 2: 143.00 – Key psychological & structural support
🥉 Target 3: 142.00–142.50 Zone – Marked as the Next Reversal Zone, which could act as demand
This setup remains valid as long as the price remains below 147.200, which is the high of the Reversal Zone. A breakout above this invalidates the bearish thesis.
🧠 MMC (Mind Market Curve) Interpretation:
The chart clearly respects Mind Curve Theory structure:
CHoCH/BOS confirms internal order flow
Reversal zone is placed at a curve top (premium)
Support base (discount zone) is yet to be revisited
The curve shape guides a possible rounded rejection scenario, pushing price down into the major support, aligning with smart money liquidity grab behavior.
📊 Strategic Insight:
This is a classic smart money trap — fake bullish breakout, quick grab of early breakout traders’ stops, followed by a decisive turn from supply.
Traders should monitor:
Candle structure at current levels
Reaction to minor CHoCH zone (~144.400)

GBPUSD h4 big downhe resistance at 1.36554 may be weak due to:
Multiple taps already
Reduced seller interest
A breakout above this zone could trigger short covering → sharp rally
✅ 2. Higher Low Structure
Recent low at 1.35475 held strong
Current consolidation appears like a bullish flag or accumulation range
Could indicate continuation, not rejection
GBPUSD SELL IDEA Fakeout Reversal Setup
If price dips into the support at 1.35475 again, it might:
Trap breakout traders
Reverse and form a new impulse leg upward
Target = 1.3700–1.3750 zone
Disruption Path: Bullish Breakout
Minor dip or tight range around current price
Break and hold above 1.3655
Acceleration toward 1.3700–1.3750
Disruption Invalidation
A strong close below 1.3540 with volume

CRC | Long | Strong Cash Flow | (July 2025)CRC | Long | Strong Cash Flow & Carbon Transition Story | (July 2025)
1️⃣ Short Insight Summary:
CRC is showing solid momentum as it combines strong cash flow from oil & gas with an expanding carbon capture strategy. Price action suggests a possible breakout on its second attempt at resistance.
2️⃣ Trade Parameters:
Bias: Long ✅
Entry: Watching current resistance zone closely on the 4-hour chart; money inflows confirmed on daily.
Stop Loss: Around $44 (invisible stop loss level to manage risk).
TP1: $53 💰
TP2: $57 💰
Partial Exits: Letting a portion run towards $63 for extended upside potential.
3️⃣ Key Notes:
We see strong institutional support, recent acquisition synergies from Aera Energy, and potential tailwinds from the Carbon TerraVault (CTV) project. Watch for volume confirmation and the upcoming Q2 earnings report on August 5, which could act as a catalyst. Be cautious of commodity price volatility and regulatory timelines for CCS projects.
4️⃣ Optional Follow-up Note:
Will monitor closely and share updates as the trade develops, especially if earnings significantly shift sentiment.
Please LIKE 👍, FOLLOW ✅, SHARE 🙌 and COMMENT ✍ if you enjoy this idea! Also share your ideas and charts in the comments section below! This is the best way to keep it relevant, support us, keep the content here free and allow the idea to reach as many people as possible.
Disclaimer: This is not a financial advise. Always conduct your own research. This content may include enhancements made using AI.