Why Your Orange Juice Costs More?The price of orange juice is surging, impacting consumers and the broader economy. This increase stems from a complex interplay of geopolitical tensions, macroeconomic pressures, and severe environmental challenges. Understanding these multifaceted drivers reveals a volatile global commodity market. Investors and consumers must recognize the interconnected factors that now influence everyday staples, such as orange juice.
Geopolitical shifts significantly contribute to the rising prices of orange juice. The United States recently announced a 50% tariff on all Brazilian imports, effective August 1, 2025. This politically charged move targets Brazil's stance on former President Jair Bolsonaro's prosecution and its growing alignment with BRICS nations. Brazil dominates the global orange juice supply, providing over 80% of the world's trade share and 81% of U.S. orange juice imports between October 2023 and January 2024. The new tariff directly increases import costs, squeezing margins for U.S. importers and creating potential supply shortages.
Beyond tariffs, a convergence of macroeconomic forces and adverse weather conditions amplify price pressures. Higher import costs fuel inflation, potentially compelling central banks to maintain tighter monetary policies. This broader inflationary environment impacts consumer purchasing power. Simultaneously, orange production faces severe threats. Citrus greening disease has devastated groves in both Florida and Brazil. Extreme weather events, including hurricanes and droughts, further reduce global orange yields. These environmental setbacks, coupled with geopolitical tariffs, create a robust bullish outlook for orange juice futures, suggesting continued price appreciation in the near term.
Beyond Technical Analysis

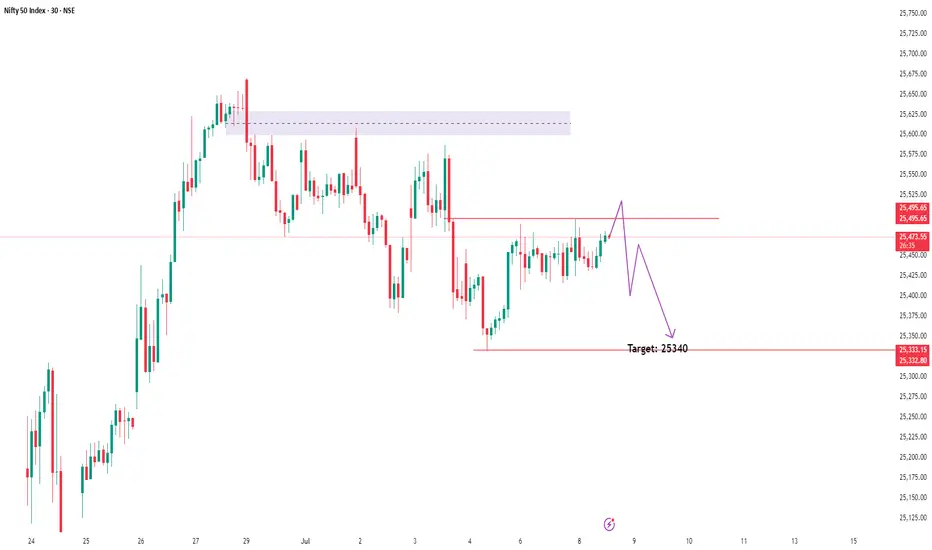
Bearish Outlook on Nifty – Based on Smart Money ConceptI'm seeing a clear downside setup on Nifty, with Smart Money indicating distribution and the market transitioning into a bearish trend.
📉 Target: 25,340
📍 Current Price: 25,474
🔍 Reasoning: Clear signs of institutional distribution and lower highs/lows forming. Smart Money is exiting, suggesting the beginning of a deeper correction.
Will monitor closely for any change in structure, but as of now, bias remains strongly bearish.
Waiting for $3: Patience Before Positioning in GasYes, the attempt to catch the bottom in natural gas ended in failure. Let it be a lesson for the future. Just because something looks cheap and low doesn’t mean it can’t go even lower — and the question is whether your margin and nerves can handle the drawdown. In short — it's a bad path.
It’s too late to short, too early to go long.
I think we’ll most likely head toward the $3 level, and from there we’ll see: will it break or hold? Ideally, I’d like to wait for a proper long setup at that level.

US COPPER: is the technical breakout a trap?The unexpected announcement of a dramatic increase in US copper tariffs triggered a bullish impulse in the copper price, which reached a new all-time high. The question is whether this bullish technical signal is reliable, or whether it could be a false signal and therefore a bullish trap. So let's review the technical analysis message on the price of copper (copper which is listed in New York) and take a look at the fundamentals.
1) 50% US tariff on copper imports!
President Trump has announced a 50% tariff on imports of this strategic metal, triggering an immediate price surge in the US and a pullback in the London-listed copper price. This decision is part of a wider move to reduce the country's dependence on foreign suppliers, following similar measures on other industrial metals. Faced with the prospect of trade barriers on such a scale, international traders rushed huge volumes of copper to US ports to protect themselves against an imminent surcharge. However, this rush has added to the confusion, as no one knows precisely when the new taxes will come into force, or whether certain companies will be granted exemptions. We must therefore remain cautious, as Trump's trade announcements are highly fickle, and the price of copper in the US could fall back if these 50% tariffs are not finally implemented.
It takes many years to bring new mines on stream and build copper processing plants, while imports continue to dominate the US market. This could exert sustained upward pressure on prices, penalizing the competitiveness of US industries.
At the same time, the timetable for implementation remains unclear. The Secretary of Commerce mentioned the end of summer as a likely horizon, but without detailing which types of processed or raw products would be affected. This uncertainty fuels speculation and maintains volatility on commodity markets. We therefore need to be fully aware of the speculative aspect of copper's behavior on the stock market at present, and therefore of the risk of false technical signals.
2) In terms of technical analysis, if the breakout is confirmed, bullish potential may be limited by the top of a long-term Chartist channel.
In terms of chart analysis, a bullish technical breakout has therefore taken place, with the overrunning of resistance at $4.70/$5. It remains to be seen whether or not this bullish technical break will be confirmed at the weekly close at the end of the week.
But if it is, the upside potential will be limited by the upper part of a long-term Chartist channel which runs towards the $6 price. If the market were to break back below support at $4.70/$5, then the bullish technical signal would be invalidated.
3) The relative strength between the copper price and the gold price should be kept under close watch
On the other hand, I would like to highlight the presence of major long-term support on the ratio between the copper price and the gold price.
The current bounce off this long-term support suggests that copper should outperform gold over the coming months.
DISCLAIMER:
This content is intended for individuals who are familiar with financial markets and instruments and is for information purposes only. The presented idea (including market commentary, market data and observations) is not a work product of any research department of Swissquote or its affiliates. This material is intended to highlight market action and does not constitute investment, legal or tax advice. If you are a retail investor or lack experience in trading complex financial products, it is advisable to seek professional advice from licensed advisor before making any financial decisions.
This content is not intended to manipulate the market or encourage any specific financial behavior.
Swissquote makes no representation or warranty as to the quality, completeness, accuracy, comprehensiveness or non-infringement of such content. The views expressed are those of the consultant and are provided for educational purposes only. Any information provided relating to a product or market should not be construed as recommending an investment strategy or transaction. Past performance is not a guarantee of future results.
Swissquote and its employees and representatives shall in no event be held liable for any damages or losses arising directly or indirectly from decisions made on the basis of this content.
The use of any third-party brands or trademarks is for information only and does not imply endorsement by Swissquote, or that the trademark owner has authorised Swissquote to promote its products or services.
Swissquote is the marketing brand for the activities of Swissquote Bank Ltd (Switzerland) regulated by FINMA, Swissquote Capital Markets Limited regulated by CySEC (Cyprus), Swissquote Bank Europe SA (Luxembourg) regulated by the CSSF, Swissquote Ltd (UK) regulated by the FCA, Swissquote Financial Services (Malta) Ltd regulated by the Malta Financial Services Authority, Swissquote MEA Ltd. (UAE) regulated by the Dubai Financial Services Authority, Swissquote Pte Ltd (Singapore) regulated by the Monetary Authority of Singapore, Swissquote Asia Limited (Hong Kong) licensed by the Hong Kong Securities and Futures Commission (SFC) and Swissquote South Africa (Pty) Ltd supervised by the FSCA.
Products and services of Swissquote are only intended for those permitted to receive them under local law.
All investments carry a degree of risk. The risk of loss in trading or holding financial instruments can be substantial. The value of financial instruments, including but not limited to stocks, bonds, cryptocurrencies, and other assets, can fluctuate both upwards and downwards. There is a significant risk of financial loss when buying, selling, holding, staking, or investing in these instruments. SQBE makes no recommendations regarding any specific investment, transaction, or the use of any particular investment strategy.
CFDs are complex instruments and come with a high risk of losing money rapidly due to leverage. The vast majority of retail client accounts suffer capital losses when trading in CFDs. You should consider whether you understand how CFDs work and whether you can afford to take the high risk of losing your money.
Digital Assets are unregulated in most countries and consumer protection rules may not apply. As highly volatile speculative investments, Digital Assets are not suitable for investors without a high-risk tolerance. Make sure you understand each Digital Asset before you trade.
Cryptocurrencies are not considered legal tender in some jurisdictions and are subject to regulatory uncertainties.
The use of Internet-based systems can involve high risks, including, but not limited to, fraud, cyber-attacks, network and communication failures, as well as identity theft and phishing attacks related to crypto-assets.

Gold on Hold: Consolidation Without a SignalGold is holding up well for now and consolidating at the current level. But there’s no clear opportunity to buy or sell. It’s just guesswork at this point. And why would I need that? I want to make money, not to be "right."
On a global, long-term horizon (up to a year), I believe the metal will go higher. On the daily and weekly charts, the trend is still upward, and both geopolitical factors and the Fed’s rate policy support the continuation of the trend. But when exactly will it happen? That’s unclear. For now, there are no setups for a trade.
Interestingly, gold and other precious metals might move in different directions. Gold could start a correction while other metals could rise, as they are undervalued. But undervaluation isn’t a direct reason to buy. It’s always better to follow this rule: the market knows better than all of us what the fair price should be right now. Still, when it comes to entering a position, my opinion that the metal is undervalued can be taken into account—and if there’s a proper setup, the entry can be made. It’s like a puzzle. One factor is one piece, then another, and another—and once the full picture comes together, that’s when we enter the position.

DAX (Ger40): Defying Global TensionsDespite all this tariff drama, the DAX hit another record high. What gives? Markets seem to be betting that Trump enjoys the threat of tariffs more than the implementation. Some traders are pricing in yet another extension beyond the August 1 deadline.
The DAX is riding momentum from both global AI enthusiasm, thanks to Nvidia’s $4 trillion market cap milestone, and the assumption that European exporters might dodge the worst of Trump’s trade penalties, at least for now. However, this rally is precarious. If a tariff letter hits Brussels, or copper tariffs ripple into industrial demand expectations, we could see a swift correction.
Technically, near term resistance is sitting around. 24,700. However as stated, should sentiment change. A correction back down, to the support level at 24,200, which also aligns with the 50 Fibonacci retracement level, could be on the cards. Or even all the way down to 23,800, aligning with the 88% Fibonacci level.

Gold (XAU/USD): Tugged Between Tariffs and Treasury YieldsGold is finding renewed interest from two forces: falling real yields and a cautious Fed. Despite the dollar’s strength, we’re seeing the yellow metal hold above $3,300. Treasury yields are sliding, and global central banks, especially China’s PBOC, are still net buyers of gold. The World Gold Council reported $38 billion in inflows to gold ETFs in the first half of the year, the highest in five years.
Technically, support remains stiff at the 50-day EMA ($3,305), with a ceiling at $3,340. If broken, $3,360 - $3,400 comes back into play. But failure to hold above $3,300 opens downside risk to $3,246, and possibly $3,185.

USD/JPY: Still a Safe-Haven Tug of WarUSD/JPY had surged past 147 on the back of Trump’s tariff letter to Japan—but quickly pulled back as risk appetite stabilized and Treasury yields softened. Price action now sits around the low-146s.
Technically, the 100-day SMA is providing key support just below 146.00. If bulls hold this level, we could see another push toward 147.20–148.00. On the downside, any surprise from upcoming Fed speakers or Japanese trade negotiations could send the pair testing the 144.00 zone again. Traders are watching Osaka closely, U.S. Treasury Secretary Scott Bessent is expected to meet Japanese officials at the World Expo, which could shape sentiment fast.

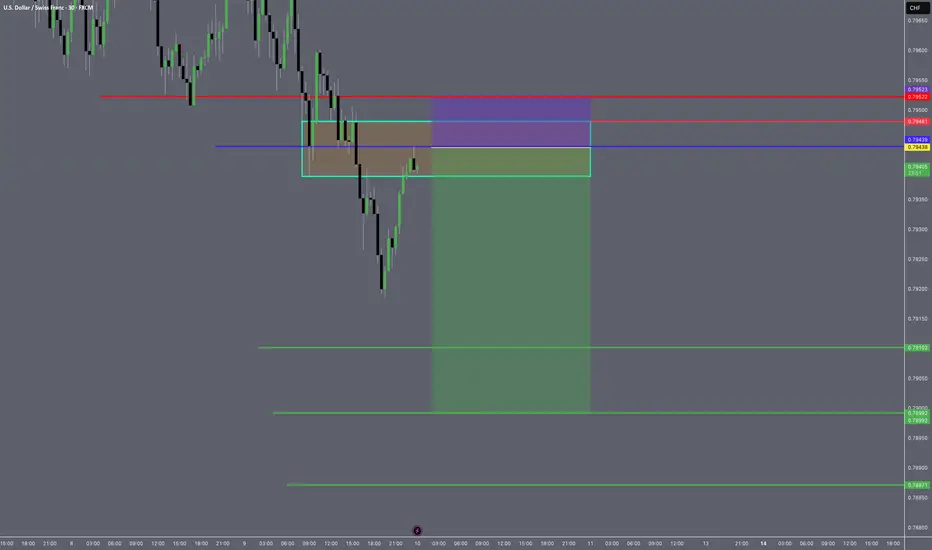
USD CHF SHORT PLAY-TITAN SIGNAL🔻 USDCHF SHORT PLAY – TITAN SIGNAL 🔻
"Impulse Drain Line Breach – Initiate Tactical Short"
📍 PAIR: USDCHF
🎯 Play Type: Short
📈 Signal Code: Impulse Drain Line Activated
📌 Entry: Upon clean break + retest of the Impulse Drain Line (0.79436
🎯 Targets:
LZ1: 0.7909
LZ2: -0.7898
LZ3: 0.7886
🛡 Stop: 0.79522
SMCI buy cycle in progress into yr endStrong buy rates on order flow indicating buy-side targets as follows
tp1 = 88
tp2 = 96
tp3 = 105
...by end of 2025
Still expecting strong sell wave sometime by mid-2026 all the way back to 20's as the semiconductor space continues dealing with growing bearish forces. Recent weakness should be seen as "shots across the bow" or warning shots. Next set of highs will be opportunities to EXIT and go short imo.

Accumulated above 3300, market is sideways⭐️GOLDEN INFORMATION:
Gold prices posted modest gains on Wednesday, supported by a pullback in US Treasury yields, even as the US Dollar remained firm against major currencies. Market sentiment continued to be driven by trade developments, while the Federal Reserve’s latest meeting minutes revealed that policymakers are still leaning toward a rate cut in 2025. At the time of writing, XAU/USD is trading at $3,312, up 0.31%.
The FOMC minutes indicated that the majority of Fed officials believe a rate cut this year would be appropriate, with a few members open to the possibility of initiating a reduction as early as July—provided the economic data continues to align with expectations.
⭐️Personal comments NOVA:
Gold price recovered to 3320, mainly still accumulating, waiting psychology on current tariff situation of countries
⭐️SET UP GOLD PRICE:
🔥SELL GOLD zone: 3358- 3360 SL 3365
TP1: $3345
TP2: $3332
TP3: $3320
🔥BUY GOLD zone: $3245-$3247 SL $3240
TP1: $3256
TP2: $3269
TP3: $3280
⭐️Technical analysis:
Based on technical indicators EMA 34, EMA89 and support resistance areas to set up a reasonable BUY order.
⭐️NOTE:
Note: Nova wishes traders to manage their capital well
- take the number of lots that match your capital
- Takeprofit equal to 4-6% of capital account
- Stoplose equal to 2-3% of capital account


Gold Rebounds from 3283, Eyes 3315 Resistance📊 Market Overview:
• Gold dropped sharply to a low of $3283 earlier today before rebounding strongly back to around $3312, supported by renewed buying interest.
• The recovery is fueled by risk-off sentiment amid ongoing trade negotiation uncertainty and a mild pullback in the U.S. Dollar Index.
• Central bank buying continues to underpin gold’s base, despite mild pressure from rising U.S. bond yields.
________________________________________
📉 Technical Analysis:
• Key Resistance: $3315 – $3335
• Nearest Support: $3280
• EMA 09: Price is trading above the 9-period EMA, signaling a short-term bullish trend.
• Candle pattern / Momentum: A strong bullish engulfing candle formed after bouncing from $3283 on the H1 chart. MACD is crossing upward, and RSI is approaching the 60 level, suggesting bullish momentum.
________________________________________
📌 Outlook:
Gold may continue to recover in the short term if it holds above the $3300 level and successfully breaks through $3315 resistance. However, failure to break above this resistance could lead to a short-term pullback toward $3290–$3280.
________________________________________
💡 Suggested Trading Strategy:
🔻 SELL XAU/USD at: $3315–3325
🎯 TP: $3295
❌ SL: $3330
🔺 BUY XAU/USD at: $3285–3295
🎯 TP: $3315
❌ SL: $3280

Gold – July 10 | H4 OB Held, BoS Confirmed, Watching 3310🟡 Gold (XAUUSD) – July 10 Analysis | H4 Pullback Over, M15 Aligned for Bullish Continuation
The H4 order block around 3280 (3288–3275) was tested, and the market responded strongly — just as anticipated .
Following that, M15 structure gave a clear ChoCh + BoS , signaling that the H4 pullback is now complete .
The market has likely resumed its bullish continuation trend.
🔁 Current Market Structure
✅ H4 Trend: Resumed upward after OB reaction
✅ M15 Trend: Now aligned with H4 (ChoCh + BoS confirmed)
Bias: Bullish
→ We are only looking for long setups , in sync with both timeframes
📍 Key Levels to Watch
1️⃣ 3322–3326 → M15 OB zone
→ Currently acting as rejection zone
→ Already reacted — price is pulling back
2️⃣ 3313–3310.5 → Next potential M15 POI
→ If respected with M1 confirmation (ChoCh + BoS), long setups become valid
🎯 Target: 3345
→ Based on structure projection and intraday range
📌 If 3313–3310.5 fails:
→ Watch next zone at 3296–3298 for fresh demand/support
🧭 Execution Plan
• Wait for price to enter 3313–3310.5 zone
• Look for M1 confirmation (ChoCh + BoS)
• If confirmed:
→ Enter long
→ Target = +120 pips (as per fixed RR model)
→ SL based on M1 structure
• If zone breaks:
→ Reassess near 3296–3298
🧠 Final Thoughts
The H4 pullback is over — structure confirms bullish continuation
M15 is aligned — we now prepare , not predict
Wait for the chart to call you in — not your bias.
📖 We don’t predict reversal — we confirm structure.
We don’t chase price — we prepare for it.
📘 Shared by @ChartIsMirror

"UK Oil/Brent Heist Plan: Thief Style Breakout Strategy"🛢️💣 "BRENT Energy Heist Plan 💸: The Thief Trader's Playbook to Rob the UK Oil Market!" 🔫📈
🚫 This is a creative and educational overview of a market strategy. It does not encourage illegal activity. Please trade responsibly and within your own risk tolerance.
🌍 Hola! Bonjour! Marhaba! Hello, Money Makers & Market Thieves! 🤑💰📊
Welcome to the Thief Trading Style — a unique, bold, and tactical approach to trading the UK Oil Spot (Brent) market like a pro bandit on Wall Street. We don’t chase the market… we set the trap, wait, and strike like skilled robbers at the vault. 🔓💼
🧠💡Game Plan Summary:
📌 Asset: UK Oil Spot / Brent
📌 Style: Day Trade / Scalping
📌 Bias: Bullish Breakout
📌 Thief’s Method: Layered DCA Entries, Breakout Setup, Swing-Based SL, Aggressive TP
🎯 ENTRY - “The Vault Break”
🚨 Codename: Break & Retest Mission
Wait for a clean breakout above the Moving Average Wall (around 70.500) followed by a retest confirmation. That’s your green light!
✅ Buy Stop Entry: Above 70.500 after a clean candle close & retest.
✅ Buy Limit (Pullback): Near recent swing low or 15–30 min timeframe zones. Use DCA or order layering to reduce risk.
📌 Tip: Set up alerts at the breakout level — never miss the move.
🛑 STOP LOSS - “Escape Route”
🎙️ "Yo, Thief Rule #1: Plan the exit before the entry."
📍 SL suggestion: Swing Low @ 64.000 (based on 2H structure).
🧠 Risk management is key – consider your lot size, margin, and how many layered orders you're stacking.
📢 Optional: Trail that SL once price moves in your favor — lock your loot!
💸 TAKE PROFIT - “The Clean Getaway”
🎯 Target: 72.200 — but don’t be greedy. If the market gets shaky, exit before the cops (sellers) show up!
📌 Be ready to close manually if you smell reversal.
🔍 Fundamentals & Macro View
UK Oil is experiencing strong bullish momentum, driven by:
📰 Geopolitical tensions
🛢️ Supply-demand imbalances
📊 Positive sentiment & institutional flow (Check COT, Macro Outlooks, and Sentiment Reports)
👉 Stay updated with news drops and macro data that can flip the script — set economic calendar alerts.
⚠️ News Release Survival Tips
❌ Avoid new entries during high-impact news.
✅ Use trailing SL to protect running trades.
🔄 Monitor position sizing — volatile swings can eat your equity.
💥 SUPPORT THE CREW!
If you’re vibing with this Heist-Style Trading Analysis, smash that ❤️ Boost Button on TradingView and join the growing crew of market robbers making money with precision and attitude! 🏆💰📈
🚨 More Heist Plans coming soon — follow for real-time setups & updates!
📌 DISCLAIMER:
This analysis is educational and based on personal trading style. Always DYOR (Do Your Own Research), and tailor trades to your own risk profile. Markets change fast — stay agile and sharp! 🧠💼

Bitcoin's New All-Time High = Altcoins Market Bull MarketThe shy new all-time high is in and it is good to be Bitcoin today. It is good to be Bitcoin, to be in Bitcoin and profit while trading Bitcoin but the bears got rekt and that's oookkkk. We accept their loss and it is their loss they earned it by being short when the market is good, bullish and strong. Who would short Bitcoin right before a new all-time high? I don't know.
A new all-time high was hit today, the price $112,000 but this is not the end. Not even close. This is the beginning of the next bullish wave.
I know what you are thinking, or might be thinking; Wait, but what about a drop? What about the correction? Will it go lower? Can I buy Bitcoin at 90K? I told you to buy when prices were low... "You would look like a genius for buying below 80K," 100K is already gone. No, no correction! Bitcoin is going up.
When resistance breaks it means higher. When prices move higher it means higher. When a new all-time high hits it means the bulls win. Now that the bulls won, the battle for the rise or the drop, we can expect higher prices. If you have any doubts, look at the altcoins. The altcoins market says we are entering a period of long-term growth.
Bitcoin will continue to hold strong. It will continue to rise surely, slowly, or fast, but long-term. It doesn't matter the speed; Bitcoin for the whales, altcoins for retail.
A small capital will grow faster with the altcoins because they have higher room for growth. The projects being smaller, more volatile makes for a good trading experience. Higher risk but also a higher opportunity to grow in the short- and mid-term. Bitcoin is good to retire now. Bitcoin is great to hold value, to support the market as it continues to grow.
For me and for you, welcome to the altcoins market bull market.
Thanks a lot for your continued support.
Namaste.

Positional Swing Trade Idea – GFL LTD 📌 Positional Swing Trade Idea – GFL LTD | Cup & Handle Pattern + Accumulation Zone
**GFL LTD (NSE\:GFL)** is showing a well-formed **Cup and Handle** pattern on the daily timeframe, with price action consolidating in a narrow range—indicating strength before a potential breakout.
🔍 **Technical Observations:**
* A well-rounded **cup base** has developed, signaling strong accumulation over time.
* A classic **handle** is now forming, showing controlled consolidation.
* The stock is currently **accumulating between ₹72.50–₹72.55**, creating a narrow resistance zone.
* Sustained movement and a breakout above this zone may lead to a **boombastic upside** move, backed by volume confirmation.
📈 **Trade Setup:**
* **Breakout Level to Watch:** ₹72.55+ on volume
* **Accumulation Range:** ₹72.50–₹72.55
* **Support:** Handle base and recent consolidation low
* **Potential Targets:** Based on pattern depth and momentum
The structure looks promising for a **positional swing trade**, especially if the price holds above the accumulation zone with strength.
⚠️ **Disclaimer:** This analysis is for educational purposes only. Please conduct your own due diligence before entering any trade.

DHUNSERI TEA & IND. LTD. swing/ Positional Trade opportunity### 📌 Positional Swing Trade Idea – DHUNSERI TEA & IND. LTD (DTIL) | Cup & Handle Pattern Forming
DHUNSERI TEA & INDUSTRIES LTD (NSE\:DTIL) is forming a classic **Cup and Handle** pattern on the daily chart, indicating a potential bullish breakout opportunity.
🔍 **Technical Highlights:**
* The cup is well-rounded, indicating strong accumulation over time.
* The handle is forming as a short consolidation/pullback, typical before a breakout.
* Price is approaching the **neckline resistance**, which if broken with volume confirmation, can signal a strong upward move.
📈 **Trade Setup:**
* **Breakout Zone:** Watch for a breakout above the neckline with volume.
* **Support:** Handle base acting as support.
* **Target:** Measured move based on cup depth offers a healthy upside.
This structure suits **positional and swing traders** looking for breakout trades with a defined structure and favorable risk-reward.
⚠️ **Disclaimer:** This idea is for educational purposes only. Please do your own analysis before making any trading decisions.

Accumulation to Acceleration ESThis chart shows a long-term market analysis using Elliott Wave Theory, suggesting the market is currently in Wave 4 and preparing for a big Wave 5 rally.
📈 Past yearly moves averaged 15–21%, with 30%+ currently and up to 66% historically.
🟩 A "rebalance" zone (accumulation phase) is forming before a possible breakout.
📊 The next move projects a +60% rally, targeting 7,112 to 7,570.
🔁 Historical patterns and past rallies are being used to support this bullish forecast.
Bottom line: If history repeats, a strong upward move is expected soon.

BUYAsian Session
Trend Line Break
Order Point
Previous Week Bullish
Divergence
New day..., Action backed decision

$COIN – Smart Money Short Setup (15m)🚨 Bias: Bearish
📍 Reason: Clean CHoCH + BOS structure break from premium supply zone. Price swept liquidity and rejected equilibrium near 358–359, confirming internal weakness.
🧠 SMC Insight:
Multiple CHoCHs show internal break in bullish structure.
Rejection from equilibrium zone = smart money redistribution.
BOS confirms intent to push toward untapped liquidity below.
📊 Volume Profile:
Spike in red selling volume = aggressive seller interest.
Low-volume node around 351–352 = likely drawdown zone.
Major demand/accumulation zone sits at 337–338 with “Strong Low” tag.
🎯 Trade Plan:
🔽 Entry: 357.50–358.50 (on retest)
❌ Stop: Above 360.00
✅ TP1: 351.50
✅ TP2: 337.50 (major demand)
⚠️ Risk: Moderate
🧠 Tip: Monitor BTC/ETH weakness for confluence.
🧬 Powered by WaverVanir DSS – Institutional Trade Engine
#SMC #Coinbase #COIN #VolumeProfile #LiquiditySweep #WaverVanir #TradingView #SmartMoney #AlgoDriven #Quant #InstitutionalOrderFlow

$COIN Options Trade Blunder | AI vs. Flow — Who Wins?NASDAQ:COIN – When LSTM Confidence Misfires at the Top
This week I entered puts on NASDAQ:COIN off a 95% confidence signal from my LSTM model, anticipating a bearish reversal near the premium zone.
It looked clean:
🔺 Price had tapped a weak high
📈 Extended rally from discount to premium
🧠 LSTM model flagged a local exhaustion top
But I ignored the bullish options flow.
Institutions were loading calls.
Volatility structure showed strength.
I chose the model. The market chose pain.
📉 Trade Setup:
Short thesis: Rejection from premium + weak high
Entry: $370 zone
Target: $325 (mid EQ)
Invalidation: Break above $380
Actual Result:
Price consolidated, then held bullish structure.
Implied volatility stayed elevated. No follow-through on the short.
Loss: ~50% on puts.
💡 Lesson:
Chart logic aligned
AI signal was compelling
But real-time flow > model output
LSTM is 70% of my AI trading system, and I’m now integrating options flow override filters to prevent this kind of mismatch in future signals.
📌 I’m currently risk-off, rotating capital into 5Y Treasury futures ($Z) to cool down, refine logic, and reassess volatility pricing models.
🧠 This phase is experimental. If you’re watching my trades – don’t follow. Observe. Learn from the debug phase.
—
Prabhawa Koirala (Pravo)
Founder – WaverVanir International LLC
#COIN #TradingView #SmartMoneyConcepts #LSTM #AITrading #OptionsFlow #WaverVanir #PremiumZone #QuantTrading #VolanX
