GOLD Breakout likely above 96550MCX:GOLD Breakout is in making. Confirmed with OI analysis.
Short position must have Strict SL at 96550.
Rally can push gold towards 97K++
Beyond Technical Analysis

Sprott Copper Arbitrage against LME copper futures, discount 20%Currently COP.UN (traded on TSX, Toronto Stock Exchange) is showing some substantial discount again against NAV. Discount is more than 20% which basically means that you can buy copper on the world markets (LME) with a 20% discount! I expect discount will narrow again in coming weeks and wil go back to minus 10 or even better.
A more detailed description can be find below of all facts and figures.
Current Situation:
Discount to NAV: COP.UN is trading at just over a 20% discount to its net asset value (NAV). Essentially, this means you can buy copper exposure at a significant discount to the current market price.
Copper Storage and Transfers: The trust’s copper is stored in LME-approved warehouses and is increasingly being shipped to COMEX warehouses in the U.S. The reason is straightforward: copper prices on COMEX are currently higher than on the LME. By moving copper to COMEX, Sprott can sell inventory at better prices.
Mechanism for Payouts: The proceeds from selling copper at a premium on COMEX versus the LME can be distributed to unitholders as a special cash distribution (dividend). This provides a direct way for investors to benefit from arbitrage between exchanges.
Redemption Option: Institutional investors can redeem trust units for physical copper, subject to minimum tonnages and fees. This helps keep the trust price connected to physical copper markets and offers an arbitrage route if the discount remains wide.
The Opportunity:
This setup offers trading houses huge opportunities:
Arbitrage Play: Buy COP.UN units at a >20% discount, redeem them for physical copper, and sell the metal at spot prices, pocketing the spread (net of costs).
Dividend Upside: Hold COP.UN units and potentially benefit from future special dividends if Sprott continues moving copper to COMEX and realizing higher sales prices.
Useful Resources:
COP.UN Prospectus (Sprott Physical Copper Trust) cop-prospectus-en.pdf

Ethereum Bullish Rally IncomingIf Ethereum can break above that point and clear $2,840, this level will turn into a major support, where fresh supply waits. However, a drop below the 200-EMA could lead the price to retest $2,400. A break below this level would shift momentum negative and risk a slide toward the April low near $1,500.
Read More at: www.cointrust.com

Trading Range of the Day 9-JULY-2025Trading Plan
1- SSL and BSL
2-sweeping of the triple buttom and i confused it as CISD and made sell order and later SL was hit
3-there was iFVG which is very beneficial in trading that make compensation and profit
4-there was always a chance to enter the market perfectly even when your SL hit
5-there was disrespection to the H2 and H4 fvg
6-iFVG and FVG on lower timeframe when mixed with Bias and direction of the market ,i will give you a beatiful profit
Thank you

Santos pumpNumerology, as well as testing of an important level, is where altcoin pumps often occur very strongly. I am already entering the trade.

Retail trapped. Volume confirmed. Liquidity targeted.🔻 We are in a highly reactive zone where emotional long entries and early short SLs create perfect liquidity magnets.
🔍 Key Levels & Zones:
• Early Short SL Zone → 3337.2
• Retail FOMO Entry Block → 3251.9
• Volume-based Rejection Point → 3392.0 (SL/TP sweep)
• TP1 & TP2 Zones → 3251.9 / 3208.0
• Bonus TP → 3159.9 → Complete sweep of long SLs and demand exhaustion
• Final Trap Exit Zone → 3157.4 — Institutional reload zone
💡 Volume confirms this cycle of:
• Trap > SL hunt > Emotional entry > Volume fade > Dump > Accumulation > Reversal
🧠 This is NOT financial advice. I post to share deeper insight into manipulation mechanics & sniper-level liquidity structure analysis.
If you’re still trading candles, you’re playing retail games. Start seeing the architecture.
🧷#XAUUSD #SmartMoney #LiquiditySweep #VolumeStrategy #TradingPsychology #RetailTrap #SniperMindset

Gold Drops to 3,284 – Short-Term Support at Risk📊 Market Overview
Gold fell sharply this morning to $3,284/oz amid a modest USD rebound and profit-taking pressure following several range-bound sessions. The lack of fresh catalysts also contributed to weaker momentum.
📉 Technical Analysis
• Key Resistance: 3,315 – 3,330
• Nearest Support: 3,280 – 3,275
• EMA 09: Price is currently trading below the EMA 09 on both the H1 and H4 timeframes → short-term bearish signal
• Candle Patterns & Momentum:
– H1 candle shows a bearish engulfing pattern near the 3,305 area → confirms downward pressure
– RSI is below 45, MACD has crossed below its signal line → bearish momentum dominant
– If the 3,275 level is breached, gold could continue to fall toward 3,260
📌 Outlook
Gold is leaning toward further downside unless it can hold above the 3,280 support level during today’s session.
💡 Trade Strategy
🔻 SELL XAU/USD at: 3,295 – 3,398
🎯 TP: 40/80/200 PIPS
❌ SL: 3,305
🔺 BUY XAU/USD at: 3,275 – 3,278
🎯 TP: 40/80/200 PIPS
❌ SL: 3,269

USDJPY still bullish to expect
FX:USDJPY strong bullish push, expectations are still bullish to see, currently we can see price is break ASCENDING TRIANGLE, JPY still looks the weakest, dont see changes, here still bull to expect.
SUP zone: 146.000
RES zone: 147.700

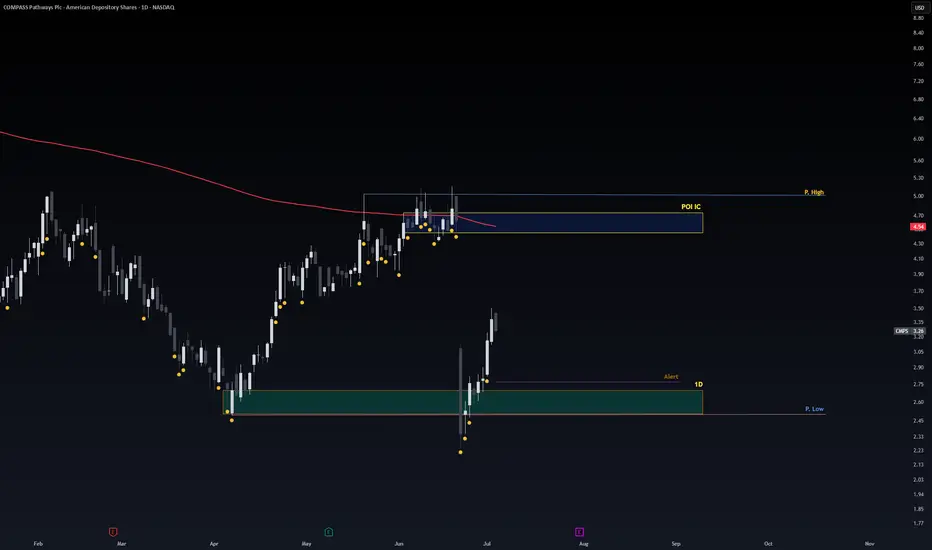
Safe Entry Zone CMPSStock Recovering from steep drop from bad news (which we don't care).
Blue Zone is Sell Zone.
Green Zone is Buy Zone.
since stock already rallied. its Risky to follow we wait price to re-test Green Zone.
Also My Beloved CAthie Wood BEST INVESTOR All Time (based on statics better than Warren Buffet Entire Histroy) Is BUYING!
Note: 1- Potentional of Strong Buying Zone:
We have two scenarios must happen at The Mentioned Zone:
Scenarios One: strong buying volume with reversal Candle.
Scenarios Two: Fake Break-Out of The Buying Zone.
Both indicate buyers stepping in strongly. NEVER Join in unless one showed up.
2- How to Buy Stock:
On 1H TF when Marubozu/Doji Candle show up which indicate strong buyers stepping-in.
Buy on 0.5 Fibo Level of the Marubozu/Doji Candle, because price will always and always re-test the
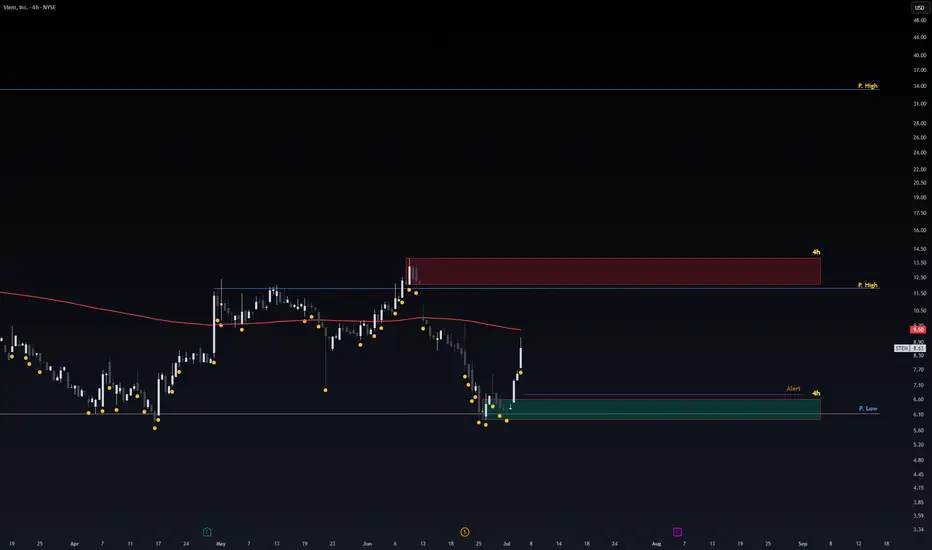
Safe Entry STEMPrice movement consolidating.
Safe Entry Green Zone.
Red Zone is Sell Zone. better watch out for any selling pressure.
P.high Lines Are Good Resitances.
Final Target 33.45$ price level.
better to wait stock and not follow.
Note: 1- Potentional of Strong Buying Zone:
We have two scenarios must happen at The Mentioned Zone:
Scenarios One: strong buying volume with reversal Candle.
Scenarios Two: Fake Break-Out of The Buying Zone.
Both indicate buyers stepping in strongly. NEVER Join in unless one showed up.
2- How to Buy Stock:
On 1H TF when Marubozu/Doji Candle show up which indicate strong buyers stepping-in.
Buy on 0.5 Fibo Level of the Marubozu/Doji Candle, because price will always and always re-test the
Safe Entry CNSNote: Lower TF to 1h or 4h to see better details.
Recently Trump lift chips design prohibition to be sent to china. (Positive to CDNS)
Stock Obvious and clearly at major resistance with such news it expected to open Gap Up.
following the stock would be mistake unless stock open in pre-market with price level similar to close.
better to wait stock to open gap up. Re-test the major resistance.
that would be major support level and safe entry for price to go higher.
Note: 1- Potentional of Strong Buying Zone:
We have two scenarios must happen at The Mentioned Zone:
Scenarios One: strong buying volume with reversal Candle.
Scenarios Two: Fake Break-Out of The Buying Zone.
Both indicate buyers stepping in strongly. NEVER Join in unless one showed up.
2- How to Buy Stock:
On 1H TF when Marubozu/Doji Candle show up which indicate strong buyers stepping-in.
Buy on 0.5 Fibo Level of the Marubozu/Doji Candle, because price will always and always re-test the

Safe Entry OracleStock In Up-Movement.
P.High (Previous High) is Safe Entry.
Note: 1- Potentional of Strong Buying Zone:
We have two scenarios must happen at The Mentioned Zone:
Scenarios One: strong buying volume with reversal Candle.
Scenarios Two: Fake Break-Out of The Buying Zone.
Both indicate buyers stepping in strongly. NEVER Join in unless one showed up.
2- How to Buy Stock (safe way):
On 1H TF when Marubozu/Doji Candle show up which indicate strong buyers stepping-in.
Buy on 0.5 Fibo Level of the Marubozu/Doji Candle, because price will always and always re-test the

Safe Entry Zone CHWYCurrently stock in Ranging Movement.
1h Green Zone is buying Zone.
1h Red Zone is selling Zone.
Price ranging with strong potional of Strong Up-Movement.
Note: 1- Potentional of Strong Buying Zone:
We have two scenarios must happen at The Mentioned Zone:
Scenarios One: strong buying volume with reversal Candle.
Scenarios Two: Fake Break-Out of The Buying Zone.
Both indicate buyers stepping in strongly. NEVER Join in unless one showed up.
2- How to Buy Stock:
On 1H TF when Marubozu/PinBar Candle show up which indicate strong buyers stepping-in.
Buy on 0.5 Fibo Level of the Marubozu Candle, because price will always and always re-test the imbalance.

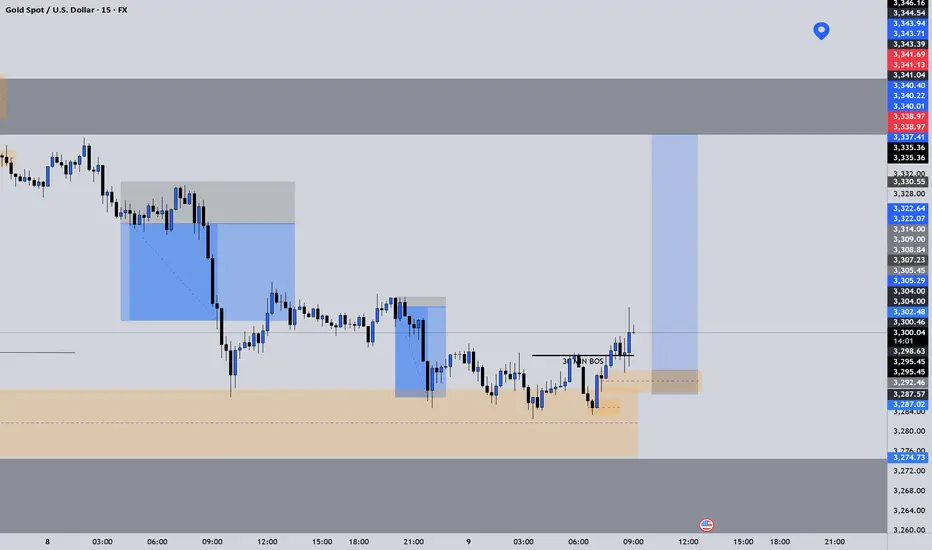
XAUUSD LongElite Analysis
Price came to primary OB.
30m Long BOS was confirmed.
Executed long trade from 10m OB.
Targeting above LP's and top market structure.
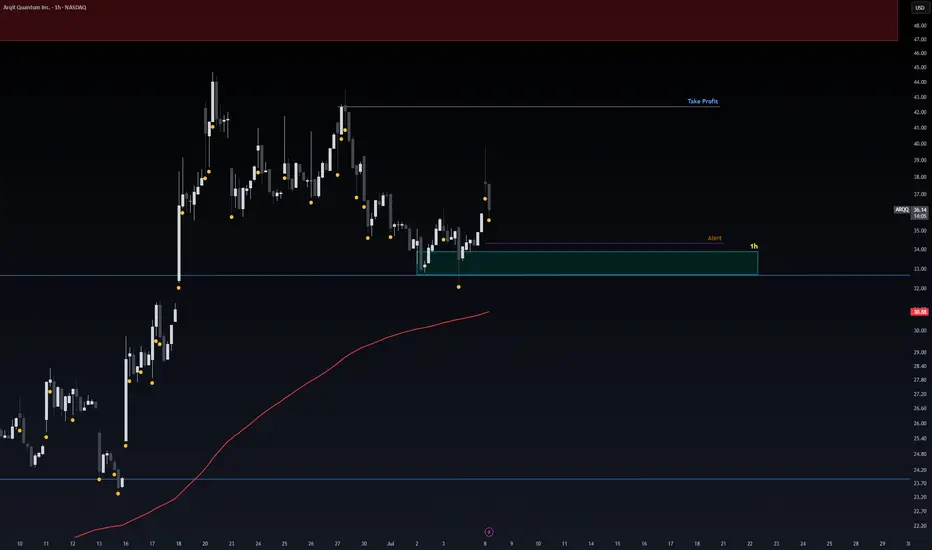
Safe Entry Zone ARQQStock in Up Movement.
1H Green Zone is Safe Entry.
Note: 1- Potentional of Strong Buying Zone:
We have two scenarios must happen at The Mentioned Zone:
Scenarios One: strong buying volume with reversal Candle.
Scenarios Two: Fake Break-Out of The Buying Zone.
Both indicate buyers stepping in strongly. NEVER Join in unless one showed up.
2- How to Buy Stock (safe way):
On 1H TF when Marubozu/Doji Candle show up which indicate strong buyers stepping-in.
Buy on 0.5 Fibo Level of the Marubozu/Doji Candle, because price will always and always re-test the
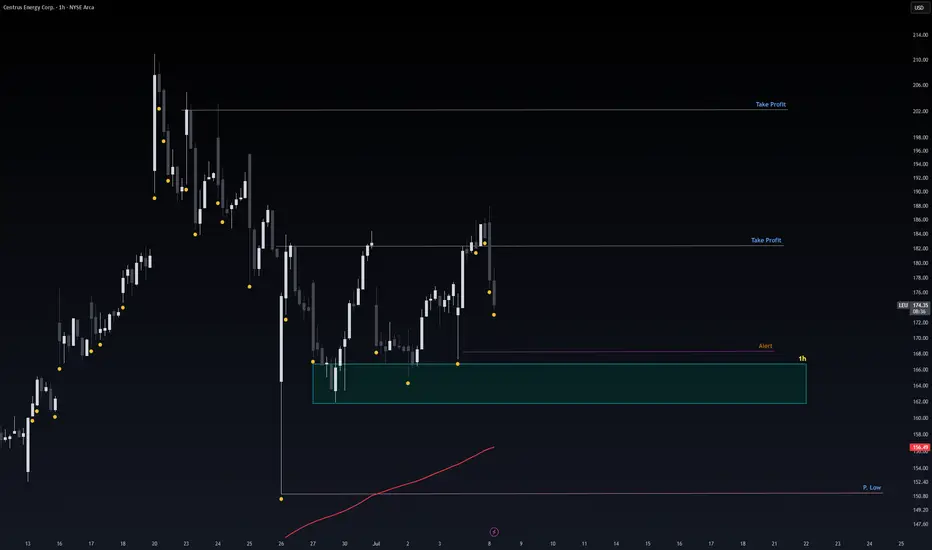
Safe Entry LEUStock Movement Ranging.
Current 1H Green Zone is Safe Entry, wait for confirmation for entry since the Zone been Tested before which means its weaker but since it has strong buying power i believe its safe.
Note: 1- Potentional of Strong Buying Zone:
We have two scenarios must happen at The Mentioned Zone:
Scenarios One: strong buying volume with reversal Candle.
Scenarios Two: Fake Break-Out of The Buying Zone.
Both indicate buyers stepping in strongly. NEVER Join in unless one showed up.
2- How to Buy Stock (safe way):
On 1H TF when Marubozu/Doji Candle show up which indicate strong buyers stepping-in.
Buy on 0.5 Fibo Level of the Marubozu/Doji Candle, because price will always and always re-test the
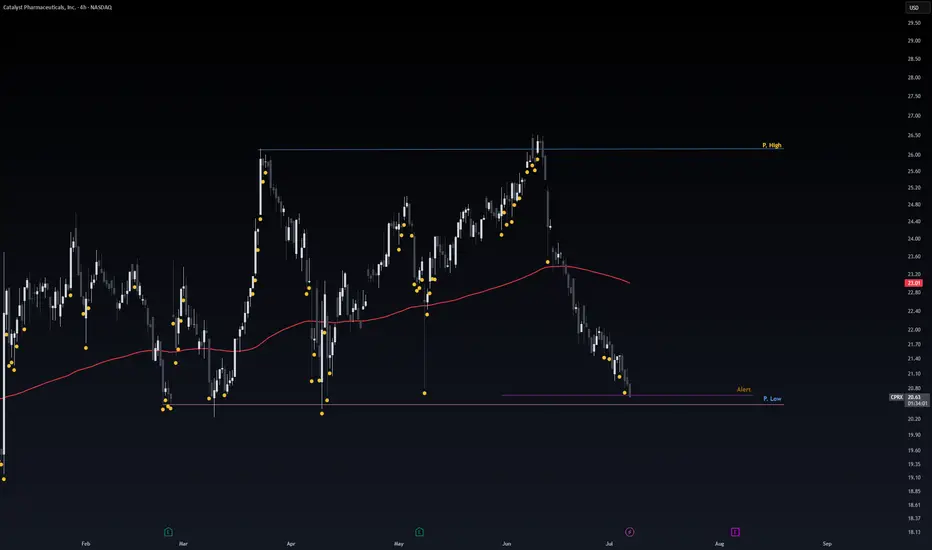
Safe Entry CPRXStock Movement Ranging.
Currently at Support level.
P.Low Zone is Buy Zone.
Target P.High Zone is Sell Zone.
Note: 1- Potentional of Strong Buying Zone:
We have two scenarios must happen at The Mentioned Zone:
Scenarios One: strong buying volume with reversal Candle.
Scenarios Two: Fake Break-Out of The Buying Zone.
Both indicate buyers stepping in strongly. NEVER Join in unless one showed up.
2- How to Buy Stock (safe way):
On 1H TF when Marubozu/Doji Candle show up which indicate strong buyers stepping-in.
Buy on 0.5 Fibo Level of the Marubozu/Doji Candle, because price will always and always re-test the
XAUUSD | Trap Architecture – Retail Burnout!! 🧠 THE REAL GAME – GOLD EDITION (XAUUSD)
This isn’t just a chart — it’s a decoded battlefield between smart money and emotional retail flow.
Every candle you see is backed by narrative and intent — this is not a TA guessing game; it’s Trap Warfare:
⸻
🔍 🎯 Map Breakdown:
1. Liquidity Engineering (Topside):
• 3,364.96 – 3,317.85:
Red zone = Trap Confirmation
Designed as a Retail Long Trigger Zone, disguised as breakout.
• Fake Buy Orders fill
• Retail gets euphoric
• Sellers slam — High RR trap mechanics
• Also doubles as Rejection Zone from previous LH
2. Volume-Free Manipulation Zone:
• “Buy > Sell Manipulation with Volume Fakeouts”
• Emotional entries happen here
• Volumes intentionally low to mislead momentum traders
• Fake Sell Order Wall at top, Fake Buy Order Wall below — both psychological
3. Major Demand Zone (3,246 – 3,257):
• Emotional buyers enter
• SL clustering occurs
• TP1 sits here for shorts
• Smart money fakes support to trap longs before sweeping it again
⸻
💣 3 TP Structure Breakdown:
• TP1 (3,257.85) – Emotional Buy Reaction + First Liquidity Pool
• TP2 (3,214.98) – Liquidity Reaction, Retail SL Triggered
• Bonus TP (3,173.28) – Deep Sweep Zone + Institutional Reload Area
Only valid if Panic Sell Candle + Spread Widening
⸻
🧨 Smart Money Logic Built In:
• Trendline Respect = False Confidence
• Retail SL + Pending Orders = Mapped & Manipulated
• Rejection Zone = Confirmed Burn Trap
• Resting Liquidity Below = Magnet for market makers

SOL/USD in Clear Downtrend – Short Setup in PlayHi traders! , Analyzing SOL/USD on the 30-minute timeframe, price is currently moving within a defined descending channel, respecting lower highs and lower lows. A recent rejection from the channel top suggests continuation to the downside.
🔹 Entry: 150.09
🔹 Take Profit (TP): 145.47
🔹 Stop Loss (SL): 154.51
The price failed to hold above the 200 EMA and has resumed its downward trajectory. The RSI shows a recent bounce from overbought levels, supporting the bearish momentum. This short setup offers a favorable risk-reward ratio within the context of the broader downtrend.
A clean rejection at resistance and confirmation of the trendline add confluence to this trade idea. Keep an eye on the 145.47 zone, where buyers may attempt to defend the support.
⚠️ DISCLAIMER: This is not financial advice. Every trader is responsible for their own decisions and risk management.

GBP/USD Rebounds Inside Channel – Long Opportunity in MotionHi traders! Analyzing GBP/USD on the 30-minute timeframe, price is currently respecting a descending channel, showing signs of a bullish bounce after retesting lower support.
🔹 Entry: 1.3586
🔹 Take Profit (TP): 1.3618
🔹 Stop Loss (SL): 1.3555
Price is attempting to recover after holding at the bottom of the channel, and is now pushing toward the 20 EMA. If momentum builds, a retest of the upper trendline and the 1.3618 zone is likely. RSI is slightly recovering from neutral levels, adding confluence to this rebound setup.
This long trade offers a solid risk-to-reward ratio within a possible short-term counter-trend move. Watch closely as price approaches dynamic resistance.
⚠️ DISCLAIMER: This is not financial advice. Every trader is responsible for their own decisions and risk management.

FTNCOCOA FTN Cocoa Processors PlcFTN Cocoa Processors Plc price action just formed an inverse head and shoulders pattern.
Current price: 2.00 (at Neckline Resistance)
Investment buy reasons:
1. Notable higher highs created from 0.94 to 1.47
2. Current price is a low risk buy, as price action has retraced over 50% from all time high of 4.1
Profit taking areas if price action breaks neckline resistance: 2.97, 3.96
Note: This Analysis invalidates below. 1.47
Disclaimer:
This is for educational purposes only and does not constitute financial or investment advice. Always do your own research and consult with a professional before making any investment decisions.

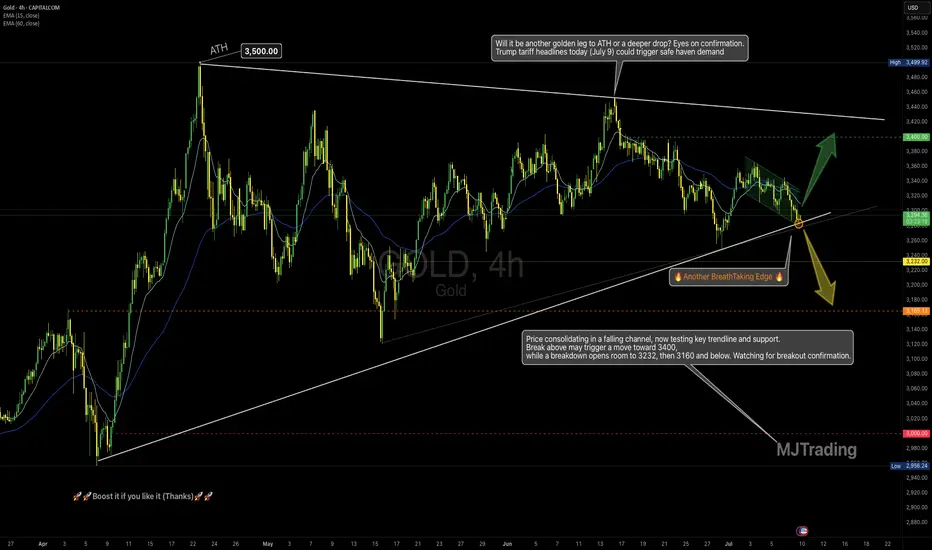
Gold at a Decision Point-Just as Tariff Headlines Return(July 9)📌
4H Technical Outlook by MJTrading
Price is compressing inside a falling channel, nested within a large symmetrical triangle, and now sits right at a high-stakes confluence zone — a perfect intersection of dynamic EMAs, rising trendline support, and local structure.
This could be a pivot point for the next major leg.
🧭 Key Scenarios:
🟢 Bullish Breakout Potential:
If price breaks above the falling channel and holds above $3,310–$3,320:
🎯 Target: $3,400, and eventually upper triangle resistance near $3,480–$3,500
✅ Watch for impulsive breakout + retest confirmation
🟡 Bearish Breakdown Risk:
If the rising trendline gives way and price closes below $3,275 (High Risk) and $3,245(Low Risk):
🎯 Targets: First $3,232, then key level $3,166
⚠️ Further weakness may expose $3,000 psychological support
🔍 Why It Matters:
• Symmetry + compression = potential volatility expansion
• Trump tariff headlines today (July 9) could trigger safe haven demand
• Strong historical respect of these trendlines
• EMAs aligning around decision zone
“Another BreathTaking Edge” — because this is one of those moments where market structure whispers louder than words.
🗣 Boost if you find value, and follow MJTrading for more clean setups.🚀🚀
#XAUUSD #Gold #TradingView #TechnicalAnalysis #ChartPatterns #PriceAction #BreakoutTrade #Forex #MJTrading
Zoom in to get closer to battlefield:
Zoom out to see where we are:
DAX / GER TIME TO PRINT MONEY ON SHORTTeam, i have not been posting DAX/GER for almost 3-4 weeks
now it is time to attack the DAX.
I have set two different target ,
ensure you take 60% and bring stop loss to BE
I also want to give you the time frame for target to hit.. do not expect today, however we could see the target for tomorrow or early next week
Sometimes i wait for the right moment to trade. DAX is very sophisticated to trade with, but if you have the patience, you can make money on them.
