SellRejection Level
Daily Volume
Market Structure Shift
London Session
Trend Line Break
Untapped Order Point
Beyond Technical Analysis
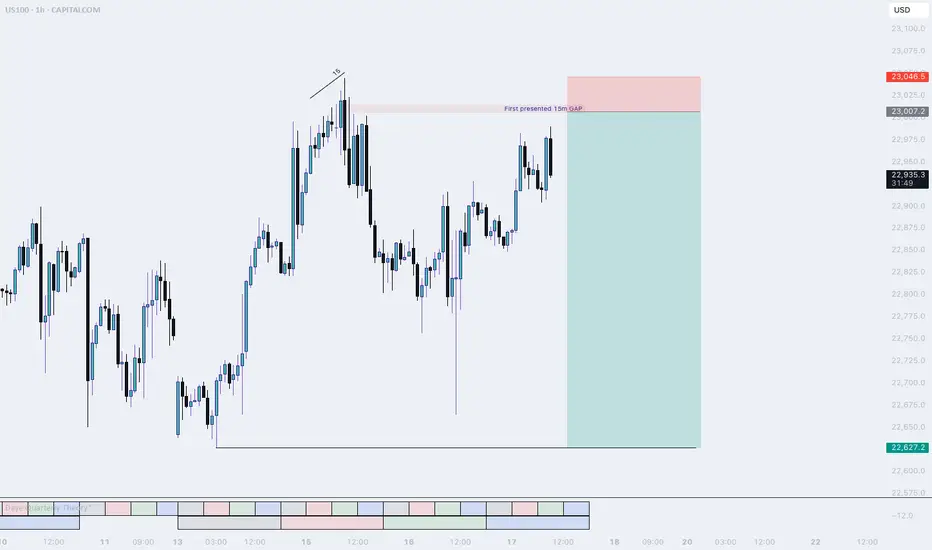
NQ, Short setupJust before market Open price dropped lower, I expect price to travel back up into the 15 m Gap and then sell off. This is the only setup I am interested in today.
The 15m level will be a resistance level for price. This level is derived from the last reversal. Since NQ was lagging, i expect price to use his level to squeeze the shorts out and start a new down trend.
If this does not happen and the highs get taken out, I will be flat today
Goodluck, Good trading.
F
EURUSD- Bearish momentum expected at 15 minute Time frameEURUSD Bearish momentum Bearish momentum Expected based on market making perfect TBS and Model 1 at the strong PRZ level as indicated by RSI also. accordingly Expecting atleast 50% target hit as TP1 and then 100% :) cheers . have a blessed friday.

Today's GOLD Analysis (MMC) – Bullish Momentum Building Ahead🔍 Market Overview:
Gold is currently showing signs of a bullish reversal structure after experiencing a downward correction. Price action has reacted strongly from well-defined demand zones, suggesting institutional buying activity at key levels. The current setup highlights a clear accumulation phase transitioning into a potential markup phase, driven by buyers regaining control.
🧱 Chart Structure Breakdown:
1️⃣ Initial Channel Formation (Left Side of Chart)
After a major downtrend, price began consolidating within a rising channel, indicating a retracement or correction phase.
This ascending channel showed a short-term bullish effort, but eventually broke to the downside, resuming the dominant bearish flow temporarily.
2️⃣ Previous Reversal Zone ($3,312 – $3,322)
This is the origin of the recent bullish move, where price strongly reversed after heavy selling.
The reversal formed a long bullish wick and an engulfing candle—clear signs of buying absorption.
This level has historical confluence, acting as both support and prior demand.
3️⃣ Mini SR - Interchange Zone ($3,327 – $3,335)
This zone is a mini structure level where previous resistance has now become support (SR Flip).
The area acted as a platform for the recent bullish reaction.
This zone also aligns with the interchange of order blocks, adding more confluence to the bullish argument.
4️⃣ Bullish Pattern Formation
Price formed a micro double bottom/inverse head and shoulders structure just above the Mini SR.
The pattern suggests strong base-building and provides momentum for the current bullish move.
Confirmation came after the neckline breakout and retest within the Central Zone.
5️⃣ Central Zone ($3,340 – $3,345)
This is an intraday pivot area, acting as a decision-making zone between buyers and sellers.
Price is currently testing this zone with strong bullish candles.
A clean break above this level increases the probability of further upside.
6️⃣ Reversal Zone 1 ($3,345 – $3,353) – ✅ Condition 1
Price is now entering this zone, where previous price rejections occurred.
If buyers can maintain momentum and break above this zone on strong volume, it will validate the bullish continuation thesis.
This zone is also an ideal area to monitor for partial profit-taking or potential short-term rejection.
7️⃣ Reversal Zone 2 ($3,365 – $3,375) – ✅ Condition 2
This is the next significant resistance block.
If price reaches this level, it could face heavy resistance and profit-booking from swing traders.
However, a breakout above this zone could lead to a much larger bullish wave, targeting $3,390+.
🎯 Trade Setup Idea:
Long Bias: Above $3,335 with targets at $3,353 (TP1) and $3,370 (TP2)
Risk Invalidation: Break below Mini SR zone ($3,327) may invalidate bullish thesis
Aggressive Entry: At retest of Mini SR after pattern breakout
Conservative Entry: On breakout and close above Reversal Zone 1 with confirmation
🧠 Trader’s Mindset:
The market is showing a clear shift in momentum, but buyers must sustain control above key levels.
Stay patient at resistance zones; avoid chasing.
Watch for rejection wicks or bearish divergence near Reversal Zone 2 if you're looking for a counter-trade.
📌 Summary:
📈 Bias: Bullish (as long as $3,335 holds)
💡 Opportunity: Breakout from Mini SR with structure support
📉 Risk: Failure to hold central zone could trigger retest of lower support
🚀 Potential: If momentum continues, gold could revisit July highs near $3,390–$3,400

NVDA Nearing it's top, When to Buy in?Hi, I’m The Cafe Trader.
This week we’re continuing our breakdown of the MAG 7, and today we’re taking a look at NVIDIA (NVDA) — 2 out of 7 in the group have broken out to new all-time highs, and NVDA is one of them.
⸻
🧠 Analyst Targets
Analyst price targets for NVDA are wide-ranging — some as low as $80, others as high as $250.
The average target is around $180, and NVDA is currently approaching that level.
Buying into strength like this can be difficult, so I’ve prepared a few long-term price zones for those looking to add on dips.
⸻
📈 Long-Term Price Zones to Watch:
• Aggressive Entry Zone: ~$163
This is the top of a developing demand zone. You’ll see some buyer interest here, but that demand extends down toward $144.
• Primary Demand Area: $153–$144
This is where stronger buyers have shown up in the past. It’s a more balanced zone and could act as a key support in any retracement.
• Deep Value Zone: ~$129
If NVDA pulls back this far, this would be my favorite buy level. Anything at $130 or lower would represent what I consider a steal — strong value relative to long-term expectations.
⸻
📊 Follow for more MAG 7 price breakdowns.
Up next: a deeper dive into NVDA for shorter-term swing trades and technical setups.
📍@thecafetrader

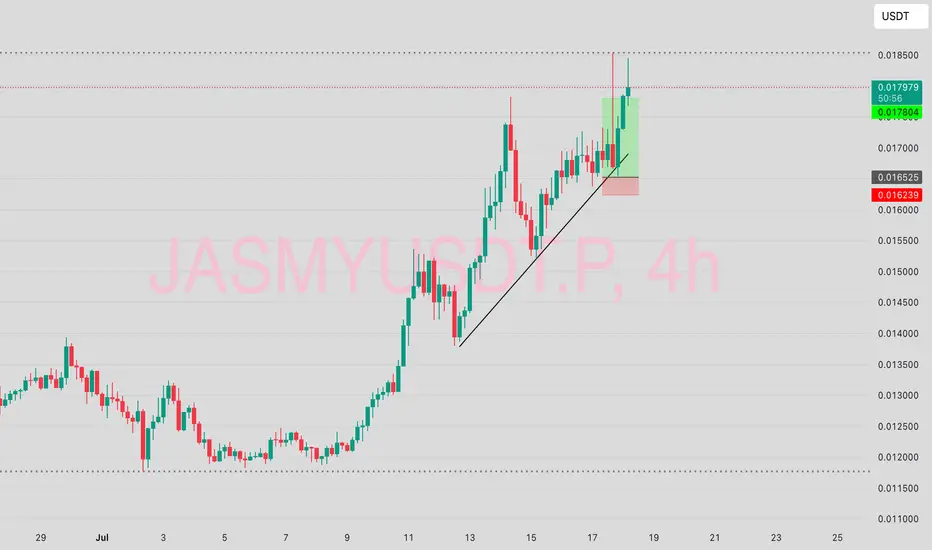
$JASMY LONGTake yet another look at this trade BYBIT:JASMYUSDT.P
Missing my entry with a few pips down but reversed to my Target.
This is a 1:5RR and I just missed it?
I've been missing sweet entries here and it hurts to see them play out exactly as predicted.
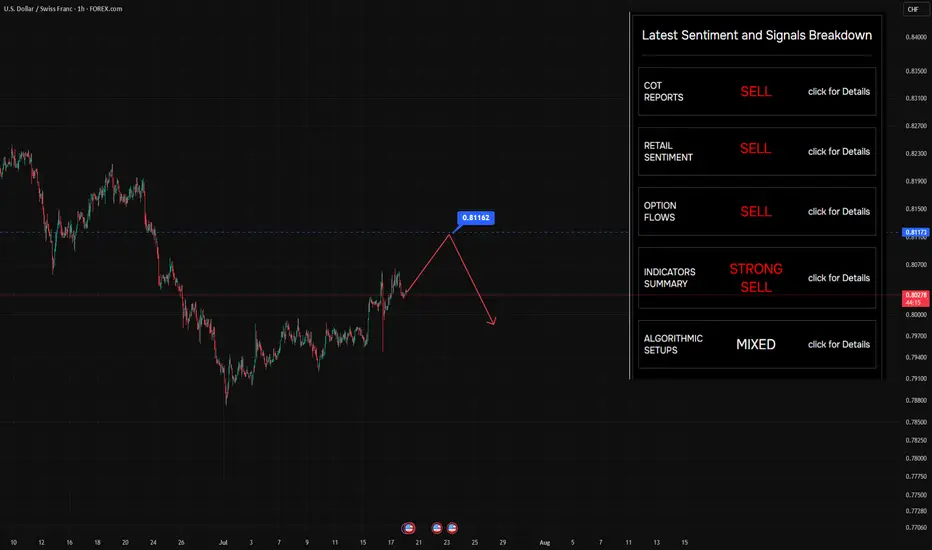
Still looking to sell on rallies — nothing’s changedStill looking to sell on rallies — nothing’s changed. The level on the chart? That’s where buyers jumped in before. Makes sense to target it again.
So… why do we say there are "suffering buyers" at this level?
Let’s rewind a bit (see Chart #2) and imagine price at the point marked on the chart.
At that moment, price had clearly returned to a visible local level — 0.8123 — a zone that naturally attracted traders to jump in on the fly , or triggered limit orders .
But here’s what happened next:
Selling pressure overpowered buying interest — and price moved swiftly lower .
That’s when those buyers got caught.
That’s when the pain started.
🔍 What Makes This Level Special?
Broker data from open sources confirms that open positions are still sitting at this level — meaning a lot of traders are underwater, hoping for a recovery that may never come.
It’s not just technical structure.
It’s crowded sentiment , failed expectations , and trapped capital — all wrapped into one.
🧠 This is what we call a "suffering trader" zone — and it often becomes a magnet for future selling .
📌 Follow along for more breakdowns on flow, positioning, and market sentiment .
GOLD LONG FROM RISING SUPPORT|
✅GOLD is trading in an uptrend
And the bullish bias is confirmed
By the rebound we are seeing
After the price retested the support
So I think the growth will continue
LONG🚀
✅Like and subscribe to never miss a new idea!✅
Disclosure: I am part of Trade Nation's Influencer program and receive a monthly fee for using their TradingView charts in my analysis.

BTCUSD | 1W Time Frame | BITSTAMP ExchangeI have been using curve analysis for Bitcoin on the weekly time frame for a long time, employing two indicators: My BTC Log Curve and Bitcoin Logarithmic Growth Curves, of course, with my own custom settings to achieve maximum harmony with price movements. I recommend that to gain a precise understanding of Bitcoin curve analysis, you search for and study it, and make use of the two free indicators mentioned above.
Bitcoin finally managed to break free from the curve floor in the second week of September 2023, initiating a logical and gradual upward trend. Currently, it is supported by a significant level around $84,000 (keeping in mind that this rate will gradually increase due to the market's floating nature). However, the most critical price ceiling for Bitcoin in the current bullish market trend is approximately $154,000. Given the acceptable momentum of the current upward trend, reaching this price target seems reasonable. Nevertheless, we should anticipate a corrective reaction from the market, considering the historical behavior in this price range.
In summary, it can be stated that for mid-term holders, the price target of $154,000 appears to be a realistic and attainable goal, while the price floor of $84,000 serves as a very suitable level for buying and re-accumulating.

XAUUSD Sell Setup "XAUUSD Sell Setup 📉
Price rejected strongly from the descending trendline resistance.
Bearish momentum still active below 3345 zone.
Selling from this level targeting 3311 with tight SL above 3358.
Trade safe & stick to your plan! 💪✨

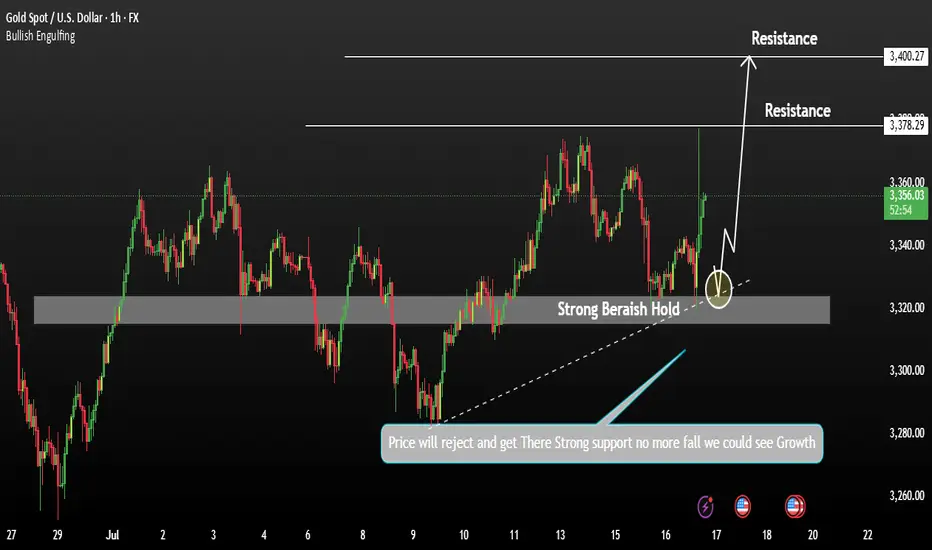
Gold Pullback in play Aiming Growth for 3400Gold prices initially rejected from recent highs and found strong support, indicating limited downside. Despite the recovery, gold remains under pressure due to rising U.S. bond yields and a stronger U.S. dollar. The higher-than-expected inflation data from the U.S. has reduced the likelihood of an early Fed rate cut, which is weighing on the metal.
Technical Analysis:
If the 1H candle closes above 3350, the price is likely to push back into the bullish zone.
Potential upside targets: 3378 and 3400
You any see more details in the chart.
PS: Support with like and comments for more better insights Thanks for Supporting.
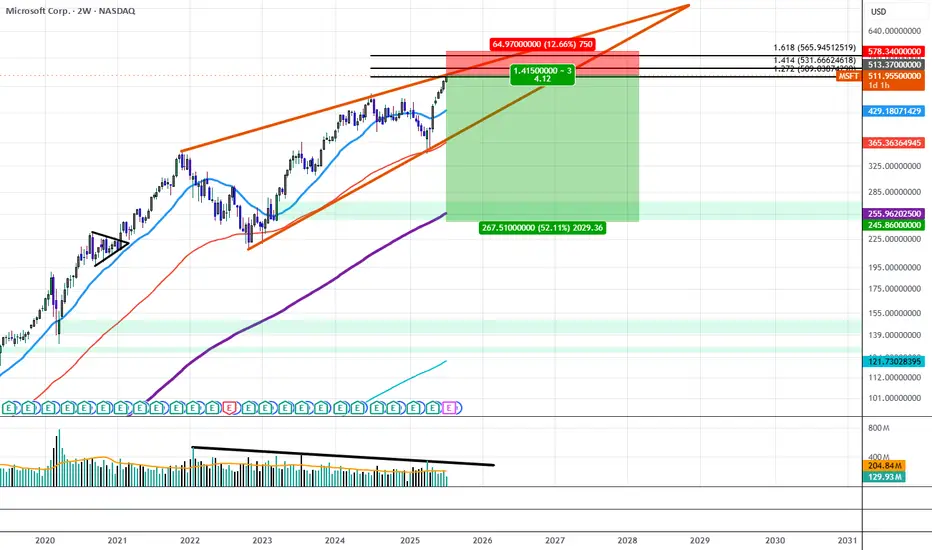
Microsoft Sees Declining Trading Volume Despite All Time HighsSince December of 2021, MSFT traded within a Rising Wedge structure that has gradually resulted in lower and lower highs in volume, at the same time IV on the Options Chain has begun to price down the strikes above $515 while Shorter Term Downside IV has begun to price up all the way out to $240.00. If this trend continues we will likely see the $515 area act as strong resistance as liquid interest above it begins to dry out.
This could be the beginning of a move to break down the wedge and trade down to the lower strikes first targeting the $365 price level and resolving around $240 near the 200 Period SMA.
Has the DXY got you confused? Well, check out this analysis.Welcome back, traders, it’s Skeptic from Skeptic Lab! 😎 , the DXY has entered a corrective phase over the past weeks. In this analysis, I’ve broken down the technicals and chart with a skeptical eye, outlined long and short triggers on the 4h timeframe , and tried to give you a solid multi-timeframe view of the setup. At the end, I’ve shared a key educational tip that can seriously boost your win rate and R/R , so make sure you check out the full analysis.
💬If you’ve got a specific symbol in mind for analysis, drop it in the comments. Have a profitable Friday, fam <3

PG Approaching Oversold Discount Zone Ahead of Q4 Earnings BTFD?📝 Procter & Gamble (NYSE: PG) is trading at $153.73 (-10.8% YTD), lagging the S&P 500’s +6.5% YTD gain. Despite recent weakness, a confluence of technical support, dividend resilience, and a looming catalyst could signal a tactical entry. Let’s break it down:
🔍 Fundamentals & Catalysts
Q4 Earnings Webcast (July 29):
P&G will webcast Q4 results at 8:30 AM ET, with focus on organic sales growth (guided at +2% FY25) and margin trajectory 14.
EPS Expectations: Q4 consensus at $1.43 (+2.1% YoY); FY25 core EPS guided at $6.72–6.82 (2–4% growth) 410.
Dividend Fortress:
Quarterly payout raised to $1.0568/share (ex-div: July 18), marking 69 consecutive years of increases and a 2.75% yield 612.
Payout ratio at 67% of earnings – sustainable for a consumer staple 6.
Cost Pressures & Mitigation:
Tariff Headwinds: $1B–$1.5B annual cost hit from U.S.-China tariffs 410.
Offsets: $2.4B dividend payouts + $1.4B buybacks in Q3; 280bps gross productivity savings 10.
🌍 Macro & Risk Factors
Consumer Softness: Q3 net sales fell -2% YoY; volume declines in Baby Care (-2%) and Fabric & Home Care (-1%) segments 10.
Pricing Power: Average +1% pricing in Q3 (led by Grooming/Health Care), though mix/elasticity risks persist 104.
Structural Shifts: Portfolio pruning (minor brand exits) and job cuts to offset tariff impacts 4.
📉 Technical Setup: Oversold with Base-Building Potential
RSI 31.5 (Neutral but nearing oversold) 511.
Price vs. MAs: Below all key MAs (20-day: $159.17, 50-day: $161.59, 200-day: $165.56) – signaling bearish momentum but extreme discounts 5811.
Support Zone: $152–153 aligns with 52-week lows ($151.90) and the 2025 dividend-capture floor 212.
MACD -1.57: Suggests potential reversal if momentum shifts 5.
Technical Indicators Summary:
Indicator Value Signal
RSI (14) 31.45 Neutral
MACD (12,26) -1.57 Buy
Price vs. 200D SMA -7.1% Sell
Bollinger Bands (25) $157–161.94 Sell
🎯 Probabilistic Price Targets
Scenario Target Probability Rationale
Bounce to 20D MA $158–160 60% Mean reversion + dividend ex-date support
Reversion to 50D MA $162–164 45% Technical confluence + tariff resolution hopes
Rally to 200D MA + ATH $174 25% Bull case: Macro stabilization + guidance upgrade
📌 Trade Strategy
Entry: $152–154 (aligns with structural support) 28.
Stop Loss: $149.50 (1–2% below July 16 low of $152.27) 2.
Targets: Scale out at $160 → $164 → $174.
Catalysts: Q4 earnings (July 29) + clarity on tariff mitigation 14.
Position Size: Allocate 3–5% of portfolio; pair with long-volatility hedge.
⚠️ Key Risks
Guidance Miss: Sluggish volumes or tariff escalation could pressure FY26 EPS projections.
Technical Breakdown: Close below $151.90 invalidates support, inviting a slide to $145.
Macro Sensitivity: Consumer staples underperformance if inflation rebounds.
💎 Final Take
PG offers a rare combo: defensive yield (2.75%) + oversold technicals + imminent catalyst. While tariffs and consumer weakness justify caution, the $152–154 zone is a high-probability dip-buying opportunity. Earnings day vol could amplify moves – enter pre-event with tight stops.
#PG #ConsumerStaples #DividendKing #EarningsPlay #Tariffs
Disclaimer: This is not financial advice. Conduct your own due diligence.

$Doge Dogecoin about 60% retracement from all time high...CRYPTOCAP:DOGE dogecoin has retraced about 60% from an all time high of about 0.49
Current price: 0.20
Reasons why i am bullish on #Doge
CRYPTOCAP:DOGE price action has remained above the 200ema on the weekly timeframe ...bullish!
- $dogecoin has committed an over 60% retracement from all time high of 0.49
- It is currently at double bottom support seen in April
#dogecoin negative money flow is thinning out
- Sentiments are neutral : neither greedy for fearful
- Price action is exactly at point of control on the weekly time frame!
Resistances above to watch: 0.32, 0.42 up to 0.69


EURUSD Short ProjectDescription:
1. Price Drivers: smart money distribution
2. Current Trend: down
3. Momentum: confirmed bearish
Action: Waiting for entry on the intraday timeframe (Entry will be published further)
*Disclaimer: I will not accept liability for any loss or damage, including without limitation to any loss of profit, which may arise directly or indirectly from use of or reliance on such information.

Solana Update: Miss This Analysis, Miss the Next Leg!Hey, I’m Skeptic! 🩵 Solana’s recently kicked off a strong uptrend momentum , and there are solid triggers waiting to activate that could bring good profits. In this analysis, I dove into Solana on weekly, daily, and 4-hour timeframes, and checked SOLBTC and BTC.D too, to get a grip on the current liquidity flow.
💬What’s your trigger on Solana? Drop it in the comments, and if you want an analysis on a coin, write it for me so I can check it out.

USDCAD bearish view
OANDA:USDCAD again on this pair, first analysis accurate, in new look having bearish view, price in PA moving, still we having nice structure, price is now come back in channel, looks like breaking first channel, which will take for confirmation and sign for bearish expectations.
SUP zone: 1.37400
RES zone: 1.36400, 1.36100

USD/CHF hoping lower. before major up turnA note to myself:
- remember no matter what happens. its a 50/50 chance you are right. even with a winning
strategy.
- whats going on inside of yourself. why? whats it trying to tell you?
- what have you learned about yoursefl?
- be patient, take a breathe and be aware of FOMO
- Its not about quantity. its about quality.(choose MAX. 3 trades a week)
- stick to your plan. load up on quality trades.
- RISK MANAGEMENT is the key to being a successful trader AND Risk Reward Ratio minimum 1:3 w

Catch the bounce on NVDAHi, I'm The Cafe Trader.
We’re taking a deeper dive into NVIDIA (NVDA) — one of the leaders in the MAG 7 — with a short-term trade setup you can apply to both shares and options.
Setup Context:
NVDA is pushing into all-time highs, and we’re now approaching the average analyst price target (around $180). While we don’t know how price will react at this level, traders should be watching for pullbacks and trend continuations — prime zones for entry.
If we get a strong move down, I see $153 as a high-probability bounce area — where buyers are likely to step in aggressively.
Price Target Outlook:
The final price target will depend on how price moves into this zone:
- If NVDA runs to $200 before pulling back, targets shift higher.
- If it tops out around $180, we adjust accordingly.
That said, an initial bounce toward $169–$170 looks reasonable.
Options Note:
If NVDA sells off hard and fast, implied volatility (IV) will spike, making options expensive and reducing your edge. This is a setup that could play out over 2–3 weeks, but the first bounce could be quick — so timing matters.
Strategy: Staggered Entry Using Two Contracts
Use two contracts — one short-term, one mid-term — to maximize reward while managing time decay.
Contract 1: Short-Term (3–5 Days to Expiry)
Trigger Entry: As soon as price taps the demand zone (~$153)
Strike Entry Price ^^Target Price
155 $2.00 ^^ $6.00
157.5 $1.50 ^^ $4.50
160 $0.75 ^^ $2.50
You’re looking for a quick reaction: get in, take profit, and step aside while the market finds new balance.
Contract 2: Medium-Term (7–10 Days to Expiry)
Timing Tip: Wait for NVDA to stall or consolidate after the initial bounce — this is when IV comes down and contracts get cheaper.
Strike Entry Price ^^Target Price
155 $3.00 ^^ $15.00
157.5 $2.50 ^^ $12.50
160 $1.80 ^^$9.00
Important: Be careful trading too close to earnings. Contracts tend to get overpriced right before and after earnings drops.
That wraps up the short-term NVDA view.
Stay tuned for more trades and setups across the MAG 7.
@thecafetrader
Take care, and happy trading!

Advanced Order Types in ECN TradingAdvanced Order Types in ECN Trading
Electronic Communication Networks (ECN) have transformed the landscape of financial trading, offering direct market access and enhanced transparency. Central to ECN trading is the use of various order types, each tailored to specific strategies and risk management approaches. This article delves into advanced order types, providing traders with essential knowledge for navigating this dynamic trading environment.
Understanding ECN Trading
Electronic Communication Network (ECN) trading represents a pivotal development in financial markets, offering a pathway for traders to connect directly with each other without requiring intermediaries. This system functions through an electronic network that efficiently matches buy and sell trades, contributing to greater transparency and tighter spreads in the market.
In an ECN environment, traders can see the best available bid and ask prices, along with the market depth, which includes potential entries from various market participants. This visibility into the market's order book enables more informed decision-making as traders gain insights into potential market movements and liquidity.
A key advantage of ECNs is the anonymity they provide, enabling traders to execute transactions without exposing their strategy. This feature is particularly effective for large-volume traders who wish to avoid market impact.
ECN brokers, tend to offer lower costs compared to traditional market makers, as they typically charge a fixed commission per transaction rather than relying on the bid-ask spread. Such a cost structure can be advantageous for active traders and those employing high-frequency trading strategies.
Basic Market Order Types Explained
Forex and CFD trading involves several different order types, each serving unique strategies and goals. Among the most fundamental are market, limit and stop orders:
- Market: This type allows traders to buy or sell an asset at the current price. It's designed to offer immediate execution, making it ideal for traders who prioritise speed over control. They’re used when certainty of execution is more important than the execution price.
- Limit: Limit orders enable traders to specify the level at which they wish to buy or sell. A buy limit is set below the current price, while a sell limit is above. This type is used when traders seek to control the rate, accepting the risk of the entry not being filled if the market doesn’t reach their specified level.
- Stop: Stop orders act as a trigger for a trade. When the asset reaches the specified stop level, the stop becomes a market entry and executes a trade at the current price. It's a simple yet effective way to enter or exit the market at a predetermined point.
Advanced ECN Order Types
Advanced order types offer traders nuanced control over their transactions, catering to specific strategies and risk management needs. Here, we delve into three types: stop losses, trailing stops, and icebergs.
- Stop Loss: These are designed to limit a trader's loss on a position. A stop-loss order automatically sells (or buys, in the case of a short position) when the asset hits a predefined level. This tool is crucial in risk management, as it helps traders cap potential losses without the need to constantly monitor the charts.
- Trailing Stop: Trailing stop orders provide a dynamic way to manage risk. Instead of setting a fixed exit level like in a stop loss, a trailing stop moves with the current price at a set distance, potentially allowing traders to secure returns automatically as the market moves favourably, and adjusts to potentially protect against adverse moves.
- Iceberg: Named for the way only a small part of the total transaction is visible to the market, icebergs are used to buy or sell large quantities with small transactions. They prevent significant market impact, which could occur from a large trade and provide more discreet execution.
Stop Limit Orders Explained
In ECN trading, stop limit orders are an intricate yet powerful tool, blending the characteristics of stop and limit orders. A stop limit order type involves two prices: the stop price, which triggers the trade, and the limit price, at which the entry will be executed. It offers more control than a basic limit or stop order by specifying the exact range within which a trade should occur.
In a stop-limit buy order explained example, the stop price is set above the current price, and the limit price is set higher than the stop price. Once the stop level is reached, it becomes an order to buy at the limit price or better. It ensures that the trader does not pay more than a predetermined price.
The difference between a limit order and a stop order lies in their execution. A limit is executed at a specified value or better, but it doesn't guarantee execution. A stop, on the other hand, triggers at a specified price and then becomes a market entry executed at the current price. Stop limits merge these features, offering a targeted range for execution and combining the certainty of a stop order with the control of a limit order.
Conditional Orders
In ECN trading, conditional orders are sophisticated tools enabling traders to implement complex strategies. Here are the key types:
- One-Cancels-the-Other (OCO): An OCO links two orders; when one executes, the other is automatically cancelled. It's useful when setting up simultaneous profit and loss targets.
- One-Triggers-Another (OTA): An OTA activates a secondary instruction only after the primary order executes. They’re ideal for those planning successive actions based on initial trade execution.
- Ladder: This involves setting multiple orders at varying levels. As the market hits each level, a new order activates, allowing for gradual execution. They’re effective in managing entry and exit strategies in volatile assets.
- Order By Date (OBD): OBDs are time-based, executing on a specified date. It’s particularly useful for those looking to align their trades with specific events or timelines.
The Bottom Line
Mastering advanced order types in ECN trading may equip traders with the tools necessary for more effective strategy execution and risk management.
This article represents the opinion of the Companies operating under the FXOpen brand only. It is not to be construed as an offer, solicitation, or recommendation with respect to products and services provided by the Companies operating under the FXOpen brand, nor is it to be considered financial advice.