CRUDE OILPreferably suitable for scalping and accurate as long as you watch carefully the price action with the drawn areas.
With your likes and comments, you give me enough energy to provide the best analysis on an ongoing basis.
And if you needed any analysis that was not on the page, you can ask me with a comment or a personal message.
Enjoy Trading ;)
Beyond Technical Analysis

BTCUSDTPreferably suitable for scalping and accurate as long as you watch carefully the price action with the drawn areas.
With your likes and comments, you give me enough energy to provide the best analysis on an ongoing basis.
And if you needed any analysis that was not on the page, you can ask me with a comment or a personal message.
Enjoy Trading ;)
XAUUSDPreferably suitable for scalping and accurate as long as you watch carefully the price action with the drawn areas.
With your likes and comments, you give me enough energy to provide the best analysis on an ongoing basis.
And if you needed any analysis that was not on the page, you can ask me with a comment or a personal message.
Enjoy Trading ;)

EURUSDPreferably suitable for scalping and accurate as long as you watch carefully the price action with the drawn areas.
With your likes and comments, you give me enough energy to provide the best analysis on an ongoing basis.
And if you needed any analysis that was not on the page, you can ask me with a comment or a personal message.
Enjoy Trading ;)

US NAS 100Preferably suitable for scalping and accurate as long as you watch carefully the price action with the drawn areas.
With your likes and comments, you give me enough energy to provide the best analysis on an ongoing basis.
And if you needed any analysis that was not on the page, you can ask me with a comment or a personal message.
Enjoy Trading ;)

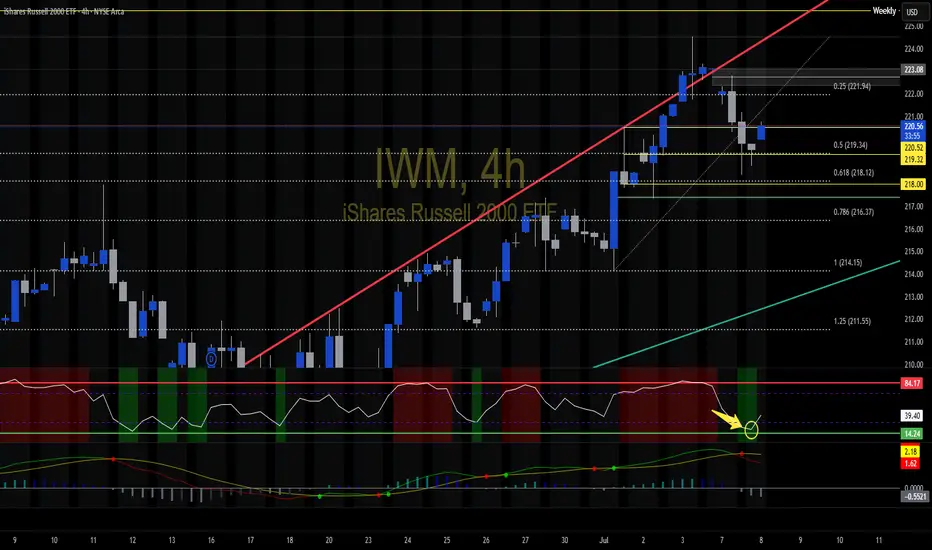
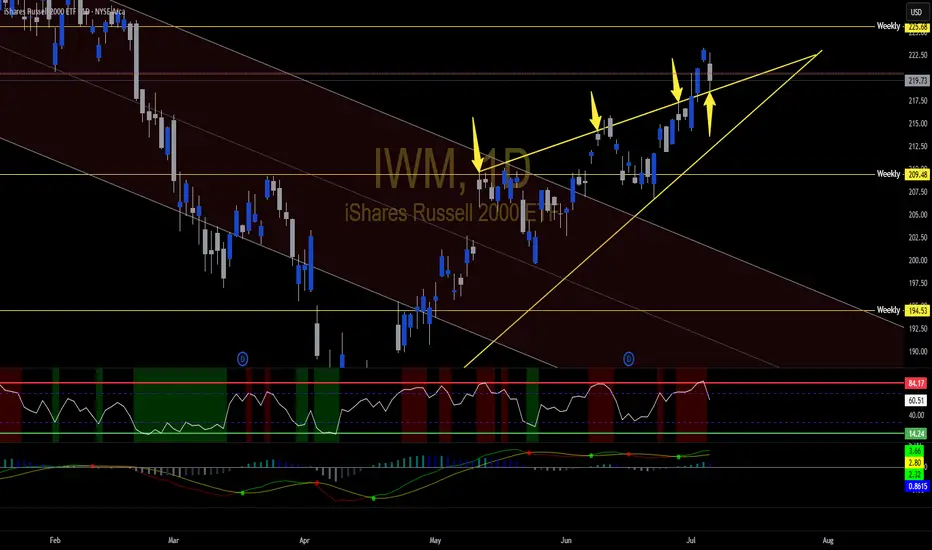
IWM 4hr chart cannot tell a FIBIWM bouncing out of the FIB golden pocket.... With the daily and this I like the odds of upside continuation..
How to Track Your Trades Like a ProThere are plenty of apps, platforms, and trading tools available for tracking your trades — but personally, I believe in creating your own solution. It’s simply more effective and, most importantly, more impactful.
Create your own spreadsheet in Excel, Google Sheets, or any tool of your choice.
The key columns to include are:
Trade date
Instrument
Position size (in number of contracts/shares and in monetary value)
Entry and exit prices
Result in % and absolute value
Stop-loss and take-profit levels
Risk-reward ratio (potential profit divided by potential loss)
Margin size (useful for trade planning)
Broker and exchange commissions
Comments (include reasons for entry/exit, emotional state, expectations, etc.)
Next, calculate and analyze the following performance metrics:
Win rate (% of profitable trades)
Average profit per trade
Loss rate (% of losing trades)
Average loss per trade
Once you’ve collected some data, you’ll begin to understand where you are and where you’re headed. Review your stats weekly, bi-weekly, or monthly depending on your trading style.
Statistics help you analyze your stop-loss efficiency (are they too tight or too wide, constantly getting hit by volatility?), and whether you're exiting too early (post-trade analysis is extremely valuable here — observe what the price does after you’ve exited the trade).
Focus on improving your stats.
As a rule of thumb, your win/loss ratio should be around 70/30 or better. Average profit vs. average loss varies by style, but aim for a 3:1 profit-to-loss ratio at minimum — for example, a 3% average profit vs. a 1% average loss. Ideally, you want 5:1. It’s absolutely achievable.
You can also analyze the extremes in your stats: your biggest winner, your worst loss — study them closely.
Trading is a tough business — but it is a business. There’s no magic here. It’s all about working on your stats and on yourself, just like in any other serious profession.
Wishing you success and continuous improvement in your trading performance.

USDJPY Structural Analysis : Breakout Demand Play + Target🗺️ Market Structure & Key Technical Zones
On the USDJPY 4-hour timeframe, the market is clearly respecting smart money levels and giving us an ideal case study of institutional demand, trend continuation, and liquidity engineering.
🔰 1. Major Support Zone (142.500 – 143.200):
This zone acted as a high-value area where price consolidated previously before rallying. It has been tested multiple times and each touch has led to a strong bullish reaction, indicating accumulation by large players.
Think of this zone as the market’s base camp — when price visits it, big money steps in to reload longs.
🔰 2. Channel Formation & Breakout:
A clean bullish channel formed mid-June, with price respecting both bounds while gradually climbing. Once the channel was broken with strong volume (noted by the breakout candle), it suggested a shift from controlled bullish flow to an impulsive move — a change in pace that often indicates smart money is active.
🧱 Institutional Concepts in Action
🔵 QFL (Quick Flip Level):
This area marks a prior consolidation or sideways action that gets aggressively broken. In this chart, price dipped to a QFL zone then sharply reversed — suggesting a trap for early shorts and a liquidity grab before moving up. A classic “manipulation → accumulation → expansion” sequence.
🟦 Breaker Demand (BR Demand):
This is where previous resistance has flipped into new support. Breaker blocks are extremely important in identifying where institutions may re-enter positions. Price respected this area before continuing higher — confirming bullish control.
Price tapped into this BR demand, showed low-wick rejections, and moved strongly, signaling confidence from large orders.
📊 Volume Burst Zone (~147.2–147.7):
This zone has historically seen high volume and sudden price acceleration. Price is re-approaching it now. This is where a lot of pending orders and take-profits are likely clustered — expect strong reactions here.
📈 Current Price Action
Price is climbing along a clean bullish trendline, reinforcing current momentum.
Price has broken previous structure highs and is now making higher highs and higher lows — a textbook bullish trend.
Buyers are in control as long as the price continues to respect:
The bullish trendline
The BR demand zone (~145.5)
🔮 Projection & Potential Scenarios
🟢 Bullish Continuation Case:
If current momentum holds, the price is likely to push toward the Next Reversal Zone (148.500–149.000).
This zone aligns with multiple confluences:
Fibonacci extension targets
Previous high liquidity trap zone
Potential institutional profit-taking level
Expect this zone to cause a reversal or deep pullback.
🔴 Bearish Breakdown Case:
If price breaks below the BR Demand Zone and closes under the trendline, expect a drop back toward the Central Zone (~144.8–145.0), or even deeper into the Major Support Zone.
This would shift market structure back to neutral or bearish depending on volume and rejection patterns.
📌 Summary:
✅ Bias: Bullish
🎯 Short-Term Target: 147.5 (volume burst area)
🧱 Key Support: 145.50 (breaker demand)
❗ Trendline Break = Red Flag
🏁 Final Reversal Zone: 148.500–149.000
💬 Final Thoughts
This chart is a brilliant example of smart money accumulation and market engineering. USDJPY continues to respect well-defined zones, presenting high-probability opportunities for traders who understand structure and patience.
This setup is NOT about chasing price — it's about following the footprints of volume, breakout structure, and institutional intent. Stick to the plan and manage risk around key invalidation zones.

GBP/NZD Vault Breach?! Ready for a Clean Bullish Heist?🔓💷 GBP/NZD — The Sterling Vault Heist Plan 🐱💻💰💹
🌟Hi! Hola! Ola! Bonjour! Hallo! Marhaba!🌟
To all the Money Makers, Market Magicians, and Chart Whisperers — it's time for another precision strike in the forex jungle! 🤑📊⚔️
🚨 Operation: GBP/NZD – Sterling vs Kiwi Bank Play 🚨
We're eyeing a bullish breakout based on solid thief-style technicals and stealthy fundamentals. The play: Long entry with high conviction — the vault is cracked open, now it's about how smooth the job gets executed! 🏦💸
🎯 Setup Breakdown:
🎯Entry Zone:
The loot is there for the taking! Ideal entries near recent 15min or 30min lows/swing points — look for a pullback entry to join the bullish breakout crew.
🟢 The market shows strength, momentum, and intention.
🛑Stop Loss (Thief Shield):
Placed tactically near the 2H swing low (around 2.23800).
⚖️ Adjust based on your lot sizing, trade volume, and risk appetite — the escape route is always planned.
💰Target Area (The Vault Door):
📌 Eyeing 2.28500 as the final vault exit — but feel free to grab your profits early if the heat rises. 🔥
Smart robbers know when to vanish.
🧠 Scalper's Note:
Ride only on the bullish side.
💼 Got big pockets? Enter now.
💡 Running light? Wait for the retest and team up with swing players for the score.
Use Trailing SL to guard your gold — protect what you steal!
📚 Market Intel:
This bullishness is no accident — backed by:
📰 Macros | 💹 COT Data | 📊 Sentiment | 🔎 Intermarket Analysis
The vault doesn’t open every day — this move is calculated.
⚠️Heads Up:
News volatility can trigger alarms 🚨
❌ Avoid fresh entries during major releases
✅ Use trailing SLs to manage live positions
Stay sharp. React fast. Think like a thief. 🧠
💥 If you vibe with the Thief Trading Style, smash that ❤️Boost Button❤️ and support the squad!
We move smart, strike clean, and profit consistently. This is Forex Heisting, redefined.
Stay tuned — the next master plan is loading... 🧨🔐💷📈

Breakout vs Fakeout: How to Spot the DifferenceHello, Traders! 🖖🏻
There’s probably no phrase that triggers more mixed emotions in crypto trading than: “Looks like we’re breaking out!”. Because let’s be honest…For every clean breakout that follows through with momentum…
…there’s a fakeout waiting to trap overconfident entries.
So, how do you tell the difference? Let’s break it down!
🧱 What Is a Breakout?
A breakout occurs when the price moves decisively beyond a key level, such as support, resistance, a trendline, or a range boundary, and holds.
What makes it a REAL breakout?
Volume Expansion: More participants step in as the price moves through the level.
Strong Candle Closes: Especially on higher timeframes like 4H or 1D.
Follow-Through: The market doesn’t just poke above the level. It builds on it.
No Immediate Rejection: You don’t see a sharp wick straight back below.
Example from BTC (2021):
Look back at January to February 2021. BTC had been stuck under the $42K–$43K resistance for weeks. Every push got sold off, until it didn’t.
When the breakout finally came, it was clean. The massive daily candle closed right through the level. Volume exploded. And there wasn’t even a polite little retest, price just launched straight toward $58K, leaving anyone waiting for a pullback completely behind.
Pure trend breakout energy. Everything lined up: the context, the volume, the structure — textbook 🤌🏻
🪤 What Is a Fakeout?
A fakeout, on the other hand, looks like a breakout… until it isn’t. The price briefly moves beyond a key level, but then snaps back inside the range, often trapping late buyers (or sellers) and triggering stop-losses.
Common Signs of a FAKEOUT:
Low or Declining Volume (at the breakout moment).
Quick Rejection with a Long Wick (especially on intraday charts).
Failure to Hold Above the Level on Retest.
Divergence Between Timeframes: For example, a 15M breakout that looks strong while the 4H still shows consolidation.
Classic BTC example:
This one was sneaky! After BTC hit its all-time high around $65K, the market started looking shaky. Price tried to recover by pushing back into the $58K–$60K zone, a pretty critical level at the time. It looked like a breakout attempt… but something was off. No real volume. No strong candle closes. And then, BOOM, hard rejection. The price popped just enough above resistance to lure in breakout traders (and probably clear out some stop-losses)… then completely reversed. And not just a minor pullback, this fakeout basically triggered the entire leg down toward $30K. Classic liquidity grab. The kind of move that looks like strength for a second… until it absolutely isn’t.
🕵️♂️ Key Differences: Breakout vs Fakeout (Checklist)
🧠 What Causes Fakeouts in Crypto?
Honestly, fakeouts aren’t some kind of accident. They’re almost baked into how crypto markets work.
Part of it comes down to simple liquidity hunting. The market knows exactly where traders tend to place their stop losses, right above resistance or just below support. Price often spikes into those zones, triggers stops, fills larger orders for bigger players… and then reverses completely.
Another reason? A lack of real conviction. Sometimes, it’s mostly retail traders chasing a move. Price pokes above a key level, but there just isn’t enough momentum to sustain it. Without bigger buyers or sellers stepping in, the move collapses right back.
And let’s be honest. When everyone on Crypto Twitter is watching the exact same level, fakeouts become almost inevitable. The more obvious the setup, the more likely it gets front-run, faded, or manipulated.
Plus, a huge mistake? People ignore the higher timeframe context. A breakout on the 15-minute chart might feel exciting… but if the 1D or 4H is still clearly in a downtrend, that breakout is fighting against the bigger picture. No surprise it fails. Fakeouts happen because the market’s job is to make most people wrong, at least for a moment.
🧭 Final Thought
Breakouts and fakeouts are part of the same game: they involve both liquidity and psychology. The market rewards patience, context, and waiting for confirmation. Sometimes, missing the first candle can save you from being a liability to someone else. So, next time an asset “breaks out,” take a second look. Is it really moving with force? Or is it just another trap waiting to be sprung?
What’s the last fakeout that caught you off guard? Drop your story in the comments. Let’s compare lessons learned!


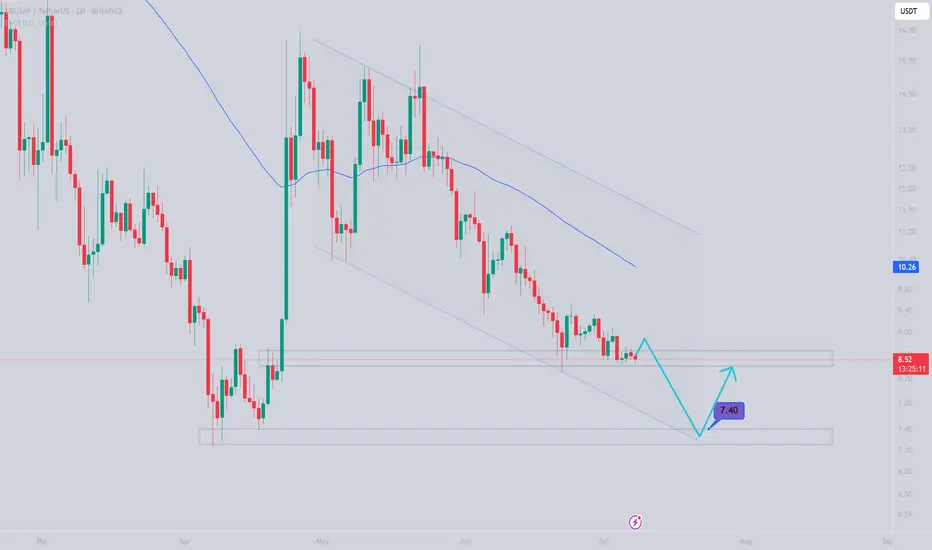
TRUMPUSDTGiven the deep correction and the expectation of a deeper correction and the lack of good demand from the breakeven range,
we expect further declines to the specified range.
With due risk management, it would be reasonable to enter around this area.
GOLD looks to be trying to make a bullish patternGold is trying to turn this downtrend around. Let's see if it can confirm the INV H&S pattern.

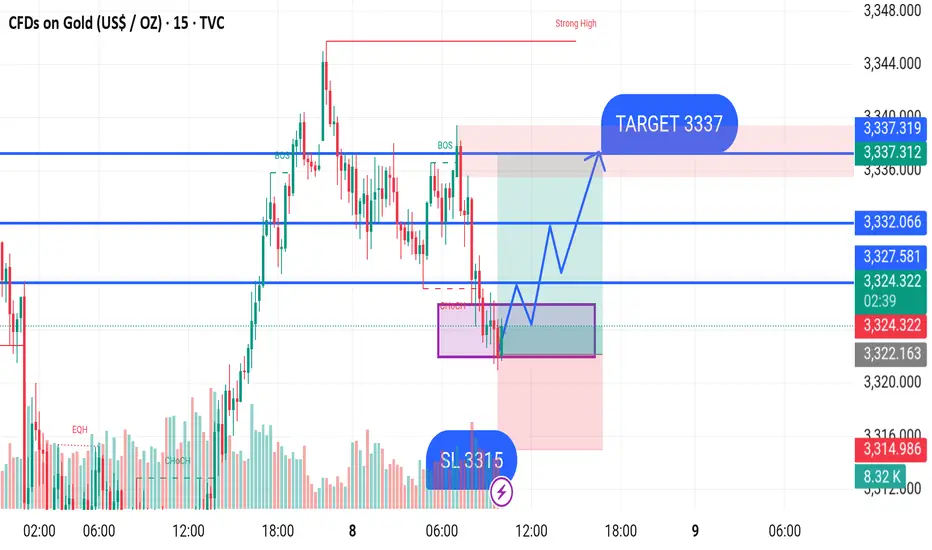
GOLD Gold (XAU/USD) 15-Min Chart Analysis – July 8, 2025
Price is currently trading around 3,323, inside a key demand/support zone (3,315–3,318) marked in purple. A Change of Character (CHoCH) suggests a potential shift in momentum from bearish to bullish.
Following a Break of Structure (BOS) to the downside, the market is expected to find support at this level, with buyers likely stepping in.
Trade Plan:
Buy Entry Zone: 3,318 – 3,320
Stop Loss (SL): 3,315 (below demand zone)
Take Profit (TP):
First Resistance: 3,327
Second Resistance: 3,332
Final Target: 3,337
If bullish momentum confirms, price is expected to rise through key resistance levels toward the final target at 3,337.
GOLD
Gbpusd short scalp I will consider a short only if pull back happens prior to target 1 being a traded to.
I like the downward monetum this morning.
4 losses 1 win for the simulated scalps. If this one is triggered it is the 6th scalp out of 100

NQ Trend & possible patternNQ looks like it's trying to make a few INV H&S Patterns. Wait for your conformations & remember the trend is your friend.

GOLD BUY ZONES Gold Buy Zone We Have
Bullish Engulfing Area ( 3317 - 3311 )
Order Block Area ( 3304 - 3295 )
Target We Are Expect Previous High Lets Gooo

Silver (XAGUSD) Structural Analysis : Curve break & TargetSilver is exhibiting a textbook bullish continuation pattern, guided by a parabolic curve structure that reflects intensifying buyer momentum. This unique setup provides a high-probability trading roadmap as we approach a major reversal zone—one where smart money may look to offload long positions or enter fresh shorts.
This analysis aims to help traders anticipate the likely path of XAGUSD based on structure, liquidity behavior, and trend psychology.
🔍 Key Structural Observations:
1. Black Mind Curve Support (Dynamic Bullish Structure)
This parabolic arc acts as dynamic support. Every bounce from the curve shows growing strength in buyer conviction.
The price is riding the curve upward with higher lows, signaling accumulation with momentum.
This is not a standard trendline but rather a curve reflecting the accelerated nature of this uptrend.
2. Aggressive Bullish Momentum
The recent price behavior has shown strong impulsive candles to the upside followed by shallow corrections, confirming bullish dominance.
Volume and candle size increase near the curve, suggesting institutional interest.
3. Reversal Zone: 37.20 – 37.45
Marked as the Next Reversal Zone, this green box represents a key supply area where previous swing highs exist.
Historically, price struggled to break this region cleanly, making it a high-probability reaction zone.
Expect either:
a bearish rejection (short-term correction), or
a consolidation before a breakout continuation.
4. Liquidity Pool & Needed Volume Zone (~35.20 – 35.50)
The market often revisits zones of untapped liquidity. This area likely holds:
Buy-side stop losses
Unfilled institutional orders
If the market needs a deeper retracement, this is the zone to watch for re-accumulation.
🧠 Market Psychology Behind This Setup:
This structure suggests a classic case of smart money accumulation, with price moving upward in a controlled yet aggressive fashion. The parabolic nature of the move points to:
Increasing retail buy-ins
FOMO-driven entries
Possible engineered sweep before the next impulse
The reversal zone could become a profit-taking area for institutions. If large players want to continue higher, they may first induce a pullback to absorb more volume at lower prices (near the curve or liquidity zone).
🔧 Tactical Playbook for Traders:
For Bulls (Long Bias):
Watch for pullbacks toward the curve or liquidity zone.
Enter long positions on bullish confirmation (e.g., engulfing candles, pin bars) off those zones.
Targets: 37.20 – 37.45, possibly higher if broken with strength.
For Bears (Countertrend Traders):
Wait for clear rejection patterns in the reversal zone.
Use confirmation like RSI divergence, momentum slowdown, or distribution volume.
Target: Curve support or deeper liquidity zone for reentry.
📌 Key Technical Levels:
Zone Price Range Description
Reversal Zone 37.20 – 37.45 Resistance / Take-Profit Area
Curve Support Dynamic (rising) Support based on parabolic arc
Liquidity Pool 35.20 – 35.50 High-volume demand zone
🧭 Conclusion
Silver is currently in a momentum-driven phase supported by smart money activity. The parabolic structure and clean liquidity map give traders a clear plan to engage both long and short setups with timing and precision. Patience around the reversal zone will be key, as the next major move may depend on how price behaves in this critical area.

Navigating the Complexities of Forex Swap RatesNavigating the Complexities of Forex Swap Rates
Forex swap rates, pivotal in currency trading, reflect the cost of holding a position overnight. This article unpacks swaps, offering clarity on their calculation and impact. Even seasoned traders may be confused with the complexity of swaps. It’s vital to learn about how these costs relate to effective strategy and fee management. Dive into the complexities of forex swaps and learn how they can influence decisions and overall performance in the ever-evolving trading world.
Understanding Forex Swap Rates
For traders, understanding forex market swap rates is crucial. A swap is essentially the interest differential paid or charged to a trader when they hold a position overnight. The concept hinges on the idea that when you trade currencies, you are effectively borrowing one currency to buy another. Hence, these rates come into play, reflecting the cost of the process.
The swap rate definition boils down to the interest rate difference between the two currencies involved in a trade. For instance, if you are going long in a pair like EUR/USD, the swap rate would be determined by the difference in interest rates set by the European Central Bank and the Federal Reserve. If the borrowing cost of the euro is lower than that of the dollar, holding the EUR/USD pair overnight would typically result in a charge. Conversely, if the euro has a higher borrowing cost, you might see your balance credited.
Calculating swaps involves a straightforward formula:
Swap rate = (Contract size × Interest differential) ÷ 365
This calculation takes into account the size of your position and the interest rate difference, providing a daily cost or gain for holding the position. Understanding these costs is vital when it comes to managing trading expenses and strategy in the forex market.
Key Elements Influencing Swap Rates
Several factors play pivotal roles in determining overnight swap rates in the forex market.
1. Interest Rate Differentials: The primary driver of overnight rates, interest differentials stem from the varying monetary policies of central banks. For example, if the Bank of England has a higher lending rate than the Federal Reserve, a buy trade in GBP/USD could mean earning for maintaining the position overnight.
2. Market Conditions: Economic stability, political events, and financial market volatility can significantly impact overnight charges. During periods of high volatility or geopolitical uncertainty, rates may fluctuate more dramatically, reflecting the increased market risk.
3. Liquidity: The level of liquidity in the market often influences overnight costs. In less liquid markets and less commonly traded pairs, higher swaps might be charged due to the increased cost of facilitating these trades.
4. Broker Policies: Different forex brokers might have varying policies and calculations for their own swaps. These differences usually arise from the brokers' own pricing structures, risk management strategies, and competitive positioning in the market. As such, traders should be aware that overnight charges vary from broker to broker.
Types of Forex Swaps
There are primarily two types of swaps that traders may encounter, each serving distinct purposes and offering unique implications for trading strategies.
1. Interest Swaps: These involve the exchange of interest payments between parties. In forex, it typically manifests as the fee a trader pays or receives for holding a position overnight. They directly impact the cost of maintaining open positions in different pairs.
2. Currency Swaps (Cross-Currency Swaps): Also known as a currency rate swap, this involves exchanging principal and interest payments in two different currencies. While less common in everyday retail forex activities, they are important in managing currency exposure and risk, particularly in hedging strategies. Currency swaps are used to secure a predetermined exchange rate for a specified currency amount while incorporating a benchmarked or fixed interest rate. This type is usually used by corporations or brokers.
Regarding fixed swap rates, they are less common in the forex market compared to the more prevalent floating swap rates. They’re often used in less volatile financial environments and typically find their application in long-term financial instruments or corporate finance rather than in the day-to-day trading of currencies.
Strategies for Managing Swap Rates
Management of swaps in forex involves several key strategies:
- Short-term Trading: By closing positions before the end of the trading day, traders can avoid incurring overnight fees altogether. It’s a so-called day trading since positions are typically closed by the end of the day.
- Hedging: Implementing hedging strategies may mitigate overnight fees. This involves opening opposite positions in correlated pairs, thus potentially balancing the amounts paid and received.
- Economic Calendar Awareness: Staying informed about major economic announcements and central bank decisions often helps traders anticipate changes in borrowing costs.
- Broker Selection: Choosing the right broker is critical. Selecting a broker with favourable rates might significantly reduce trading fees, especially for those holding long-term positions.
Practical Implications for Traders
Understanding and managing these charges has direct implications for traders' strategies and overall performance. Key considerations include:
- Carry Trading: A carry trade strategy entails borrowing in a currency with a lower interest rate and investing in another with a higher yield. Traders take advantage of the interest differential but must be mindful of potential fees.
- Rollover Costs: Traders holding positions overnight need to account for rollover costs, which can either erode or enhance returns, depending on the direction of the trade and the prevailing swap rates.
- Currency Exposure Management: Swap rates affect the overall cost of maintaining a position. Traders need to balance the potential advantages of holding a position against the charges incurred.
The Bottom Line
Mastering swap rates is a cornerstone of trade management. A thorough understanding may empower traders to navigate these costs and potentially improve their strategies. By carefully considering factors like interest differentials and broker policies, traders may manage their trades and overall performance more effectively.
This article represents the opinion of the Companies operating under the FXOpen brand only. It is not to be construed as an offer, solicitation, or recommendation with respect to products and services provided by the Companies operating under the FXOpen brand, nor is it to be considered financial advice.

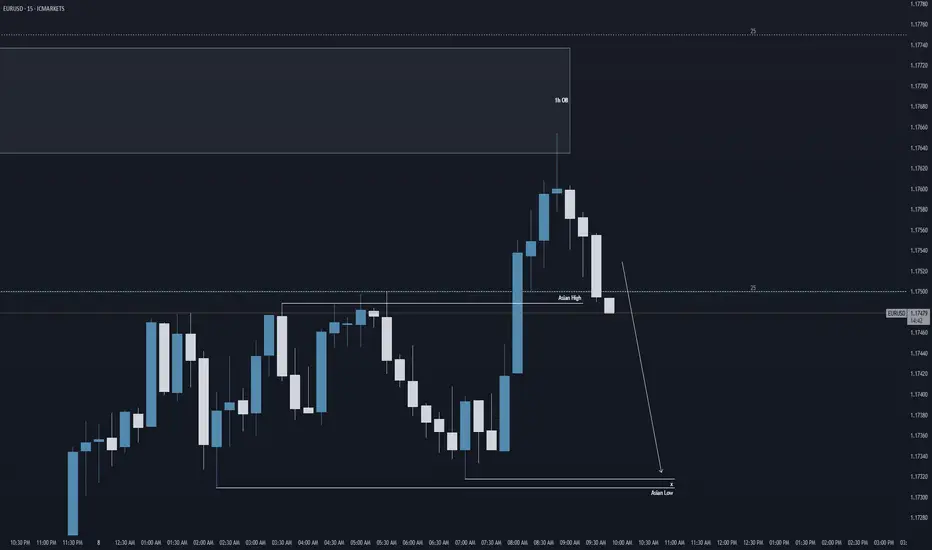
EU: Take out Asian Low Liquidity?Hi everyone,
Looking at EU at this potential pivot point of 1.175.
We've taken out the Asian highs, bouncing of a 1h order block. We could potentially have the opportunity of price creating a bearish leg towards the Asian lows.
Regards,
Aman
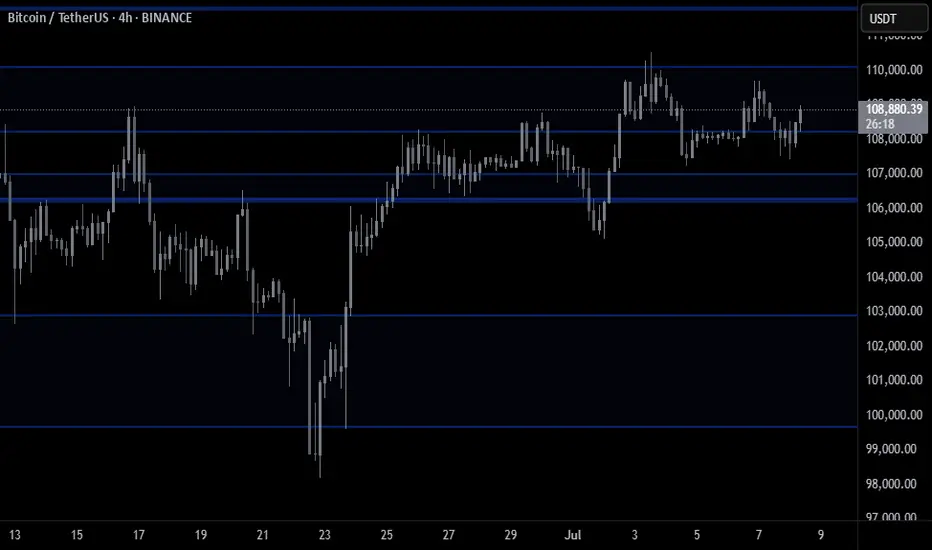
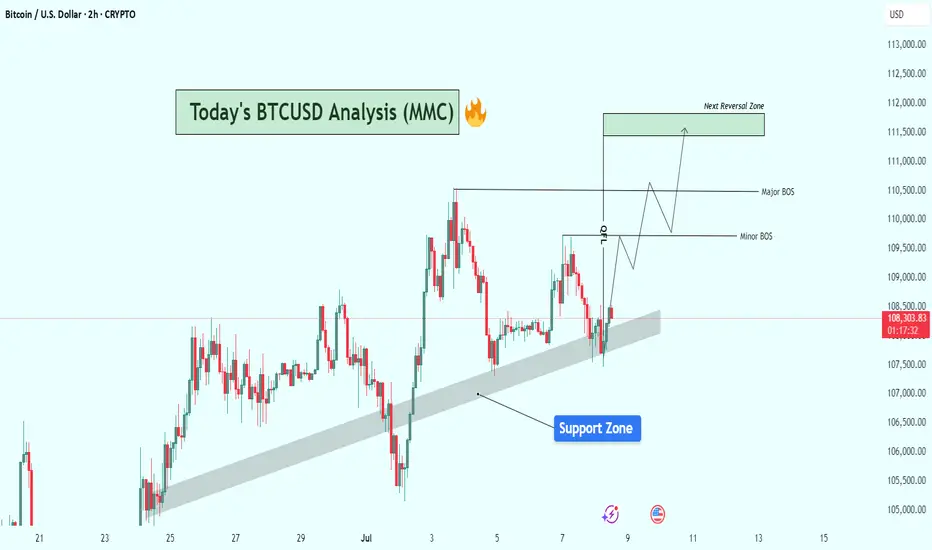
BTCUSD Structure Analysis : Bullish Zone From Support + Target🔍 Current Market Structure Overview:
Bitcoin is currently trading around $108,375, hovering just above a clearly respected rising support zone (shaded area). This dynamic support has held price multiple times and continues to act as a springboard for short-term bullish moves.
The chart illustrates a classic bullish continuation setup forming, with key structural levels marked as Minor BOS (Break of Structure) and Major BOS, indicating potential areas of trend validation and momentum acceleration.
🔹 Key Technical Elements:
✅ Support Zone:
The shaded diagonal support zone has acted as a bullish trendline base, holding up since late June.
BTC recently dipped into this area, found buyers, and is now attempting a reversal from this level.
This reinforces market interest and confirms the accumulation behavior in this zone.
⚠️ Break of Structure (BOS) Levels:
Minor BOS is marked near $109,800, signaling the first key intraday resistance.
A break above this level would signal bullish intent and open the way for price expansion.
Major BOS around $110,600–$110,800 is critical. A clean break here will likely validate a trend continuation toward the next objective.
🟩 Next Reversal Zone (Target Area):
Highlighted around $111,500–$112,000, this green zone represents a potential liquidity grab/reversal area where sellers could re-enter.
This zone aligns with previous price exhaustion levels and may trigger consolidation or a short-term pullback.
📈 Projected Price Path (Wave Schematic):
The chart outlines a wave structure projection, suggesting:
A possible retest of the minor BOS.
Follow-through into the major BOS area.
Final push into the reversal zone before potential rejection or sideways action.
🔧 Bias & Strategy:
Bias: Moderately Bullish as long as BTC respects the support zone.
Invalidation: A decisive breakdown below the trendline support and close under $107,500 would invalidate this bullish setup and shift bias to neutral/bearish short-term.
Trading Plan Ideas:
📥 Buy Opportunity: On minor dips within the support zone, targeting BOS levels.
📤 Sell Watch: Near reversal zone ($111.5K–$112K) if signs of exhaustion or bearish divergence appear.
📌 Final Notes:
BTC appears to be gearing up for a breakout from consolidation, and price action is coiling with higher lows. Market participants should watch closely how BTC reacts at the minor and major BOS zones, as they could define the next leg for either bullish continuation or rejection.
Copper Poised for GrowthCopper is in a strong uptrend.
Currently, it has pulled back to the 18 EMA level, which offers a potential long opportunity with an initial target at 5.25, and a further upside toward 5.60.
The era of metals continues.
Gold was the first to react — and I believe its rally is not over yet, with new all-time highs still ahead.
Now, it's industrial metals' turn: silver, platinum, palladium, and copper.
Platinum has already shown a strong move, and chasing longs here feels late — it's better to wait for stabilization and the next bullish setup.
Palladium, silver, and copper, on the other hand, still have plenty of room for explosive growth in the near term.
The stop-loss, based on volatility, is set at 4.96.
