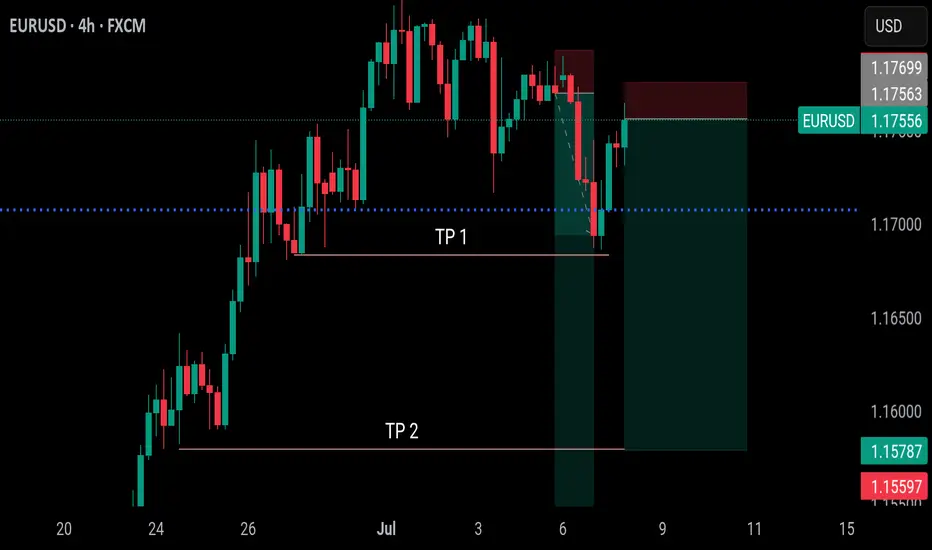
EURUSD BEARISH CONTINUATION, sell or LOOSE!!!In accordance with my idea of compounding, I'm adding to me EURUSD sell here. If you didn't enter the 1st time, you should enter now.
Yesterday gave us 100 pips, let's see how today will go
Follow me as my trades are market order, so you'll see the trades on time and enter on time
Enjoy
Beyond Technical Analysis
How to use Session Profiles for Day TradingHey whats up traders, in reveal cheat code for day trading by using session profiles. It's powerful concept. If correctly applied with HTF trend it will allows you to join running train path the right time.
Dont forget to follow me. I release such articles every Monday.
🧠 What Are Session Profiles?
A session profile describes the typical price structure and narrative during a market session — from open → high/low → close.
In Forex, we focus on:
• Asian Session
• London Session
• New York Session
Each session can act as either a reversal or continuation of the previous session(s).
📈 Why They Work
Markets are engineered to:
• Run stops (above highs or below lows)
• Fill inefficiencies (fair value gaps or imbalances)
CLS prefer to move price during specific times — the active hours around session opens. This is where liquidity is high and slippage is minimal, making it ideal for executing large orders.
So, session profiles help us map out when and where these manipulations are most likely to happen.
✅ Why You Should Use Them
Session profiles help you:
• Avoid low-probability trades in dead sessions
• Focus on high-probability narratives
• Anchor your execution models to context
But remember: they are not an entry model. You still need:
• A higher timeframe bias
• A mechanical entry model
• A system for risk and trade management
🔁 How to Use Session Profiles
Use the previous session(s) to anticipate the next one.
• For London session → analyze the Asian session
• For New York session → analyze Asian + London sessions
You’re looking for:
1. Manipulations into key levels
2. Displacement (price moves away strongly)
3. Change in order flow (e.g. OB,on M5 ,15 or H1)
4. Remaining liquidity targets (draw on liquidity)
📊 Session Profile Types with Chart Logic
1. 🔄 London Continuation Profile
Conditions:
• Asia session already made a manipulation into a key level
• Price displaced away from that level
• CIOD / OB on M15 or H1 before London open
Example:
• H1: Asia runs stops above H1 high into a fair value gap (key level)
• Displacement confirms intent
• At London open, price retraces into M15 premium (PD array) and continues in the same direction
Invalidation: the manipulation high/low from Asia session
Narrative: Asia did the manipulation → London does the continuation.
2. 🔁 London Reversal Profile
Conditions:
• Asia session consolidates near a higher timeframe key level
• London open initiates the manipulation into the key level
• Displacement + M15 BOS after manipulation
Example:
• H1: Asia consolidates under daily FVG
• London opens, price runs Asia high into that FVG
• M15 breaks down → clean short setup
• Target: higher timeframe draw on liquidity (e.g., previous day low)
Invalidation: the London session high (manipulation point)
Narrative: London performs the manipulation → price reverses.
3. 🔄 New York Continuation Profile
Conditions:
• Asia + London already created a clear manipulation and displacement
• London has not reached the final draw on liquidity
• London is not overextended (e.g., <70 pips move)
• New York opens with structure intact for continuation
Example:
• H1: London makes a reversal from a key level and displaces lower
• Draw on liquidity (e.g., previous day low) still untouched
• NY opens and continues the sell-off, retracing briefly into M15 imbalance before expanding lower
Invalidation: manipulation level from London
Narrative: London set the direction → NY finishes the move.
4. 🔁 New York Reversal Profile
Conditions:
• No clear London profile (no key level touched, no strong CHoCH)
• NY opens and manipulates into a key level (e.g., daily OB, FVG)
• Clear M15 or H1 CHoCH or BOS confirming reversal
• Asia + London lows still intact (liquidity available below)
Example:
• H1: No strong setup in London
• NY opens, price spikes into daily OB and takes out London highs
• M15 structure shifts → sell targeting London + Asia lows
Invalidation: NY session manipulation high
Narrative: London was noise → NY takes control and reverses.
🔁 Visual Structure Flow
Before applying any session profile, confirm:
1. High-probability trading conditions (e.g., key level proximity, market open, liquidity available, Red News)
2. Bias in place (HTF (D1 and Weekly direction must be known)
Then:
→ Check for valid session narrative
→ Select the correct session profile
→ Wait for the stop run of H1 / H4
→ Is there enough room for the move to key level
→ If we are still in first half of session you can enter. If its close the end of session skip it.
→ Apply your entry and risk model.
→ Dont be greedy look for 2:1 RR trade and get out.
🔁 How to enter ?
if bearish - You always want enter above H1 I H4 candle after LTF CIOD
If bullish - You always want to enter bellow H1/ H4 after LTF CIOD.
Use Order block to enter the market here is how to identify it correctly
Remember:
Never sell low / Never buy High... wait for stop run / Liquidity sweeps. If you dont know where is the liquidity - you will be liquidity.
Hope this brings clarity to your trading.
Done on the Tradenation Charts
Disclosure: I am part of Trade Nation's Influencer program and receive a monthly fee for using their TradingView charts in my analysis.
"Adapt what is useful, reject what is useless, and add what is specifically your own."
— David Perk aka Dave FX Hunter ⚔️

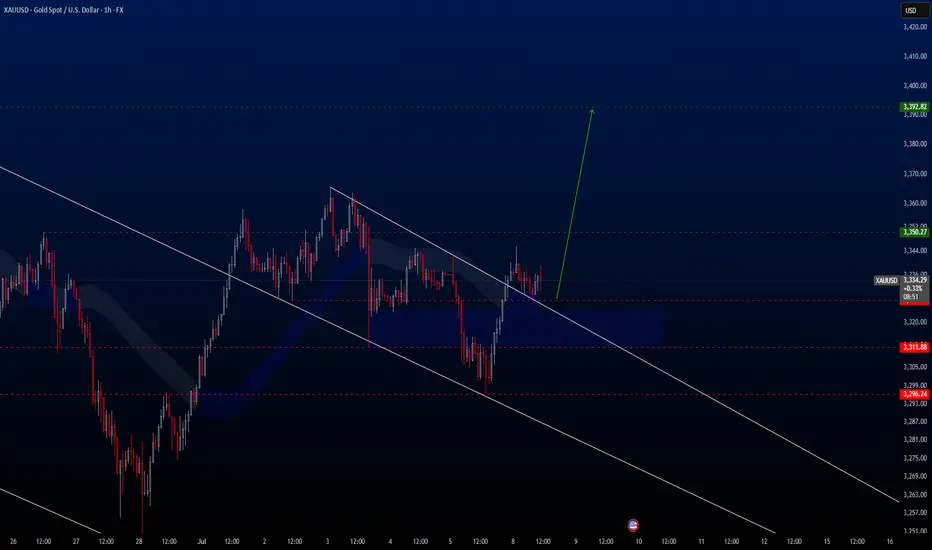
XAUUSD Hello traders,
Today we're taking advantage of a great buying opportunity on the XAUUSD pair. This setup is ideal for both medium- and long-term positions. I anticipate that the price will rise toward the 3392.82 USD level in the coming weeks.
That’s why I’ve positioned this trade as a medium-term opportunity.
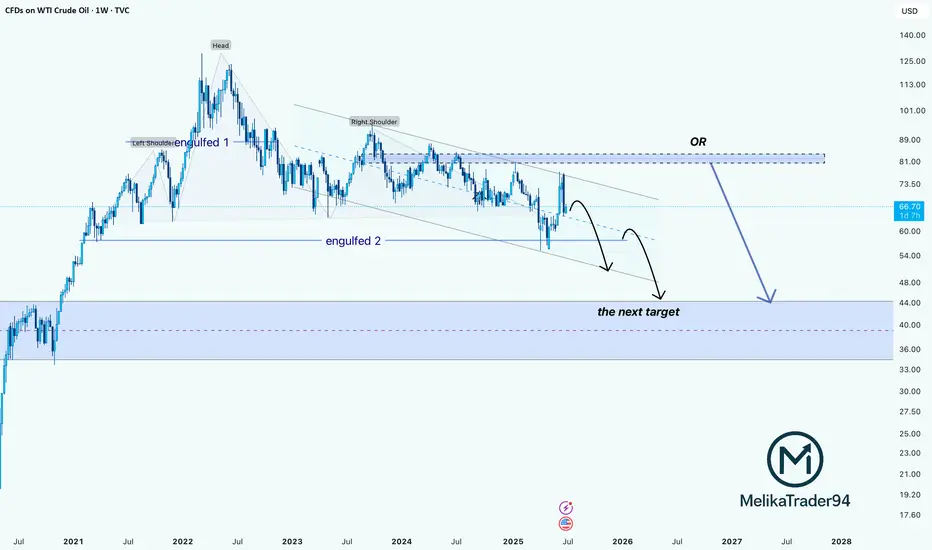
WTI Crude Oil: Double Engulf + H&S Breakdown Points to $40Hello guys! Let's dive into WTI!
The weekly chart of WTI Crude Oil reveals a bearish Head & Shoulders pattern playing out over a long-term descending channel. Price recently got rejected from the upper trendline, showing weakness despite a short-term bounce.
- Engulfed 1 & 2:
Two major engulfing zones failed to hold as support, turning into strong resistance.
- Bearish Scenario in Play:
After the recent upside move into resistance, price is likely to follow one of two paths:
- Continuation Within the Channel:
Rejection from the upper bound of the descending channel leads to a stair-step decline toward the $47–52 zone.
- Final Rejection from Supply Zone ($83–89):
A larger corrective push could test this area before a full collapse toward the long-term demand zone.
Main Target:
The blue shaded region ($36–47) stands out as a strong long-term demand zone, where buyers may finally step in.
____________________
Invalidation point:
Unless crude oil breaks above the $89 zone with strong volume, all signs point to further downside.
The chart structure favors a slow bleed with temporary bounces, ultimately targeting the $40s.
Ethereum Faces Key Resistance: Potential Pullback AheadHello Guys!
What I see:
Head and Shoulders Pattern:
Left Shoulder: Formed
Head: Peak, followed by a drop.
Right Shoulder: Formed.
The neckline break around $2,450 initiated a downside move, confirming the bearish setup.
Current Price Action:
ETH is currently trading near $2,519, attempting to reclaim the broken neckline zone, which now acts as resistance.
The price action is showing lower highs, hinting at weakening bullish momentum.
Bearish Retest in Progress:
The chart shows an anticipated bearish retest of the support-resistance flip zone ($2,530–$2,550), with a probable rejection leading ETH back down toward the $2,440–$2,450 support zone.
Demand Zone:
A strong demand area is visible between $2,420–$2,450. Price may revisit this zone before making the next major move.
Trend Channel:
ETH is moving within an ascending channel, and the lower bound coincides with the highlighted demand zone.
________________________
Let's check this deja vu:
You can see that previously the price formed an H&S and after that did a hunting of the head! And after that price experienced a drop there! Same scenario here!

Gold (XAU/USD) Structure Analysis : Trendline Break + TargetGold is trading around $3,338, positioned at a decisive point where both bullish momentum and bearish pressure are converging. The price action over the past few weeks suggests a brewing breakout, supported by multiple technical factors. This analysis provides a complete breakdown of what’s happening and what to anticipate next based on the current structure.
🔹 Market Structure & Context
Since mid-May, XAU/USD has been trading within a rising price channel, respecting a well-defined ascending trendline support. This rising support zone has provided a floor for buyers to step in, especially during pullbacks, which demonstrates consistent buying interest and underlying bullish sentiment.
At the same time, gold has also been respecting a descending trendline resistance formed by multiple lower highs. This forms a squeeze pattern, suggesting that the market is building energy for a breakout. As price compresses within this wedge-like structure, the tension between bulls and bears grows, setting the stage for a sharp directional move.
This is a classic accumulation vs. compression scenario, where the outcome of the breakout will dictate short-to-medium-term direction.
🔹 Channel Support Zone – Buyer’s Stronghold
The channel support zone is critical here. This area, visible as a bold upward sloping line, has provided reliable support through repeated market cycles. It acts as a dynamic line where institutions and swing traders accumulate long positions during dips. The fact that price has respected this trendline for over a month signals the importance of this structure in current market psychology.
Any break below this zone would invalidate the bullish bias and open the door for a steeper decline. However, as long as price stays above this line, the buyers retain control.
🔹 Trendline Resistance – Key Barrier to Break
The descending trendline resistance, drawn from mid-June highs, has been a significant cap on upward moves. Each test of this trendline has resulted in a rejection, pushing price back into the range. Now, gold is testing this level again — and this time, the setup is stronger for a potential breakout due to growing momentum and multiple rejections weakening the resistance.
From a technical standpoint, the more a resistance level is tested, the weaker it becomes, and the higher the probability of a breakout.
🔹 Break of Structure (BOS) Zones – Momentum Confirmation
The chart marks both Minor BOS and Major BOS zones. These are crucial areas to watch for price confirmation.
The Minor BOS, just above the current price (around $3,360), represents a short-term structural shift. A clean break above this with strong candles and volume could trigger a momentum rally.
The Major BOS, located in the $3,400–$3,420 area, is more significant. This is the last major swing high. If gold manages to break and hold above this zone, it would confirm a complete bullish reversal in market structure — turning what was once a lower-high pattern into a potential new uptrend.
These BOS levels act as validation checkpoints for trend direction. Without a clean break, the move is unconfirmed and prone to reversal.
🔹 Next Reversal Zone – Anticipated Reaction Area
Above the BOS zones lies the Next Reversal Zone, marked in green. This is a potential area of resistance or profit-taking, based on historical price reactions, Fibonacci confluence, and psychological levels. This area spans approximately $3,420 to $3,440, which is where price might pause, consolidate, or reverse depending on momentum.
This zone doesn’t necessarily mean price will reverse immediately, but it’s a smart area for traders to monitor reactions or start managing their risk.
🔹 Price Action Flow – What Could Happen Next?
Currently, gold is testing both the trendline and the minor BOS, building momentum around this critical zone. There are two primary paths forward:
If gold breaks the descending trendline and confirms above the minor BOS:
Expect a move toward the major BOS at $3,400.
A successful break of this zone opens the path to the next reversal zone ($3,420–$3,440).
Bulls gain clear control and the market may attempt a sustained breakout continuation.
If gold gets rejected again at the trendline:
Price could drop back toward the channel support, between $3,280 and $3,250.
This would maintain the current consolidation range, with further testing likely before a breakout.
Bears may gain temporary control, but only a break below the ascending channel would signal a trend shift to the downside.
🔹 Why This Setup Matters
This chart captures a textbook breakout setup — compression at a trendline, rising channel support, and BOS zones layered in. These kinds of technical setups often precede strong moves because:
Volume typically increases after breakout zones are breached.
Market participants are watching the same structure, making reactions more predictable.
Risk-to-reward becomes favorable with tight invalidation points.
For disciplined traders, this is a high-probability environment to wait for confirmation and trade the reaction, not the anticipation.
🔹 Risk Management Reminder
It’s essential not to chase breakouts prematurely. Look for:
Strong bullish candles breaking key resistance.
Retests of broken trendlines turning into support.
Volume confirmation (spikes can signal genuine breakout vs. fakeout).
Also, be prepared for false breakouts, especially during overlapping macroeconomic events or low liquidity sessions.
🧭 Final Thoughts
This is a powerful confluence zone for gold, and whichever side breaks it will likely control the next leg. Whether you're a day trader or a swing trader, this is a must-watch area on your chart.
Stay alert, trade with confirmation, and respect your risk parameters.

Floki Eyes Explosive 18% Rally Toward 0.00010 Resistance LevelHello✌
All previous targets were nailed ✅! Now, let’s dive into a full analysis of the upcoming price potential for Floki 🔍📈.
BINANCE:FLOKIUSDT has recently stabilized within a newly developed ascending channel following a series of sharp pullbacks. Price is currently hovering near a significant daily support zone, which may serve as a strong base for a potential bullish reaction. I’m watching for an upward move of around 18%, with a short-term target at 0.00010. 📊🚀
✨ Need a little love!
We pour love into every post your support keeps us inspired! 💛 Don’t be shy, we’d love to hear from you on comments. Big thanks , Mad Whale 🐋

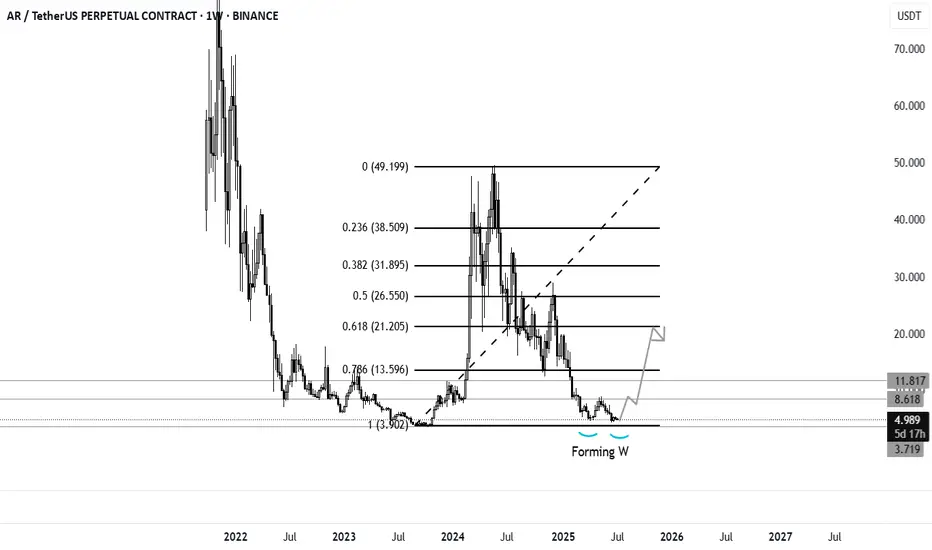
AR forming W. Good news for long term till OCTSimilar to my ARKM analysis both charts are very much similar. AR will be growing till OCT 2025.
Keep it simple and long term.
Toncoin Breakdown Ahead? Eyeing 12% Drop to $2.40 ZoneHello✌
All previous targets were nailed ✅! Now, let’s dive into a full analysis of the upcoming price potential for Toncoin 🔍📈.
OKX:TONUSDT is currently testing the upper boundary of its descending channel, where no meaningful volume breakout or accumulation can be observed. Without confirmation from volume or momentum indicators, this area appears to lack sufficient bullish strength. A corrective move remains likely, and I'm anticipating a potential pullback of around 12%, with the next support level and short-term target set near 2.40. 📉
✨ Need a little love!
We pour love into every post your support keeps us inspired! 💛 Don’t be shy, we’d love to hear from you on comments. Big thanks , Mad Whale 🐋

AUDNZD Looks Bullish – 1.0870 in SightI believe AUD/NZD is currently showing bullish signs and could continue to move higher. The price seems to be gaining strength, and I expect it to reach the 1.0870 level soon, which is about 50 pips above the current price. If the upward momentum continues, this target could be hit soon.

USDJPY h4 strongly downBearish Expectation Disruption / Bullish Counterpoint
Resistance (147.5) Rejection and drop Breakout and continuation toward 148.5+
Breakout FVG Fakeout and reversal True breakout — bullish trend continues
Bullish Zone (~144) Clean break below Accumulation zone, strong buying interest may emerge
Target (~143) Next leg down May not be reached if price stabilizes above 145
Support (~142.5) Final drop destination Could become irrelevant if trend flips decisively bullish Original Assumption: Market is behaving in isolation from fundamentals.
Disruption: If U.S. data (e.g., strong NFP, CPI, or Fed commentary) supports rate hikes, USD/JPY may remain bid and breakout to 148+ instead of reversing.
Watch For: Strong dollar narrative or dovish BOJ language.

ARKM forming double bottom. Good news for the ARKM long term holders is that ARKM is forming a double bottom where i am expecting it would grow more than 250% till OCT 2025. Its not so complicated when you keep things simple and for long term.

GBP/JPY Rising Within Ascending Channel – Target in SightGBP/JPY is currently moving within an ascending channel, where price action is forming higher highs and higher lows. This pattern indicates a steady uptrend.
At the moment, the pair is approaching the upper boundary (resistance line) of the channel. Based on the current momentum and structure, we expect the price to continue its upward movement and test the upper trendline.
This upper line serves as our near-term target, where we may look to take profit or reassess the trade setup. As long as the price remains within the channel and respects the trendline structure, the bullish bias remains intact.

Report - 8 jully, 2025Trump Grants Three-Week Tariff Reprieve
President Trump has extended the pause on sweeping reciprocal tariffs from July 9 to August 1, providing critical breathing room for US trading partners to negotiate. While this delay briefly steadied sentiment, his renewed threats — specifically a 25% tariff on Japan and South Korea — have reignited global trade fears.
S&P 500 fell 0.9% after the announcement, Nasdaq dropped 0.8%, and the Dow retreated similarly.
Japanese yen and Korean won weakened 1.1% against the USD, underscoring capital flight and potential export growth fears.
Analysts expect continued volatility, but ING suggests the fallout should not match April’s sharp correction when tariffs first roiled markets.
Ukraine Reshuffle: Diplomatic Realignment
Ukrainian President Zelenskyy agreed to replace Ambassador Markarova after criticism from Republicans about her close ties to Democrats. The reshuffle is framed as an effort to "appease" Trump amid paused US arms deliveries.
Zelenskyy also plans to restructure his cabinet next week, emphasizing consolidation of control by his chief of staff, Andriy Yermak.
Potential ambassador candidates include Prime Minister Shmyhal and senior ministers, signaling strategic alignment with US interests.
Russian Transport Minister’s Apparent Suicide
Russia's transport minister, Roman Starovoyt, was found dead in a suspected suicide after his dismissal by President Putin amid a corruption probe.
The case highlights severe internal pressures and the Kremlin’s tightening control.
The Kursk region scandal has drawn public criticism over failed defense construction during Ukraine’s advances.
Germany’s AfD Attempts Image Moderation
The far-right Alternative for Germany (AfD) party introduced a new code of conduct to improve its parliamentary image and broaden voter appeal.
With AfD declared a right-wing extremist group by domestic intelligence, any moderation effort reflects broader attempts to legitimize and normalize extremist platforms before 2029 elections.
China-EU Climate Standoff
The EU declined China’s push for a joint climate declaration ahead of Xi–von der Leyen meetings. Brussels demands firmer emission reduction commitments, reflecting tensions around trade and Russia policy.
The EU proposed a 90% emission reduction by 2040 but faces pushback internally amid fears of economic competitiveness loss.
China remains the world’s largest emitter, and the EU is wary of soft pledges lacking concrete policy changes.
LG Energy Solution Surges on Biden Tax Incentives
LGES posted a 152% YoY surge in Q2 operating profit (₩492bn), defying lower EV demand, largely due to advanced manufacturing tax credits from the US Inflation Reduction Act.
Despite falling sales (-9.7% YoY), early front-loading by automakers helped offset volume risks.
Trump’s new budget plan scraps consumer EV credits but retains production incentives to 2032, which supports battery manufacturers like LGES but may soften downstream demand.
Royal Gold’s $3.7bn Acquisitions Signal Gold M&A Wave
Royal Gold is acquiring Sandstorm Gold and Horizon Copper, expanding its portfolio to 80 producing assets and 266 exploration-stage properties.
Gold’s price strength has fueled an "animal spirits" surge in mining M&A.
Royal Gold’s market cap is projected to rise to ~$15.4bn, reinforcing its position as the only US-based large-cap pure gold streaming and royalty company.
Sibanye-Stillwater Calls for Western Price Support
CEO Neal Froneman advocated for price guarantees on critical minerals to offset Chinese competitive advantages.
He warned that de-globalization trends require Western miners to receive direct support to stay viable.
Sibanye’s expansion into lithium and nickel (Finland and France) reflects the shift to battery metals, but profitability is challenged by higher capital costs and lower platinum/palladium prices.
BP Strengthens Board with Ex-Shell CFO
Simon Henry joins BP’s board to bolster oil & gas expertise amid renewed investor pressure and possible takeover speculation.
BP recently pivoted back to traditional hydrocarbons after Elliott Management took a large stake and pushed for strategic shifts.
BP’s shares have lagged peers, making governance and board composition critical to fend off activist threats.
------------
US Equity Market Sector Trends
From your dashboards:
Utilities (+0.21%) and Staples (+0.07%) were the only positive sectors, highlighting defensive repositioning.
Tech (-0.73%), Discretionary (-1.27%), and Communications (-0.96%) led the declines, reflecting tariff fears and profit-taking in high-beta growth stocks.
Industrials (-0.52%) and Materials (-0.88%) were under pressure, signaling investor concerns over input costs and global demand.
Factors and Style Performance
Low volatility (+0.41%) and momentum (+0.41%) factors outperformed, indicating a flight to stability.
Small caps underperformed sharply (down ~1%), reflecting their greater sensitivity to domestic and policy risks.
Value and high dividend yield factors were slightly negative, reinforcing cautious sentiment.
Currency and Rates Moves
US dollar gained 0.2% against a basket of major currencies, driven by safe haven flows.
EUR/USD slipped 0.5%, and GBP/USD declined 0.3%.
USD/JPY climbed, reflecting yen weakness.
US 10-year Treasury yield rose to 4.39% (+0.05 pp), signaling investor rotation from bonds to cash amid tariff fears.
Global yields mostly edged higher; UK 10-year gilt rose to 4.59%.
Commodities
Gold slipped slightly (-0.1%), despite general risk-off sentiment, reflecting dollar strength and potential profit-taking after recent highs.
Crude oil gained ~1.7% (WTI at $67.97), supported by geopolitical tension and potential supply disruptions.
Industrial metals broadly fell, notably copper (-2.4%), due to China rerouting exports and tariff concerns.
Agricultural commodities showed mixed performance; soybeans and wheat fell (~-2.4%), reflecting improved harvest outlooks.
Global Equity Markets & Country ETFs
European equities showed resilience: DAX +1.2%, CAC 40 +0.4%.
Asia-Pacific mixed: Nikkei -0.8%, China slightly positive, reflecting capital reallocation and local policy adjustments.
Emerging markets underperformed slightly (MSCI EM down ~1.4%), as USD strength pressured flows.
Notably strong YTD performers include Brazil (+16%) and Mexico (+13%), while China and Japan remain subdued.
Fixed Income and Credit Conditions
US fixed income ETFs mostly red; long-duration Treasuries (20+ years) underperformed sharply (-1.0%), reflecting rate sensitivity.
High-yield spreads narrowed slightly, but issuance remains cautious given tariff-related macro risks.
Municipal bonds and short-term corporates showed slight positive performance, reflecting defensive rotation.
Macro Themes & Outlook
Trade Policy Risks Intensify: Extension to August 1 provides temporary relief but does not remove risk. Markets fear escalation with Japan, South Korea, and potentially the EU.
Rotation to Defensives: Investors shifted into utilities, staples, and low-volatility plays, anticipating higher volatility and lower global growth.
Dollar Strength & Rate Adjustments: Strength in USD and higher yields could challenge risk assets, especially in emerging markets.
Commodity Divergence: Energy remains firm on geopolitical concerns; metals weak amid China rerouting and uncertain demand.
Corporate Actions and M&A: Gold sector consolidations continue (e.g., Royal Gold’s $3.7bn acquisitions), indicating bullishness in precious metals, contrasting weakness in industrials and agriculture.
Conclusion & Strategy View
In the near term, we expect continued volatility around August 1 as the tariff deadline nears. Defensive positioning remains prudent, favoring cash, high-quality bonds, and low-volatility equities. For commodities, energy and precious metals are relatively better supported, while industrial metals and agriculture face demand and trade headwinds.
Currency-wise, the USD strength may persist, pressuring EM assets and riskier FX pairs.
We recommend closely monitoring further White House communications and bilateral trade talks, particularly involving Japan and South Korea, to reassess global risk exposure and sector allocations.
BTC-USDT Market Analysis for the Last 24 Hours
Hello, crypto enthusiast! 👋 Let’s see what has been happening with Bitcoin over the past 24 hours!
🔍 Price Action
Bitcoin dipped slightly during the day, sliding from ~108,970 USDT to a current price of about 108,166 USDT. That’s a decline of roughly 0.7 %—nothing too dramatic for the crypto market! 😉
📰 Hot News
• John Bollinger (renowned technical analyst) said that “Bitcoin is close to a breakout”; many analysts remain upbeat despite the small pullback.
• South Korea is seeing explosive crypto-market growth: total capitalization has topped $74.8 billion, and daily trading volume has reached $10.7 billion—higher than on the country’s two main stock exchanges!
• Fun fact: Korea’s well-known “kimchi premium” means crypto prices there can run about 10 % above global levels due to strong local demand. 🌶️
📊 Technical View
During the last 24 hours BTC traded between $107,393 and $109,048. Volumes were especially heavy from 21:00 to 22:00 on 7 July, when more than 100 million USDT changed hands.

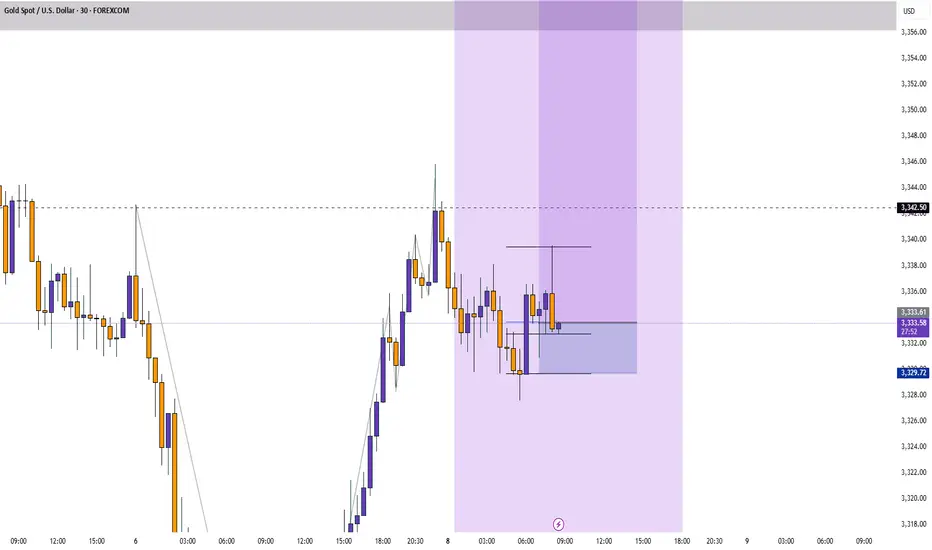
Gold bullish setup "Gold Buy Setup: Price is bouncing off key support at ,3333/3335 with a potential bullish reversal in play. Buying opportunity on the horizon
Gold buy level 3333/35
First target 🎯. 3338
Second target🎯 3342
Third target 🎯 3347
Guys leave comment what you think about this setup

BTCUSD: Whales Move 80,000 BTC, Shaking the MarketBTCUSD on Alert: Whales Move 80,000 BTC, Shaking the Market
By Ion Jauregui – Analyst at ActivTrades
The cryptocurrency market witnessed one of the year’s most puzzling moves this week. Over 80,000 Bitcoins—worth more than $8.6 billion—were transferred from wallets that had been inactive since the early years of the crypto ecosystem. These transfers, originating from addresses linked to 2010 and 2011, sparked a wave of reactions among investors, analysts, and crypto enthusiasts.
Fundamental Analysis: Mass Sell-Off or Simple Restructuring?
The market's initial response was uncertainty. It’s unusual for wallets from the so-called “Satoshi era” to become active again. However, research led by Arkham Intelligence and other on-chain analysis firms indicates that this was not an immediate sale. The BTC was not sent to exchanges, but to new addresses—possibly with enhanced security (SegWit or multisig technologies)—suggesting an internal reorganization rather than a liquidation.
On a macro level, the environment remains favorable for Bitcoin:
– Institutional inflows via ETFs have already surpassed $14 billion in 2025.
– Broader adoption is expected, driven by proposals such as the creation of a strategic Bitcoin reserve in the U.S. and clearer regulations in advanced economies.
– The market has shown resilience in the face of similar events in the past, reducing the risk of a structural correction.
Technical Analysis: Consolidation Zone with Key Resistance at $112,000
From a technical perspective, Bitcoin has maintained a strong bullish structure in recent weeks but is currently in a consolidation phase near its all-time highs:
• Key support: $103,477, located mid-range of the current consolidation zone. The lower bound sits at $98,209, where the price has reacted positively following the whale movements. The delta pressure zone is positioned at the upper part of the range, near current price levels.
• Immediate resistance: $111,978.21, a breakout of which could open the door to a move toward $112,000–$115,000.
• Daily RSI: Neutral bias with slight overbought conditions at 54.11%.
• Moving averages: The 50- and 100-day EMAs show clear compression—typically a precursor to a breakout—while the 200-day EMA remains well expanded, appearing to support the current consolidation.
Volume remains elevated but without speculative spikes, and funding rates in the derivatives market are still positive, suggesting sustained buying interest.
Conclusion: A Symbolic Shake-Up Rather Than a Threat
Although the whale movements have made headlines and stirred speculation about a possible sell-off, the signs point to a technical update rather than a shift in trend. The market has remained stable over the past 48 hours, with technical indicators and macro fundamentals supporting a short-term neutral-to-bullish outlook.
The key will be whether these funds remain dormant or begin to disperse in smaller transactions. For now, the crypto ecosystem has weathered the shake-up without major consequences, reinforcing the growing maturity of an increasingly institutional market.
*******************************************************************************************
The information provided does not constitute investment research. The material has not been prepared in accordance with the legal requirements designed to promote the independence of investment research and such should be considered a marketing communication.
All information has been prepared by ActivTrades ("AT"). The information does not contain a record of AT's prices, or an offer of or solicitation for a transaction in any financial instrument. No representation or warranty is given as to the accuracy or completeness of this information.
Any material provided does not have regard to the specific investment objective and financial situation of any person who may receive it. Past performance is not reliable indicator of future performance. AT provides an execution-only service. Consequently, any person acting on the information provided does so at their own risk. Political risk is unpredictable. Central bank actions can vary. Platform tools do not guarantee success. Regulated status does not guarantee security.

Trade idea - Powell concept
Bearish Bias coming into the day, had a low close Previous day. PXL & PXH indicates price will go lower.
IF we take out the EQH and tap the rejection block, i would not be mad to take a short there. Targeting NDOG, not mad if it gonna be a lose either :)

AUDUSDHello Traders! 👋
What are your thoughts on AUDUSD?
The AUDUSD pair reached a resistance zone, which was accompanied by a negative divergence, signaling weakening bullish momentum. This led to a bearish reaction from that area.
We expect that, after some consolidation around this resistance, the pair will likely continue its decline at least toward the specified support level.
Don’t forget to like and share your thoughts in the comments! ❤️

Continuation of DXY bullish narrative, who says NO?Like I said in my last published post, dxy is bullish for now till we see otherwise. The first TP has been reached, more than 100 pips bagged, the trade is still on but I'm looking at a possiblity of compounding here. I told you guys, this trade will make you a huge amount of money if you're willing to ride it with me.
This means bearish EURUSD AND GBPUSD et al. Trade accordingly. We may have a final sweep of 97.260 area. You can wait for that sweep before entering. I'm not, I won't be on chart then but the stop will hold. Few pips won't change the trade idea will it?
Follow me as my trades are usually market order, so you'll see them on time and enter on time.
Enjoy

US dollar, Trump has done it!Since the start of 2025, the US dollar has established itself as the weakest major currency on the Forex market, falling by over 11% against a basket of major currencies. If we extend the reference period to include Donald Trump's return to the presidency, the slide even reaches 12%. This spectacular decline is no accident, but the fruit of a strategy deliberately implemented by the Trump administration. The stated aim is clear: to restore the commercial competitiveness of American companies, boost exports and restore the price advantage of products made in the USA. In this respect, the fall of the US dollar on the FX has fulfilled its mission. Can we now envisage a low point for the US dollar on the FX?
1) US dollar: the battle for currency competitiveness has been won for US companies, and this should have a positive impact on the second-quarter results of S&P 500 companies published this July
Indeed, the fall in the dollar translates directly into a much more favorable environment for exporting groups, particularly those which generate the bulk of their sales in Europe or Asia. The conversion of foreign currencies into dollars mechanically boosts revenues and margins. For many multinationals, this factor is likely to contribute to strong earnings releases in the second quarter, as the reporting period takes place this summer. Beyond the immediate impact on corporate accounts, the greenback's depreciation is also encouraging a more structural trend towards reindustrialization and support for domestic production. The effects of this dynamic can already be seen in certain manufacturing segments, which are regaining international market share. Nevertheless, this scenario is not without its downsides: a weak dollar makes imports more expensive, especially raw materials, and weighs on companies dependent on foreign inputs. On the whole, however, the exchange rate policy implemented since January represents a successful gamble by Donald Trump to boost American competitiveness.
2) Technical analysis: can we anticipate a low point for the US dollar?
The crucial question today is whether the US dollar can pull back further, or whether a technical and fundamental bottom is emerging. From a technical analysis point of view, the DXY index, which measures the value of the dollar against a basket of currencies weighted 57% by the euro and 13% by the yen, remains anchored in a bearish trend. Some of the theoretical targets evoked by Elliottist analysis have been reached, but not all. However, long-term supports are visible on monthly charts: an uptrend line, particularly visible on the arithmetic scale, could act as a short-term stabilizer. Note that a potential bullish divergence is also possible on the weekly timeframe. But a bullish reversal pattern is still lacking to speak of a major low point, so let's not put the cart before the horse.
3) Scenarios and stakes for the rest of the year for the US dollar on FX
Beyond technical considerations, the persistent weakness of the US dollar acts as a revealing indicator of the tensions between trade policy and financial stability. On the one hand, a dollar under pressure is a powerful lever for supporting exports and consolidating US growth in an uncertain global context. On the other, a prolonged fall in the greenback fuels concerns about international confidence in dollar-denominated assets, and makes imports more expensive, which could rekindle inflationary pressures. This dilemma lies at the heart of the forthcoming trade-offs between the White House and the Federal Reserve.
For investors and companies exposed to Forex, several scenarios are conceivable. If the U.S. political agenda leads to a trade compromise, and if second-quarter publications confirm the robustness of the U.S. economy, the dollar is likely to find a technical floor around the supports identified on the DXY. In this scenario, a stabilization phase, or even a moderate rebound, could set in during the second half of the year. Conversely, if the trade stimulus policy is accompanied by a hardening of relations with Europe and China, or if the Fed is slow to react, the downward momentum could be prolonged.
DISCLAIMER:
This content is intended for individuals who are familiar with financial markets and instruments and is for information purposes only. The presented idea (including market commentary, market data and observations) is not a work product of any research department of Swissquote or its affiliates. This material is intended to highlight market action and does not constitute investment, legal or tax advice. If you are a retail investor or lack experience in trading complex financial products, it is advisable to seek professional advice from licensed advisor before making any financial decisions.
This content is not intended to manipulate the market or encourage any specific financial behavior.
Swissquote makes no representation or warranty as to the quality, completeness, accuracy, comprehensiveness or non-infringement of such content. The views expressed are those of the consultant and are provided for educational purposes only. Any information provided relating to a product or market should not be construed as recommending an investment strategy or transaction. Past performance is not a guarantee of future results.
Swissquote and its employees and representatives shall in no event be held liable for any damages or losses arising directly or indirectly from decisions made on the basis of this content.
The use of any third-party brands or trademarks is for information only and does not imply endorsement by Swissquote, or that the trademark owner has authorised Swissquote to promote its products or services.
Swissquote is the marketing brand for the activities of Swissquote Bank Ltd (Switzerland) regulated by FINMA, Swissquote Capital Markets Limited regulated by CySEC (Cyprus), Swissquote Bank Europe SA (Luxembourg) regulated by the CSSF, Swissquote Ltd (UK) regulated by the FCA, Swissquote Financial Services (Malta) Ltd regulated by the Malta Financial Services Authority, Swissquote MEA Ltd. (UAE) regulated by the Dubai Financial Services Authority, Swissquote Pte Ltd (Singapore) regulated by the Monetary Authority of Singapore, Swissquote Asia Limited (Hong Kong) licensed by the Hong Kong Securities and Futures Commission (SFC) and Swissquote South Africa (Pty) Ltd supervised by the FSCA.
Products and services of Swissquote are only intended for those permitted to receive them under local law.
All investments carry a degree of risk. The risk of loss in trading or holding financial instruments can be substantial. The value of financial instruments, including but not limited to stocks, bonds, cryptocurrencies, and other assets, can fluctuate both upwards and downwards. There is a significant risk of financial loss when buying, selling, holding, staking, or investing in these instruments. SQBE makes no recommendations regarding any specific investment, transaction, or the use of any particular investment strategy.
CFDs are complex instruments and come with a high risk of losing money rapidly due to leverage. The vast majority of retail client accounts suffer capital losses when trading in CFDs. You should consider whether you understand how CFDs work and whether you can afford to take the high risk of losing your money.
Digital Assets are unregulated in most countries and consumer protection rules may not apply. As highly volatile speculative investments, Digital Assets are not suitable for investors without a high-risk tolerance. Make sure you understand each Digital Asset before you trade.
Cryptocurrencies are not considered legal tender in some jurisdictions and are subject to regulatory uncertainties.
The use of Internet-based systems can involve high risks, including, but not limited to, fraud, cyber-attacks, network and communication failures, as well as identity theft and phishing attacks related to crypto-assets.

Downtrend Resumes – Watch This Supply Zone ReactionHello Traders,
Today on EUR/USD, we could see a deeper pullback into the supply zone. From there, we may look for potential short setups targeting the daily bullish continuation demand zone.
Based on multi-time-frame analysis, both the 4-hour and daily charts are aligned with a bearish expectation in the short term.
Let me know your thoughts on this trade idea!
