GBP/AUD Trade Setup – Short Bias📉 GBP/AUD Trade Setup – Short Bias
🕒 Timeframe: 1H
📍 Entry Zone: 2.09300–2.09400
🎯 Target Zone: 2.08400
🔍 Analysis:
Price is rejecting a key supply zone after a strong impulsive move. I'm anticipating a return to the previous demand area around 2.08400.
📌 Arrows indicate possible retracement entries within the supply zone for optimal short execution. Watch for bearish confirmation on LTF.
📲
#GBP #FXTrade #GBPUSD #SupplyAndDemand #PriceAction #ForexSignals #SellSetup
Beyond Technical Analysis

Gold Continues Slight Pullback📊 Market Overview:
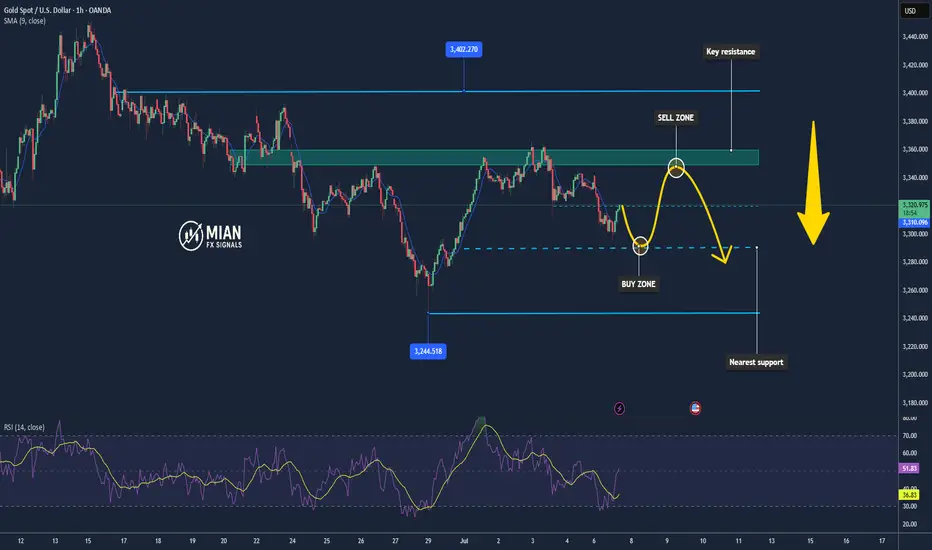
• Gold prices dropped ~0.7% to around $3,319/oz as optimism over the US trade negotiations and a tariff delay (from July 9 to August 1) reduced safe-haven demand.
• The US dollar strengthened slightly on upbeat economic data and expectations that the Fed will not cut interest rates in July, adding pressure on gold prices.
📉 Technical Analysis:
• Key resistance: $3,348 – $3,360 – $3,400
• Nearest support: $3,318 – $3,290
• EMA09: Gold is trading below the EMA50, indicating a short- to mid-term bearish bias.
• Candle/volume/momentum: On the 1H and 15-min charts, the price structure shows a clear bearish expansion – trading below pivot levels with a "bearish opening" setup, suggesting strong selling momentum.
📌 Outlook:
Gold may continue to move slightly lower in the short term if positive trade headlines and USD strength persist. However, if there’s unexpected negative news—like geopolitical tensions or a Fed policy pivot—gold could quickly rebound.
💡 Suggested Trading Strategy:
SELL XAU/USD at: 3,348 – 3,350
🎯 TP: ~40/80/200 pips
❌ SL: ~3,355
BUY XAU/USD at: 3,290 – 3,295
🎯 TP: ~40/80/200 pips
❌ SL: ~3,285
#TITAN Equilibrium ( DEMAND AND SUPPLY ZONE)Entry Rules:
Demand Zone Buy:
Wait for price to return to a demand zone.
Look for bullish reversal candlestick patterns (e.g., hammer, engulfing).
Enter long with a stop-loss below the zone.
Supply Zone Sell:
Wait for price to return to a supply zone.
Look for bearish reversal candlestick patterns (e.g., shooting star, bearish engulfing).
Enter short with a stop-loss above the zone.
Exit Rules:
Take profit at the next key supply/demand zone or using a risk-reward ratio (1:2 or 1:3).
Trail stop-loss if price moves favorably.


maintain bullish, break H1 trend⭐️GOLDEN INFORMATION:
Gold prices (XAU/USD) trade in the red near $3,330 during Tuesday’s Asian session, weighed down by a stronger US Dollar (USD). The precious metal loses ground amid easing trade tensions, following US President Donald Trump’s announcement of a tariff deadline extension and his openness to further negotiations.
Market anxiety subsided after Trump signaled flexibility around the August 1 tariff deadline, describing it as “not 100% firm” and suggesting room for continued adjustments. This renewed optimism over trade policy has strengthened the Greenback, thereby pressuring USD-denominated assets like Gold, which becomes more expensive for holders of other currencies.
⭐️Personal comments NOVA:
Gold price accumulates waiting for news of new tariff information, breaking H1 trend. Good buying power
⭐️SET UP GOLD PRICE:
🔥SELL GOLD zone: 3364- 3366 SL 3371
TP1: $3350
TP2: $3340
TP3: $3330
🔥BUY GOLD zone: $3300-$3298 SL $3293
TP1: $3310
TP2: $3325
TP3: $3340
⭐️Technical analysis:
Based on technical indicators EMA 34, EMA89 and support resistance areas to set up a reasonable BUY order.
⭐️NOTE:
Note: Nova wishes traders to manage their capital well
- take the number of lots that match your capital
- Takeprofit equal to 4-6% of capital account
- Stoplose equal to 2-3% of capital account


UNH How Far Down Are We Going $32 ? Based on the current class action lawsuit sentiment is negative and if it continues we can see levels of 258 being hit again. However if we break that level down then 163-150 level can possibly get hit followed by the 32-49 dollar range.
However despite all the negative news which does affect the market, if for whatever reasons we can break the high of 326 be prepared for a run up to 535 low probability but it is possible.
Trade Smarter Live Better
Kris/ Mindbloome Exchange

Market ViewWatch
Trade
Manage
Smile
Good morning, service to all of God creature take another level in life of purpose., we all got our role. Make the decision today.

What I See on SOLUSD Crypto Hi, I'm making this simple, so SOL coin had a crazy run in 2024 now it's in a dip faze and ranging era so therefore I'm buying low and dips area don't make profits complicated
not a Financial Advisor so please take at your own risk

XAUUSD - Liquidity Sweep & Smart Money Play | Dual Setup BreakdoFOREXCOM:XAUUSD
Liquidity Sweeps
Smart Money Concepts (SMC)
Trendline Liquidity
Demand/Order Blocks
Risk-Reward Structure
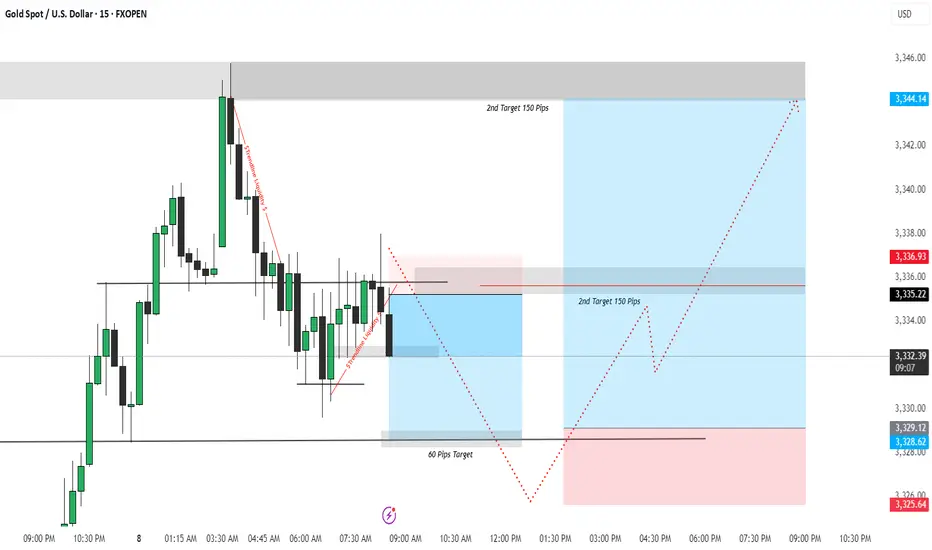
🔻 First Trade Idea – Short Position (Sell Setup)
🧠 Psychology & Liquidity Insight:
The market formed equal lows before a sudden rally which attracted retail traders.
Price created a bearish structure with lower highs, signaling weakness.
A strong liquidity sweep occurred by breaking trendline liquidity twice (as shown by red lines), targeting early buyers' stop losses.
A supply zone (red box) was respected near 3337, providing an ideal entry point for shorting.
📉 Trade Logic:
Entry: Near 3336.93 (Supply Zone)
SL: Above 3344.14 (Liquidity Sweep zone)
TP: 3328.62 / 3325.64 (Targeting demand imbalance & internal liquidity)
R:R: Approx. 1:2+
🔺 Second Trade Idea – Long Position (Buy Setup)
🧠 Psychology & Liquidity Insight:
After the initial selloff, price taps into the demand zone (blue box) created by the last impulsive move.
Internal liquidity is built again near 3328–3330, where retail traders expect a continued fall — ideal for smart money to reverse.
Price is expected to accumulate and reverse with a strong rally toward the upper liquidity resting above 3344.
📈 Trade Logic:
Entry: Near 3328.62 (Demand Zone Tap)
SL: Below 3325.64
TP: 3344.14 (Major Liquidity Target)
R:R: Over 1:3 – a high-quality reversal play.
🎯 Why This Trade Setup is Powerful:
✅ Both trades are liquidity-driven, not just indicator-based.
✅ Incorporates smart money logic and price structure.
✅ Clear risk-to-reward, validated by price behavior and institutional order flow.
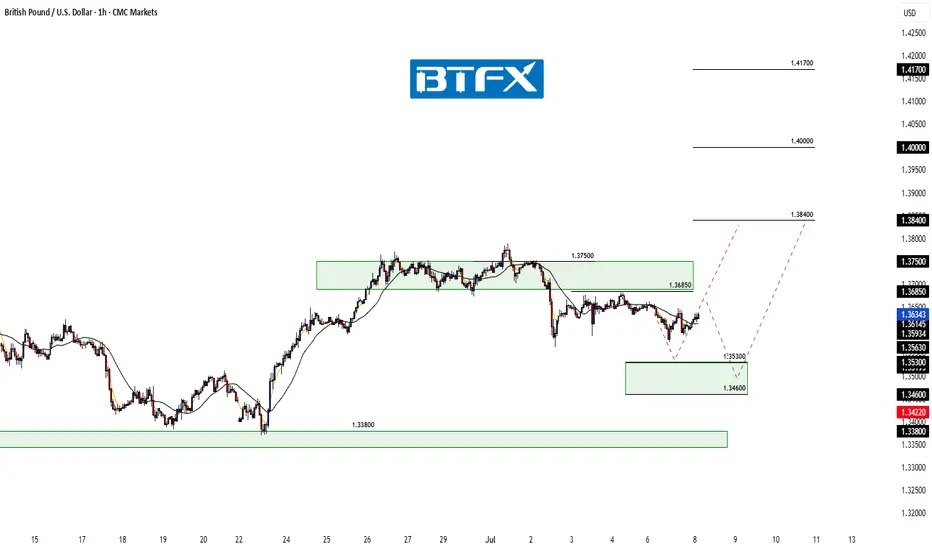
GBP/USD: Short‑Term Pullback Likely Before Fresh Upside AttemptHi everyone,
GBP/USD continues to consolidate below the 1.36850 level. We expect a retest of this level today; should price fail to break above, we anticipate a move lower to find buying interest between the 1.35300 and 1.34600 zones. A drop into this area appears to be the more probable short‑term path and could set the stage for another push higher.
As previously noted, a decisive break above 1.37500 would renew our expectation for further upside, with the next key target around 1.38400. We'll be monitoring price action closely to see how it unfolds.
We’ll continue to provide updates on the projected path for GBP/USD as price approaches this target.
The longer-term outlook remains bullish, and we expect the rally to continue extending further from the 1.20991 January low towards 1.40000 and 1.417000.
We’ll be keeping you updated throughout the week with how we’re managing our active ideas. Thanks again for all the likes/boosts, comments and follows — we appreciate the support!
All the best for the week ahead. Trade safe.
BluetonaFX
AMAZON STRONG UPTREND|LONG|
✅AMAZON is going up
Now and the stock made a bullish
Breakout of the key horizontal
Level of 220$ and the breakout
Is confirmed so we are bullish
Biased and we will be expecting
A further bullish move up
LONG🚀
✅Like and subscribe to never miss a new idea!✅
Disclosure: I am part of Trade Nation's Influencer program and receive a monthly fee for using their TradingView charts in my analysis.

GBPUSD COT and Liquidity AnalysisHey what up traders welcome to the COT data and Liquidity report. It's always good to go with those who move the market here is what I see in their cards. I share my COT - order flow views every weekend.
🎯 Non Commercials has been taking profits on during last 3 weeks. There for I think we need deeper pullback to reload the longs.
📍Please be aware that institutions report data to the SEC on Tuesdays and data are reported on Fridays - so again we as retail traders have disadvantage, but there is possibility to read between the lines. Remember in the report is what they want you to see, that's why mostly price reverse on Wednesday after the report so their cards are hidden as long as possible. However if the trend is running you can read it and use for your advantage.
💊 Tip
if the level has confluence with the high volume on COT it can be strong support / Resistance.
👍 Hit like if you find this analysis helpful, and don't hesitate to comment with your opinions, charts or any questions.
Analysis done on the Tradenation Charts
Disclosure: I am part of Trade Nation's Influencer program and receive a monthly fee for using their TradingView charts in my analysis.
"Adapt what is useful, reject what is useless, and add what is specifically your own."
— David Perk aka Dave FX Hunter ⚔️

EUR/USD Update: Breakout Potential Above Recent HighsHi Everyone,
Monday played out as expected; a bounce off the highlighted support area appears to have provided enough momentum for a retest of the 1.18000 level. Price could briefly dip below the 1.16680 support; however, our outlook will remain unchanged as long as we hold above the 1.16450 level.
We maintain the view that a decisive break above last week’s high could attract additional buyers, paving the way for a move towards the 1.19290 level and ultimately the 1.20000 level.
We’ll share further updates on the projected path for EUR/USD if price breaks above this key resistance.
The longer-term outlook remains bullish, with expectations for the rally to extend towards the 1.2000 level, provided the price holds above the key support at 1.10649.
We will continue to update you throughout the week with how we’re managing our active ideas and positions. Thanks again for all the likes/boosts, comments and follows — we appreciate the support!
All the best for a good end to the week. Trade safe.
BluetonaFX

EURUSD COT and Liquidity AnalysisHey what up traders welcome to the COT data and Liquidity report. It's always good to go with those who move the market here is what I see in their cards. I share my COT - order flow views every weekend.
🎯 Non Commercials added significant longs which creates a strong support, we will most likely see higher prices over time.
📍Please be aware that institutions report data to the SEC on Tuesdays and data are reported on Fridays - so again we as retail traders have disadvantage, but there is possibility to read between the lines. Remember in the report is what they want you to see, that's why mostly price reverse on Wednesday after the report so their cards are hidden as long as possible. However if the trend is running you can read it and use for your advantage.
💊 Tip
if the level has confluence with the high volume on COT it can be strong support / Resistance.
👍 Hit like if you find this analysis helpful, and don't hesitate to comment with your opinions, charts or any questions.
Analysis done on the Tradenation Charts
Disclosure: I am part of Trade Nation's Influencer program and receive a monthly fee for using their TradingView charts in my analysis.
"Adapt what is useful, reject what is useless, and add what is specifically your own."
— David Perk aka Dave FX Hunter ⚔️

XRP: $10 Breakout? Watch These Algorithmic Windows!This XRP analysis highlights "algorithmic departure windows" (blue circles) where explosive price moves can occur.
Whenever price enters a blue circle, XRP can launch to $10 or higher instantly or within 33 days—no matter the news.
**Key Dates to Watch:
**Possible Departure: July 10, 2025 (fundamentals align)
**Other Windows: May 19 - August 11, 2025; October 22 – November 18, 2025
**Major Target Zone: $8.50–$11.50 (December 25, 2025 – January 26, 2026)
History shows that once price breaks out from these departure windows, XRP can reach its upper targets rapidly—sometimes in a single day, but almost always within 33 days or less.
News is the excuse for the moves—algorithms deliver the predetermined price.

Gold (XAUUSD) – July 8 Analysis | Decision Day at H4 Supply Zone
Gold is currently trading inside a key H4 supply zone (3342–3345) , and today’s session could act as a pivotal turning point for the ongoing structure.
We are now in a region where the H4 may either complete its pullback and resume the uptrend — or allow price to drop deeper toward 3280 before any bullish continuation.
Market Structure Overview
• H4 Trend: Still in a pullback
• M15 Trend: Gave a Change of Character (ChoCh) in the previous session
• Break of Structure (BoS): Not yet confirmed on M15
This puts us in a state of unconfirmed reversal . Without a clean BoS, this could still be a liquidity grab .
Key Levels & Current Setup
📍 H4 Supply Zone: 3342–3345
→ This is where price is currently reacting
→ Sellers may step in here if the broader pullback continues
📍 M15 Structure Status:
→ ChoCh already occurred
→ Price is in a retracement phase
→ BoS is needed to confirm a shift and signal the end of H4 pullback
What Today’s Session Will Decide
🔸 If M15 breaks structure upward (BoS):
→ H4 pullback may be complete
→ Bias turns bullish
→ We’ll plan long setups from M15 POIs with M1 confirmation
🔸 If M15 fails to break and reverses:
→ This could be a liquidity grab
→ Sellers may push price lower
→ Next downside target: 3280 H4 order block , still valid
⚠️ Reminder: Be Prepared for Both Scenarios
• No M15 BoS = No bias
• Wait for structure, not emotion
• Do not force long trades without confirmation
• 3280 remains a high-probability target if rejection confirms
Final Thoughts
This is a structure-led market — we don’t predict, we prepare.
Today’s price action may bring directional clarity.
Structure over speculation.
Let price show intent.
Then act with process, not impulse.
📘 Shared by @ChartIsMirror

NASDAQ Futures: My Plan for current Week (7-11 July, 2025)Week: July 7–11, 2025
Instrument: NASDAQ Futures (NQ)
Trend: Overall, the market remains bullish, but for this week I anticipate a retracement targeting the $22,582 level.
Bias for the week: Bearish
Overview:
This week, I’m watching NQ for a potential move toward the $22,582 level. This expectation is based on how Thursday (July 3, 2025) played out—specifically the buy-side liquidity that was taken, and the clean sell-side liquidity pool left near $22,582.
I also find it notable how the NWOG (New Week Opening Gap) was opened and how price moved below it, which reinforces the short bias.
I would consider opening a short position once I see a confirmed 4H candle close below $22,760, otherwise no trades will be taken.
* Trade execution details will be published separately if my bias confirms.
* for more information -> review my notes on the chart

XAUUSD ShortElite Analysis
Price came back up to structured liquidity.
After obtaining liquidity, it created a Bearish 30m BOS.
Price came into a CIC 15m LP.
I executed on MT5, TradeLocker, and Futures accounts on the 15m time frame.

Daily Analysis- XAUUSD (Tuesday, 8th July 2024)Bias: No Bias
USD News(Red Folder):
-None
Notes:
- No exact bias, expecting gold
to consolidate
-Looking for price to retest
4hr structure high & low
- Potential BUY/SELL if there's
confirmation on lower timeframe
- Pivot point: 3310, 3360
Disclaimer:
This analysis is from a personal point of view, always conduct on your own research before making any trading decisions as the analysis do not guarantee complete accuracy.

SPY Gamma Squeeze Fading – Key Put Wall Battles Ahead 🧨 GEX Options Sentiment (TanukiTrade GEX Chart)
* Current Price: 619.91
* Major Support Wall:
* GEX Cluster Support: 618 → 617 (Highest Negative Net GEX + 3rd PUT Wall)
* Additional GEX Floor: 616.37 (PUT support overlap with SMC zone)
* Resistance Levels:
* 625.34 → First CALL Wall
* 627 → 2nd CALL Wall
* 630 → Top of CALL Gamma Resistance
* Put Wall Dominance:
* GEX7–GEX10 blocks show heavy negative pressure (-47% to -66%) centered between 617–620
* Options Flow Insight:
* PUTS OI: 41.9% – Signaling downside hedges are still dominant
* IVR: 15.3 (low), IVX avg: 18.2 – Implied volatility suggests premium selling could get tricky unless directional trend returns
🔸 Interpretation:
This is a “put-heavy zone” — large GEX support clusters below price (617–618) are temporarily halting further drop, but unless SPY can reclaim 625.34, there's still gamma-driven downside risk.
🟢 1-Hour SMC Price Action
* Recent Structure:
* BOS confirmed → 626.27
* CHoCH to downside below 620 → confirmed rejection
* Current Setup:
* Price is hovering at minor demand between 617–620
* If 616.37 breaks, it opens room toward SMC demand zone at 604–606
* Strong resistance overhead at 625–627 (OB + GEX call wall + CHoCH retest)
🔸 Scenario 1 – Bullish Reclaim:
* Entry: Above 621
* Target: 625.34 → 627
* Stop: Below 616.00
* Setup: Break/retest of CHoCH + reclaim trendline
🔸 Scenario 2 – Bearish Breakdown:
* Entry: Below 616.37
* Target: 606 → 600
* Stop: Above 620
* Setup: Breakdown from demand + confirmed CHoCH retest
📌 Thoughts & Recommendations:
* Scalpers: Watch 620.50–621.00 as intraday pivot.
* If reclaimed, we may see short squeeze into 625–627
* Below 616.37, put flows will likely accelerate
* Swing Traders: Bearish bias unless 625.34 flips → consider spreads or directional puts
* Neutral Edge: This is a gamma battle zone — don’t overcommit, let price pick a side
Disclaimer: This analysis is for educational purposes only and does not constitute financial advice. Trade based on your risk profile and always use a stop-loss.

NVDA at a Make-or-Break Zone – Trade Setups Ahead 🔍 Options GEX Insights (Gamma Exposure):
* GEX Map Observation:
* NVDA is currently trading near 158, slightly under the major Gamma Wall at 160.98.
* This level marks the highest positive net GEX – strong resistance due to heavy call positioning.
* Above that, additional call walls stack at 162.5 → 165 → 167.5, creating a squeeze zone if price breaks out.
* Below, support levels sit at 155 (2nd PUT wall) and 152.5 (3rd PUT wall).
* Volatility & Options Sentiment:
* IVR: 8.8, IVx: 40.8 – low implied volatility rank = cheap options.
* Put Positioning: Only 1.4% = call-heavy environment, skewed bullish.
* Positive GEX (+) across expiries shows dealers will hedge upward if we move beyond 161.
🟢 Bullish Scenario (Breakout/Squeeze Setup):
* Break over 160.98 could ignite a gamma squeeze toward 165–167.5 range.
* Ideal for low delta CALL verticals or debit spreads targeting the 165 zone.
* Weekly options are cheap due to low IV.
🔴 Bearish Rejection Scenario:
* If price stays pinned under 160 and loses 155, dealers start to de-hedge – momentum toward 152/150.
* Consider put spreads or a cautious fade if it breaks structure.
📌 GEX Summary Suggestion:
If NVDA stays under 160, price may remain pinned or retrace. But above 161 opens the gamma doors to 165+. Cheap IV = opportunity.
📊 1-Hour Price Action Technicals:
* Market Structure:
* Previous BOS toward the upside has stalled inside a consolidation box under 160.
* Multiple CHoCH zones form below current price, hinting at exhaustion.
* Price is stuck within a wedge, coiling beneath resistance = compression phase.
* Support & Resistance Zones:
* Resistance: 159.34 → 160.98 (Gamma Wall and price supply).
* Support: 155.34, then 151.10.
* Bullish OB remains untested around 151 area if price flushes.
* Volume & Trend:
* Volume declining during chop = balance phase.
* RSI & MACD show slight bearish divergence, favoring caution near top of range.
⚙️ Trade Thoughts:
* Scalp Setup:
* Above 160.98 = scalp long toward 162.5/165, tight stop at 159.3.
* Below 155 = scalp short toward 152 zone.
* Swing Setup:
* Long only on strong breakout close above 161 with volume.
* Short swing possible under 155 if CHoCH confirms trend flip.
Conclusion:
NVDA sits at the pivot point of either breaking out toward 165+ or rejecting and retracing toward 152. GEX and price both hint at a coiled move ahead. Stay nimble, follow the volume.
Disclaimer: This analysis is for educational purposes only and does not constitute financial advice. Trade at your own risk.

AMZN Coiled at Key Gamma Level! Trade Setup Inside📊 GEX (Options Sentiment) Analysis – AMZN
* Current Price: $223.20
* Gamma Wall (Call Resistance): $225 – Highest Net GEX, significant resistance zone.
* CALL Walls: Stack from $225 → $230 → $232.5 → $235
→ Suggests upside resistance builds fast; option sellers may try to cap the rally here.
* PUT Wall Support: Cluster at $215 → $212.5 → $210
* GEX Sentiment:
* GEX: ✅ (Green)
* IVR: 32.2 | IVx Avg: 35.6
* CALLs Positioning: Low (5.9%), moderate skew
* Interpretation:
Price pinned near $225 likely due to gamma forces. Any close above could trigger a quick gamma chase toward $230–232+. But failure = fast fade back to $215 support.
📌 Options Strategy Suggestion:
* Bullish Setup: Wait for break/close > $225. Consider vertical debit spreads (e.g., 225c/230c) for limited risk.
* Bearish Rejection: If AMZN gets stuffed at $225 again, short-term PUT spreads toward $215 are viable (e.g., 222p/215p).
🕐 1-Hour Price Action + SMC Intraday Trade Plan
* Structure:
* BOS → CHoCH → Sideways in tight range between $223–224.50
* AMZN is consolidating inside a tight breaker block zone under $225.
* Uptrend channel still valid with higher lows holding.
* Support: $221.88 → $218.75
* Resistance: $224.66 → $227.12
* Bias: Neutral to mildly bullish unless $221 fails.
🔍 Intraday Trade Scenarios
1. Breakout Play (Bullish):
* Trigger: 1H candle closes above $224.66 with volume
* Entry: $225.10
* Target: $227.10 → $230
* Stop: $222.80
2. Fade Play (Bearish):
* Trigger: Break below $221.88 with CHoCH
* Entry: $221.60
* Target: $218.75 → $217.00
* Stop: $223.40
Watch the box: AMZN is stuck in a decision zone. Don't chase. Let it break first.
Final Thoughts:
AMZN is coiled tightly beneath its Gamma Wall. A clean break could trigger aggressive movement either way, so position sizing and stop discipline are critical. Avoid overtrading inside the box.
Disclaimer: This analysis is for educational purposes only and does not constitute financial advice. Trade responsibly and manage your risk.
