TONUSDT Analysis – Trendline Breakout | Liquidity| Arc + Target📈 Chart Summary:
The TONUSDT 30-minute chart presents a clean smart-money setup after a trendline breakout, volume absorption, and liquidity fill, supported by a beautifully formed ARC accumulation pattern. This structure hints at institutional involvement and a strategic roadmap for the next probable moves.
🔎 Technical Components Breakdown
1️⃣ Trendline Breakout – Shift in Structure
Price had been following a descending trendline with multiple touches, establishing bearish market structure.
Eventually, that trendline was violently broken to the upside, signaling a change in character (CHOCH) – one of the first signs of a potential bullish reversal.
The breakout candle was strong, with a wide body and notable bullish volume. This often indicates institutional interest or engineered breakout via a stop-hunt.
2️⃣ Volume Absorption – Smart Money Accumulation
After the breakout, the price didn't immediately rally. Instead, it consolidated with wicks on both sides – a sign of volume absorption.
This is where smart money absorbs opposing orders, typically absorbing sellers before a larger directional move.
This consolidation confirmed the idea of liquidity engineering – they trap liquidity (shorts) and use it as fuel.
3️⃣ Liquidity Filled – Stop Hunt Behavior
A sharp wick into previous highs grabbed resting liquidity, filling orders and sweeping stop losses.
This action invalidated weak resistance, setting up the platform for a larger move.
🧠 Conceptual Structure – ARC Play & Reversal Dynamics
✅ ARC Formation – Rounded Accumulation Base
The light green arc highlights the rounded bottom, a common technical pattern representing accumulation over time.
This kind of base often indicates that smart money is building positions silently, especially after a significant downtrend.
In this context, the ARC acts as a dynamic support, and the structure mimics the reversal of market sentiment from bearish to bullish.
🌀 FMFR Zone – “First Move Fake, Then Reversal”
Labeled FMFR zone between 3.22–3.26 signifies a potential trap setup.
The expectation is a manipulated downward move (fakeout) that will be quickly reversed, catching breakout sellers off-guard.
Smart traders can use this as a high-probability re-entry zone by waiting for wick rejection, engulfing candles, or bullish divergences.
📍 Short-Term Targets & Zones
🟩 Next Mini Reversal Zone – 3.38 to 3.42
This is a probable area for minor pullback or distribution, especially for scalpers or short-term trades.
Price may stall here due to earlier supply and psychological round levels.
🟦 Remaining Liquidity Zones – 3.55 to 3.63
Higher timeframe liquidity remains uncollected above.
If bullish momentum continues with support from volume and structure, expect price to sweep these levels next.
These zones are ideal for medium-term swing targets.
🧾 Trade Setup Idea (Not Financial Advice)
Item Details
Entry On rejection/confirmation within FMFR zone (3.22–3.26)
Stop-Loss Below arc support or structural low (3.18 area)
TP1 3.38 (Mini reversal zone)
TP2 3.55 (Liquidity target 1)
TP3 3.63+ (Extended target)
📘 Market Psychology in Action
Fear/Greed Play: Initial selloff invited fear, smart money accumulates quietly via the arc. Fakeout traps greed and late shorts.
Trap-Reversal Model: FMFR zones exploit retail stops, offering entries for institutional players.
Liquidity Mapping: The chart clearly maps how price is attracted to uncollected liquidity zones – a classic order flow approach.
Beyond Technical Analysis

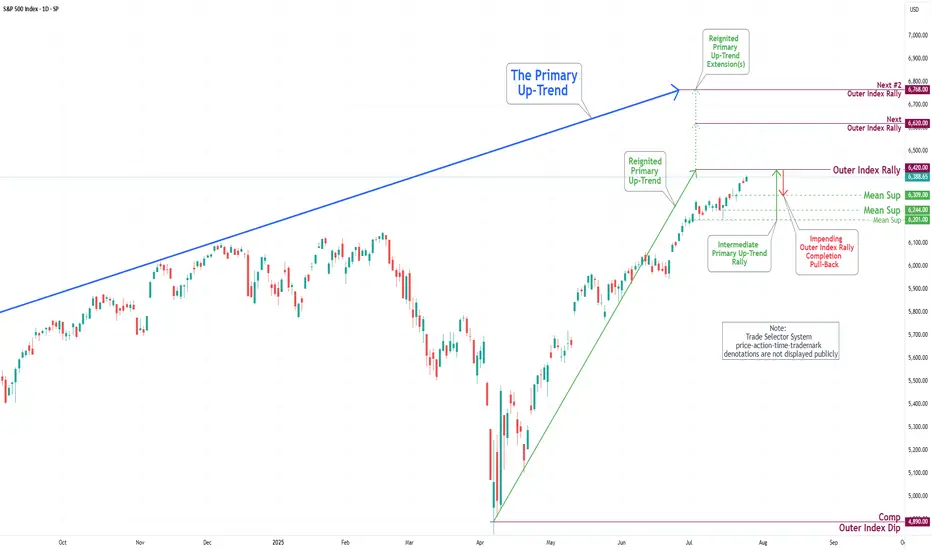
S&P 500 Daily Chart Analysis For Week of July 25, 2025Technical Analysis and Outlook:
In the trading activity observed last week, the S&P 500 Index exhibited a predominantly upward trajectory. It traded around the Key Resistance level of 6314. It successfully broke through this level, with the primary objective being to complete the Outer Index Rally at 6420, as outlined in the previous week's Daily Chart Analysis.
It is crucial to acknowledge that the current price movement may prompt a substantial pullback following the completion of the Outer Index Rally, with the main target identified as the Mean Support level of 6309. Following this potential downward adjustment, it is anticipated that the index will resume its upward trend, targeting a retest of the forthcoming completion of the Outer Index Rally at 6420.
EUR/USD Daily Chart Analysis For Week of July 25, 2025Technical Analysis and Outlook:
During the previous week's trading session, the Euro experienced an increase following the completion of the Inner Currency Dip at the 1.156 level. It subsequently surpassed two significant Mean Resistance levels, namely 1.167 and 1.172; however, it reversed direction by the conclusion of the trading week. Recent analyses indicate that the Euro is likely to undergo a sustained downward trend, with a projected target set at the Mean Support level of 1.169 and a potential further decline to retest the previously completed Currency Dip at 1.156. Nonetheless, it remains essential to consider the possibility of renewed upward momentum towards the Mean Resistance level of 1.177, which could initiate a preeminent rebound and facilitate the completion of the critical Outer Currency Rally at 1.187.

Gold setup for coming week.Hi everyone
This is our setup going into the last week of July trading week.
We could possibly see market retest the 3321-3324 zone & make its way back up to 3347 area, this will also be an area to be monitored for possible break out that will lead back to 3362.
We are looking to get a possible downward pressure from 3345 area to 3303.
Let always look at what market presents & bag potential profits at pivitol areas.
Have a good weekend & good trading week coming up

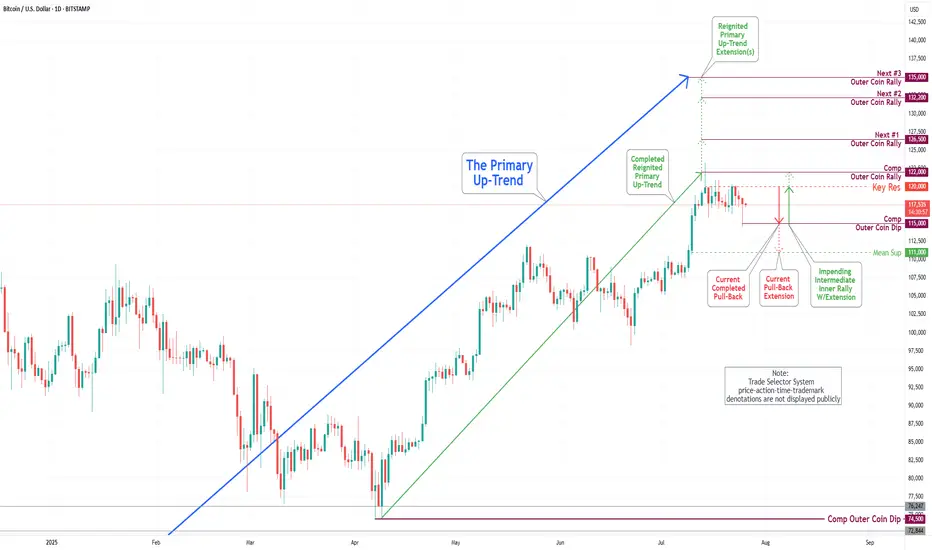
Bitcoin(BTC/USD) Daily Chart Analysis For Week of July 25, 2025Technical Analysis and Outlook:
In the trading session of the previous week, the Bitcoin market exhibited considerable volatility as it retested the Key Resistance level at 120000. On the lower end of the spectrum, the market engaged with the Mean Support levels at 117500 and 115900, culminating in the completion of the Outer Coin Dip at 115000. Currently, the coin is poised to retest the Key Resistance at 120000 once again. This anticipated rebound will necessitate a retest of the completed Outer Coin Rally at 122000. The additional target levels for the renewed Primary Up-Trend are 126500, 132200, and 135000.
#ARKM is ready for an upside move of more than 150%#ARKM is ready for an upside move of more than 150%, and the remaining altcoins are set for a 100% move.
This will be the final upside move—after this, a severe crash will follow, one beyond imagination.
For example, SOL could fall below even $50.

Just like #AKRM, #SOL can also pump 100%Just like #AKRM, #SOL can also pump 100%..
SOL will also have this kind of exit rally. Whether there is a war between the US, Iran, and Israel or not, the market will crash very badly.

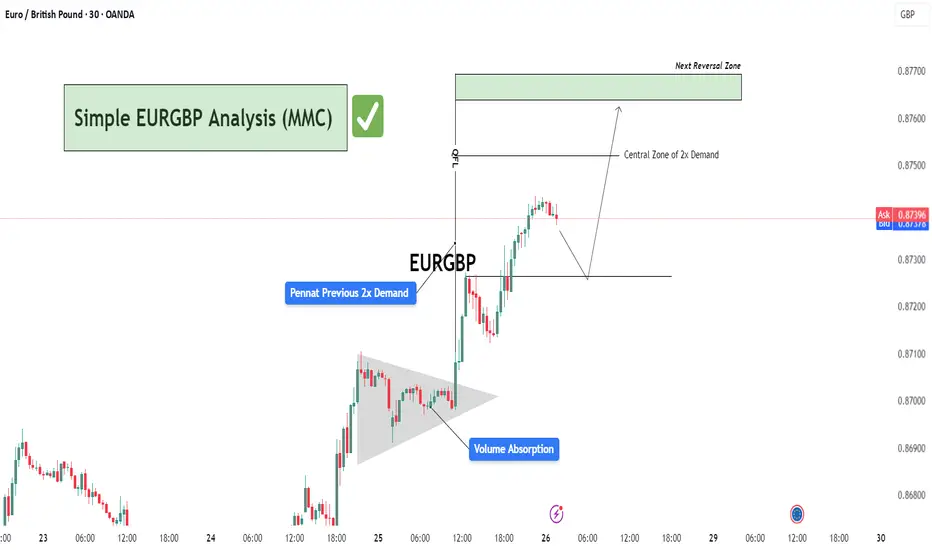
Simple EURGBP Analysis (MMC) – Bullish Continuation or Reversal?🕵️♂️ Chart Overview – 30-Min Timeframe (OANDA)
This EURGBP chart illustrates a classic bullish continuation structure following a volume absorption phase and pennant formation, leading into a vertical price expansion toward a potential reversal zone. The technical flow demonstrates smart money accumulation and re-accumulation before a sharp bullish leg.
🔷 Phase 1: Bullish Accumulation via Pennant Formation
The chart begins with a tight consolidation structure marked as a pennant, typically a continuation pattern.
This area coincides with “Previous 2x Demand”, hinting at a strong institutional buying interest.
The Volume Absorption label suggests that sell-side liquidity was efficiently absorbed—often a precursor to bullish breakouts.
📈 Phase 2: Breakout & Price Expansion
Price breaks out of the pennant aggressively, validating the absorption theory.
The post-breakout rally continues with minimal retracement, showcasing impulsive bullish momentum.
The QFL (Quasimodo Failure Level) is also marked—this serves as a structural footprint left by trapped sellers.
🟩 Next Levels to Watch: Reversal or Re-Entry Zones
As the price approaches the green "Next Reversal Zone" (0.87650–0.87700), watch for potential exhaustion or a reaction.
The Central Zone of 2x Demand (just below 0.87500) could act as a re-entry level for continuation long setups.
Anticipated short-term correction before continuation, as depicted by the projected path.
🧠 Strategic Insight & Trade Planning
Aggressive Bulls: May target breakout pullbacks near the Central Zone of Demand for intraday continuation.
Conservative Traders: Should wait for a clean reaction from the green Reversal Zone. If rejection is confirmed, short opportunities with tight stops become favorable.
Watch the price behavior around 0.87300–0.87500—this will likely dictate whether continuation or correction prevails.
You Are NOT Your P<here was once a tree that stood alone at the edge of a cliff, overlooking the vast sea.
Some days, the sun shone bright, the winds gentle, the water below calm and peaceful. Other days brought heavy storms, fierce winds, crashing waves, rain so relentless it seemed the skies might never clear again. The seasons came and went. The skies changed again and again. But the tree never thought of itself differently because of the weather.
It did not feel more valuable on a sunny day. It did not feel broken or weak when storms battered its branches. The tree simply stayed rooted. It understood something quietly powerful - “ the weather was never personal. It wasn’t about the tree.”
The tree remained, growing slowly over years, not because the conditions were always perfect, but because it had learned to stand through all of it.
This is something most traders forget.
We step into the market with good intentions, hungry to learn, eager to succeed. But somewhere along the way, we make a mistake. We let our self-worth become tied to the numbers on the screen.
A green day makes us feel smart, in control, like we’ve cracked the code. A red day, on the other hand, shakes us to the core, makes us question our place, our skill, even our worth, like we never belonged here at all.
The danger isn’t just in the financial losses. It’s in how we let the market shape how we see ourselves.
But here’s the truth the market won’t tell you upfront: the market doesn’t know who you are, and it doesn’t care . It doesn’t remember what you did yesterday, how many hours you’ve spent learning, or how desperately you want this to work.
The market moves how it moves. Sometimes it moves with you, sometimes it moves against you. It’s neither a punishment, nor a reward. It’s just movement.
Your wins don’t make you superior. Your losses don’t make you dumb. Both are part of the same cycle, and part of the environment you’ve chosen to work in. If you build your self-image on the outcome of your last trade, you’ll forever live on a fragile edge. Every swing will shake you. Every drawdown will feel like a verdict on who you are.
But trading isn’t about who you are today. It’s about who you become over time.
Your job isn’t to seek approval from a system built on randomness and probability. Your job is to build yourself on steadier ground. To stay rooted, like a tree. To let your process define you, not your P&L.
The storms will come. They always do. Volatility, uncertainty, periods where nothing seems to work - these are all part of the environment. The traders who survive are NOT the ones who try to outmuscle the market. They are the ones who protect their capital, their energy, and their mindset through it all.
They understand that being steady is more important than being brilliant - that surviving is more valuable than being right.
Detach your self-worth from the swings. Build your identity on discipline, patience, humility - the quiet habits you control. These are your roots. And when the storm rolls in, they’re what keep you grounded.
When you stop tying your self-image to your short-term results, you begin to see the market more clearly. You stop forcing trades to make yourself feel better. You stop chasing moves to prove something. You start letting your process do its work, even when it feels slow.
You start to realise that progress in trading is quiet and unfolds slowly, almost invisibly, much like a tree growing through the seasons. Small shifts accumulate over time, often going unnoticed, until one day you look back and truly see how far you’ve come.
When you understand this, red days lose their sting. Green days lose their arrogance. Both just become part of the weather. You adapt, endure, and move forward.
You don’t measure yourself by how much you made this week, this month, or even this year. You measure yourself by how well you followed your process , how calmly you handled the volatility, and how patient you remained when there was nothing to do.
The market doesn’t ask for perfection - only consistency. And consistency comes from within, not from chasing highs or avoiding lows, but from standing firm through both.
Like the tree on the cliff, your strength is not in avoiding the weather. Your strength is in understanding that the weather will pass. It always does. Your roots - your process, your discipline, your patience, are what keep you standing until it does.
⦿ Learn to protect your energy.
⦿ Learn to lose without self-doubt.
⦿ Learn to win without ego.
⦿ Learn to wait without fear.
⦿ Learn to wait patiently
Your worth is not in your wins or losses. It’s in how you carry yourself through both.
Stay rooted.
The seasons will change.
And when they do, you’ll still be here, stronger than you were before.
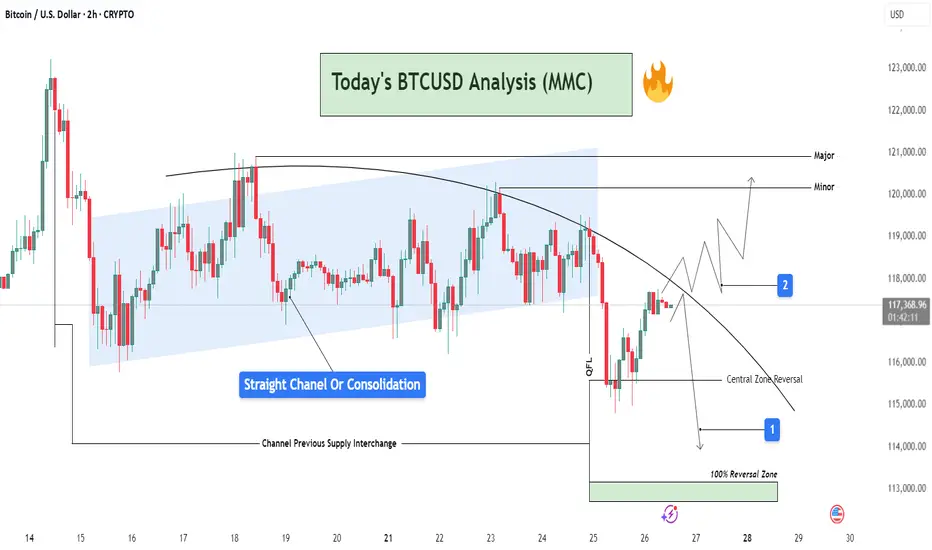
BTCUSD Analysis : Channel Break + QFL Setup | Structure Analysis📊 Chart Overview
This 2H BTCUSD chart reveals a comprehensive view of market behavior transitioning from a phase of consolidation into a potential breakout or further rejection. The price action is analyzed inside a parallel channel, transitioning into a curved resistance path, which is currently governing the market structure.
🔵 Phase 1: Consolidation Inside a Straight Channel
Price has respected a clear ascending channel (highlighted in blue) from July 16 to July 24.
This phase shows a range-bound movement with defined supply and demand zones.
Labelled as “Straight Channel or Consolidation”, this represents a potential accumulation/distribution zone.
The Channel Previous Supply Interchange marks an important S/R flip zone, now serving as a key reference for future reactions.
🔻 Phase 2: Break of Structure & Curved Resistance
Price broke down below the channel support and is now respecting a downward curved trendline.
This indicates a shift in momentum from neutral to bearish, forming lower highs.
A sharp drop occurred post-channel exit, marking a QFL (Quasimodo Failure Level) area—hinting at smart money involvement or liquidation hunt.
🔁 Reversal Scenarios & Key Levels
There are two possible future paths visualized:
🟥 Scenario 1: Bearish Continuation
Price respects the curved trendline, failing to break resistance.
A rejection near the current region (~117.5k) could lead price back toward:
Central Zone Reversal near 115,000 USD
Further into the 100% Reversal Zone (green zone) near 113,500–114,000 USD
Ideal for short entries after clear rejection confirmations.
🟩 Scenario 2: Bullish Breakout
Price breaks and sustains above the curved resistance.
Temporary resistance seen at Minor level (~120,000 USD), followed by Major resistance near 121,000 USD.
This scenario requires bullish volume and reclaim of structure, invalidating the short bias.
🧠 Strategic Viewpoint & Trade Mindset
Market is at a decision point—either confirming a bearish rejection from dynamic resistance or invalidating it for a bullish reversal.
Patience is key; wait for either:
A failed breakout attempt (short opportunity), or
A confirmed breakout and retest (long opportunity).
Use lower timeframes (15m–1h) for execution once direction is confirmed.
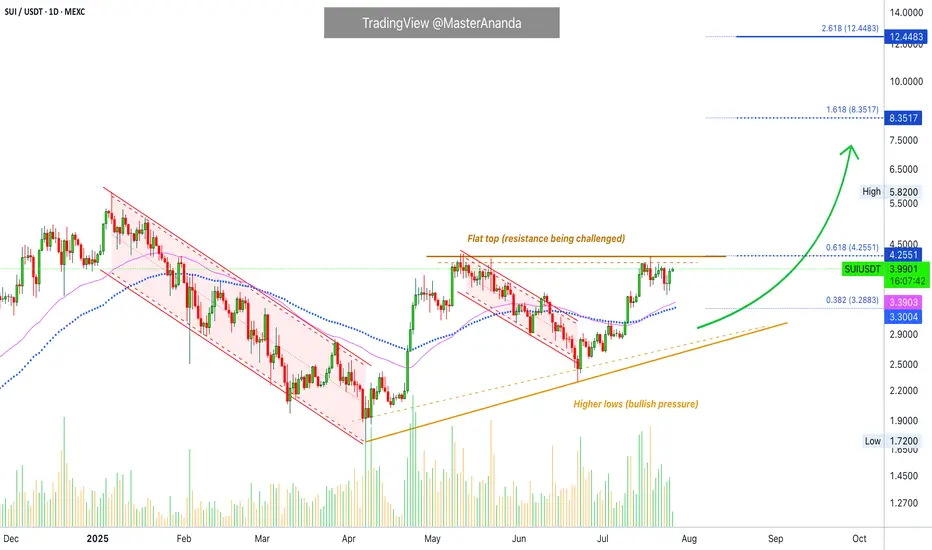
Sui Works To Break Resistance · Play To Win · No StressA flat bottom is bullish because support can be confirmed as found when sellers (bears) fail to move prices past a certain point. A flat bottom produces the double-bottom and triple-bottom reversal signals. When the bottom is flat, depending on the phase the market is going through, we can easily say bullish. A flat top is not bearish, it is a completely different story.
A flat top does not confirm resistance being found and thus a new bearish wave. We need context, it all depends on the phase of the market cycle. A flat top with a rising bottom is bullish. Resistance has been found and is being challenged. It is getting weaker because the action is converging towards the resistance point based on the rising bottom.
Here we have a flat top with a rising bottom (higher lows). The market is bullish. SUIUSDT has been bullish and growing since late 2024. This is the content we need. A bullish tendency, a rising market and resistance being challenged more than once starts to reveal a picture. Next this resistance won't have enough strength to hold. Next time SUI moves up it will continue rising to produce a new all-time high and this will unleash a price discovery phase.
SUIUSDT is trading above EMA55 and EMA89. The last challenge of resistance produced a rejection but this rejection did not lead to a test of the above mentioned support. Another signal of strength.
Sellers cannot push prices lower because buyers are active, or simply put, there are not enough sellers to start and thus the retraces become smaller and shorter. Price dynamics favoring the bulls.
The lows are getting higher, the top remains the same. When the low meets the top that is when resistance breaks. Sui is going up, it will continue to grow; the targets on the chart can be hit short-term.
There is no sense of urgency, but a major advance can be happening within days.
Are you ready to trade and hold? Prices going up aiming high trading requires no effort.
The effort is mental, the mind can be trained to succeed and avoid stress. Mental stress = lack of knowledge. If you know prices are going up and you feel certain about it, no effort is required to win because the mind doesn't have to struggle with questions relating to the strength of your position. The mind does not need to answer, should I buy or should I hold? Since you know prices are going up based on the chart, you can sit back and relax watching your profits grow. Reading relaxes the mind. Knowledge is food for the soul. The more you learn, the more you know the wiser you become. Wise means effortless. Trading can be effortless if you read the right stuff. Play to win. Plan before trading and you already won.
Answer the question before the situation shows up. That's it, you've just removed the complexity out of the game. When there is no complexity, there is no mental stress. Since you are sitting on a chair in front of a device, trading becomes effortless. To trade with peace in your mind you just need the right knowledge and that is what you are getting here. No stress.
Continue reading and watch your profits grow. Increase your peace, free up your time and enjoy better results.
Namaste.
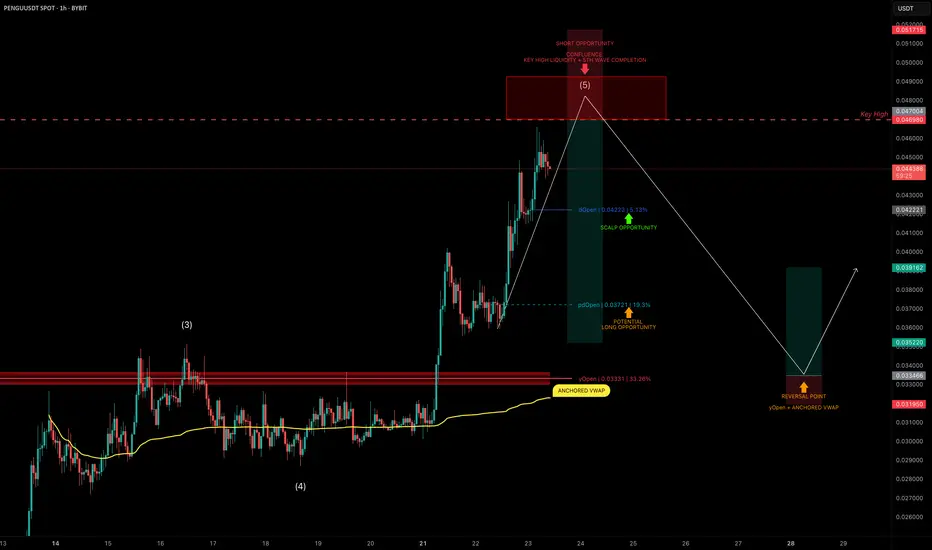
PENGU Topping Out? Targeting 30% Downside After Liquidity SweepPENGU has had an explosive run, but it now looks to be nearing completion of wave 5 of its current Elliott impulse.
We’re approaching a key high at $0.04698, a likely liquidity grab zone — and potentially a great area to position for a short trade.
🧩 Short Setup Overview
➡️ Wave 5 Completion Incoming:
Price is showing signs of exhaustion as it approaches $0.04698, where liquidity is likely stacked above the previous high.
➡️ SFP Trigger Zone:
Watch for a swing failure pattern (SFP) at $0.04698 — confirmation for a potential short entry.
➡️ Psychological Resistance:
The $0.05 level also sits just above — a classic psychological barrier that may get tapped or wicked into.
🔴 Short Trade Setup
Entry: After a confirmed SFP at $0.04698–$0.05
Target (TP): Yearly Open (yOpen) — potential move of ~30%
Stop-loss: Above post-SFP high
R:R: Excellent asymmetry if setup confirms
🛠 Indicator Note
In this analysis I'm using my own indicator called "DriftLine - Pivot Open Zones ", which I recently published.
✅ It helps highlight key open levels, support/resistance zones, and price structure shifts — all critical for confluence-based trade planning.
Feel free to check it out — you can use it for free by heading to my profile under the “Scripts” tab.
💡 Educational Insight: How to Trade Wave 5 Liquidity Sweeps
Wave 5 tops often trap late longs, especially when paired with psychological levels and key highs.
➡️ Patience is key — wait for a rejection pattern or SFP before entering.
➡️ Liquidity sweeps first — then the move.
Final Thoughts
PENGU is pushing toward $0.04698–$0.05, but this may be its final move up before correction.
With the yearly open as a logical target, and clear confluence via DriftLine, this setup offers a clean short opportunity — if confirmation comes.
Stay sharp, let price lead, and trade the reaction — not the prediction.
_________________________________
💬 If you found this helpful, drop a like and comment!
Want breakdowns of other charts? Leave your requests below.
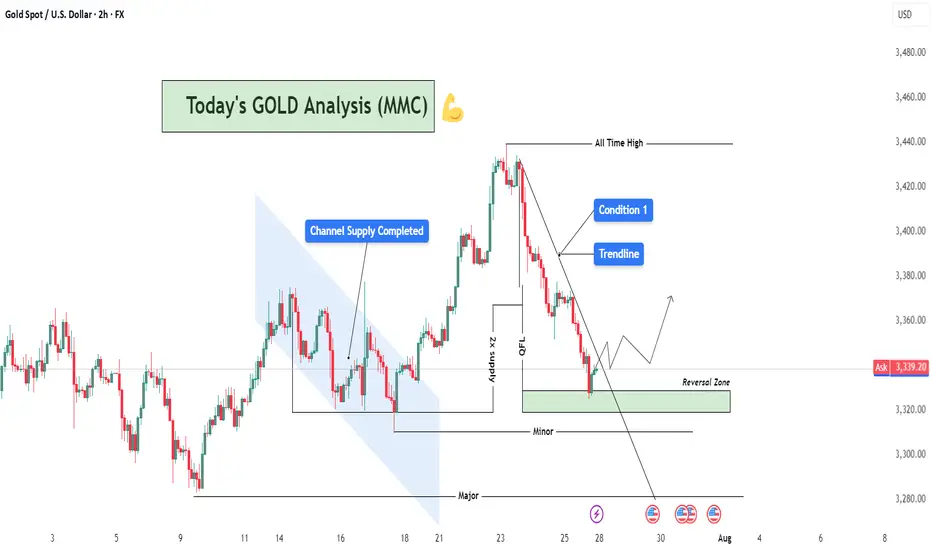
XAUUSD Analysis : Reversal Zone & Trendline Break Setup 🧠 Market Breakdown (Based on MMC Concepts)
Gold (XAU/USD) recently touched an All-Time High, followed by a sharp correction respecting a clean descending trendline — confirming strong selling pressure in the short term.
After price completed a Channel Supply zone (highlighted), it dropped significantly and created a 2x Supply Structure along with a QFL (Quasimodo Failure Level) — a strong indication of liquidity engineering by smart money.
Now, price has entered the Major Reversal Zone, which aligns with a key minor structural demand level. The reaction here becomes highly important, as it could mark the beginning of a new bullish leg.
📌 Technical Conditions
Trendline (Condition 1): Still active; breakout confirmation required for bullish entry.
Reversal Zone (Demand Area): Price currently reacting; signs of rejection forming.
Smart Money Behavior: Liquidity sweep + QFL zone = potential institutional accumulation.
Momentum Watch: Look for bullish engulfing or strong pin bar as confirmation.
🎯 Price Levels to Watch
Upside Targets:
🔹 TP1: 3,360 – 3,380
🔹 TP2: 3,420 – 3,440
Invalidation Zone:
🔻 Break and close below 3,300 = bearish continuation likely.
💡 Conclusion
Gold is approaching a decision point. If this reversal zone holds and we break the trendline, we could see a strong rally back toward previous supply zones. However, failure to hold could bring price lower for further liquidity grabs.
Stay patient. Let price confirm.
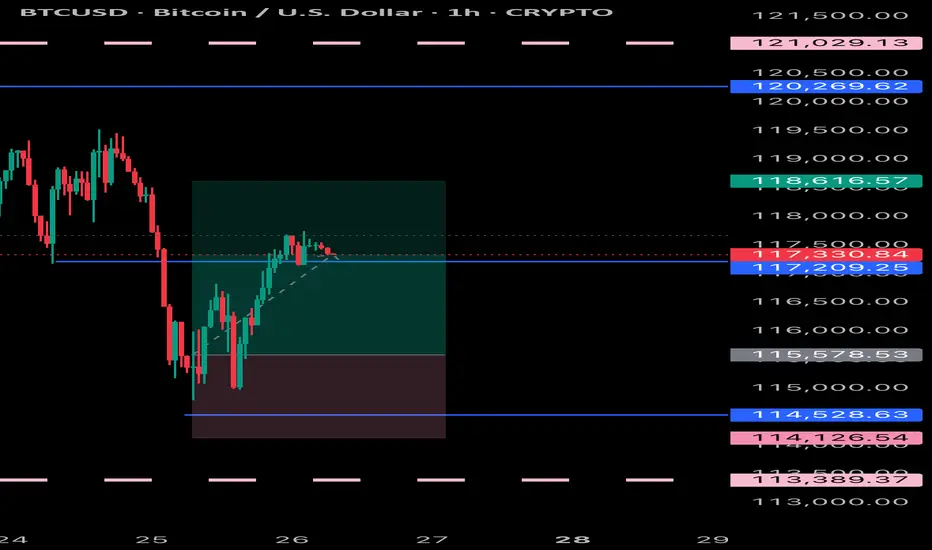
BITCOIN RESULTS Bitcoin has respected the analysis and held very well it’s been following the trend and can partial close some positions and wait for a nice pullback to buy the dip
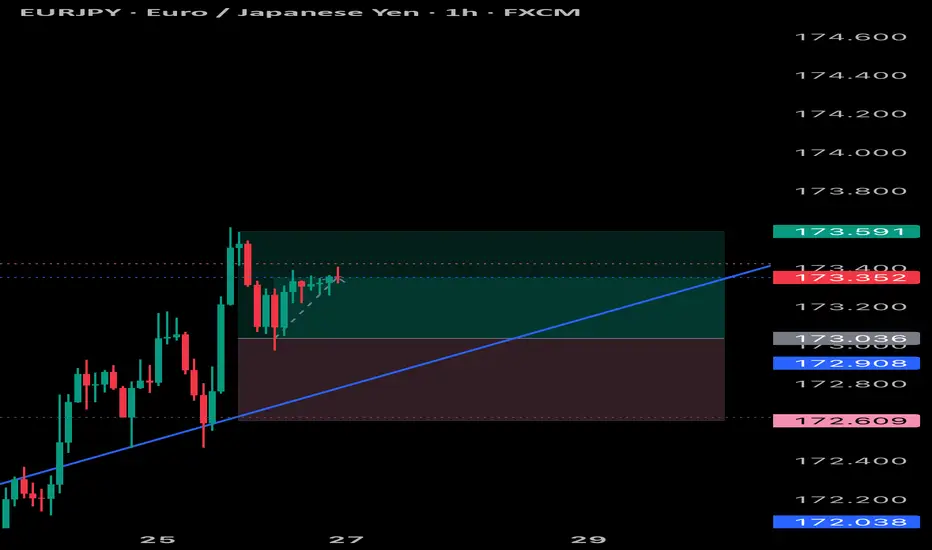
EURJPY LOOKING GOOD Eurjpy has been behaving as expected and can continue to the up side and complete its pattern
Bitcoin Beneath the Arc of Silence - Structural Faith, Tactical?⊢
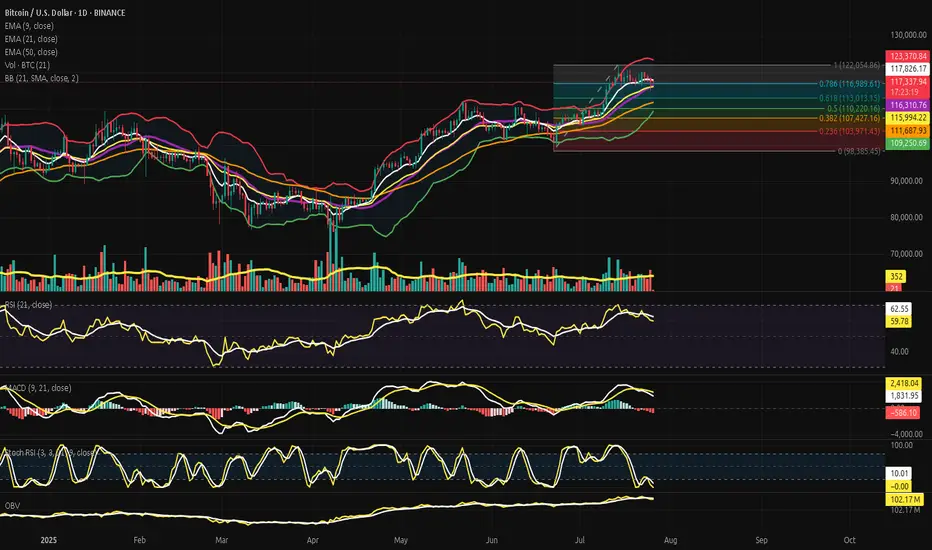
⟁ BTC/USD - BINANCE - (CHART: 1D) - (July 26, 2025).
◇ Analysis Price: $117,421.02.
⊣
⨀ I. Temporal Axis - Strategic Interval - (1D):
▦ EMA9 - ($117,842.79):
∴ The EMA9)is currently positioned at $117,842.79, slightly above the price ($117,421.02), acting as immediate dynamic resistance;
∴ Price has closed below EMA9 for multiple sessions, indicating a fading short-term momentum arc;
∴ The slope of the EMA9 is flattening, signaling an inflection zone rather than active thrust.
✴️ Conclusion: The short-term control line has been lost tactically; a sign of momentum exhaustion but not structural breakdown.
⊢
▦ EMA21 - ($116,001.77):
∴ EMA21 stands at $116,001.77, serving as an intermediate-range support below current price;
∴ The slope remains positive, providing a second-layer bullish structure after the loss of EMA9;
∴ Price has not tested EMA21 since early July - proximity implies possible gravitational pull.
✴️ Conclusion: EMA21 is the next defense line in a suspended structure, acting as the center of tactical compression.
⊢
▦ EMA50 - ($111,691.19):
∴ EMA50 sits at $111,691.19, aligned closely with the (0.236 Fibonacci) and historical cluster zone;
∴ Price has remained well above this level for over 30 sessions;
∴ The slope is clearly positive, marking macro structural support.
✴️ Conclusion: EMA50 represents the last reliable arc before macro invalidation. Its integrity maintains the long-term bullish thesis.
⊢
▦ Fibonacci Retracement:
∴ Retracement is correctly anchored: 1.0 = $122,054.86 (ATH) / 0.0 = $98,385.45 - (June 22 low);
∴ Price currently oscillates within the 0.618–0.5 zone ($113k–$110k), the classical golden pocket;
∴ The golden pocket aligns closely with EMA21 and the Bollinger mean, forming a triple confluence zone.
✴️ Conclusion: Price is inside the Fibonacci heart of reaccumulation - ideal for breakout setups or breakdown invalidation.
⊢
▦ Bollinger Bands (21, 2.0):
∴ The upper band is at $123,377.19, while the middle band rests at $116,314.72;
∴ Price is between the middle and upper bands, consolidating after rejection from the upper line;
∴ The bands are narrowing, indicating a volatility contraction cycle.
✴️ Conclusion: Bollinger geometry confirms volatility suppression, aligning with RSI and MACD flattening - a signal of impending release.
⊢
▦ RSI (21) + EMA9:
∴ RSI is at (59.99), slightly under its EMA9 - (62.59), showing momentum erosion without collapse;
∴ The RSI has declined from the high 70s in late June, signaling tactical cooling;
∴ Remaining above 50 preserves structural bullish bias.
✴️ Conclusion: RSI is in tactical descent, but not structurally bearish - neutral-to-bullish compression.
⊢
▦ MACD (9,21):
∴ MACD line is below signal line, currently at (1,841.01) vs (2,419.86), confirming a bearish cross;
∴ Histogram prints red for several sessions, with fading amplitude;
∴ Despite the crossover, MACD remains in positive territory, indicating soft correction, not trend reversal.
✴️ Conclusion: MACD confirms a tactical retracement, aligned with RSI weakness, yet within bullish context.
⊢
▦ Stochastic RSI (3, 3, 21, 9):
∴ Current value is 0.00, denoting extreme oversold conditions;
∴ Multiple sessions have closed at this level without relief;
∴ Historically, flatlines at 0.00 often precede upward jolts.
✴️ Conclusion: Stoch RSI indicates exhaustion of momentum - potential for rebound or failed bounce.
⊢
▦ Volume + EMA21:
∴ Volume on current sessions is below the 21-period EMA, confirming absence of strong sell-side dominance;
∴ No abnormal spikes or climaxes are visible - neither panic nor breakout yet;
∴ Volume profile aligns with Bollinger contraction.
✴️ Conclusion: Quiet volume supports the thesis of controlled tactical consolidation, not distribution.
⊢
▦ OBV + EMA9:
∴ OBV stands at 102.17M, flatlined with EMA9;
∴ No divergence detected relative to price;
∴ Momentum of accumulation remains static but not deteriorating.
✴️ Conclusion: OBV is in neutral stance, neither confirming breakout nor selloff - favors tactical patience.
⊢
🜎 Strategic Insight - Technical Oracle:
∴ Bitcoin is suspended in a compressed volatility range beneath its local high, resting upon layered support zones defined by EMA21, Bollinger median, and the Fibonacci golden pocket (0.618–0.5);
∴ Momentum indicators (RSI, MACD, Stoch RSI) are all in tactical decline, yet no structure has been broken - price still floats above all macro EMA's (21, 50) with OBV unshaken;
∴ The short-term weakness is absorbed within a higher-order structural integrity, suggesting latent potential awaiting a fundamental catalyst.
✴️ Conclusion: The oracle observes a coiled market, technically restrained but not structurally broken - an archetype of Strategic Suspension Beneath the Arc of Silence.
⊢
∫ II. On-Chain Intelligence - (Source: CryptoQuant):
▦ Exchange Netflow Total + 9EMA - (All Exchanges):
∴ The current netflow is (-864.6 BTC), remaining firmly below its EMA9 baseline;
∴ The 9-day moving average of netflows is flat-to-negative, signaling persistent withdrawal pressure from exchanges;
∴ Sustained negative netflows in conjunction with a stable price floor indicate non-speculative cold storage behavior.
✴️ Conclusion: Netflow structure is bearish for exchanges, but bullish for long-term price, as BTC flows into private custody.
⊢
▦ Miner to Exchange Flow + 9EMA - (All Miners):
∴ Current flow from miners hovers near 1.2K BTC/day, well below the EMA9 which trends above 3K;
∴ The flow has not pierced its EMA9 in recent weeks, despite BTC testing local highs - a strong non-distribution signal;
∴ The divergence between low miner outflows and high price resilience confirms supply-side discipline.
✴️ Conclusion: Miner flows remain suppressed beneath EMA9 - a structurally bullish posture amid local consolidation.
⊢
▦ Funding Rate + 9EMA - (All Exchanges):
∴ The funding rate is (+0.012), sitting above its EMA9, indicating a minor long bias across derivatives markets;
∴ There is no spike or deviation suggesting leveraged imbalance - the slope of the EMA9 remains shallow;
∴ Funding above EMA9, with RSI and MACD fading, implies a passively bullish positioning without euphoria.
✴️ Conclusion: Funding is technically constructive, aligned with healthy sentiment - not overheated, nor bearish.
⊢
▦ Spent Output Profit Ratio - (SOPR) + 9EMA - (Adjusted):
∴ The SOPR stands at 1.016, maintaining a position above its 9-day EMA;
∴ No dip below 1.0 has occurred in recent sessions, showing that BTC is being transacted in profit;
∴ EMA(9) acts as a median around 1.0 - a psychological pivot between profit realization and capitulation.
✴️ Conclusion: SOPR above EMA9 confirms a healthy trend, with profits being realized in harmony - not desperation.
⊢
🜎 Strategic Insight - On-Chain Oracle:
∴ All four on-chain pillars - Exchange Netflow, Miner Flow, Funding, SOPR - operate in favor of structural continuation, with none indicating exhaustion or distribution;
∴ The alignment of each indicator above or below EMA9 in the appropriate direction (accumulation vs euphoria) forms a cohesive bullish framework;
∴ The lack of pressure from miners, and the smooth funding environment, give room for technical consolidation to mature without triggering panic.
✴️ Conclusion: The oracle discerns a hidden current of strength, buried beneath the tactical mist. Structural forces remain aligned with continuation - though the flame is dimmed, it is not extinguished.
⊢
⧉ III. Contextvs Macro-Geopoliticvs - (July 25, 2025):
▦ 10:00 AM - Core Capital Goods Orders - (Durable Goods excl. Defense & Aircraft):
∴ The index, a proxy for business investment, contracted by (-0.7%) in June - the sharpest monthly decline of the year;
∴ This marks a decisive loss of momentum in private-sector expansion;
∴ While shipments rose slightly (+0.4%), the delta is attributed to inflation, not demand.
✴️ Conclusion: The business sector shows signs of hesitation, reinforcing the case for policy accommodation.
⊢
▦ 14:30 PM - Trump's Visit to the Federal Reserve - (Rare Executive Intervention):
∴ President Trump visited Powell directly, urging him to cut interest rates to "save the American engine";
∴ Powell responded with a carefully chosen phrase: “The country is doing really well” - read by markets as passive affirmation;
∴ This act marks a rare intrusion into Fed independence, adding political volatility to monetary policy expectations.
✴️ Conclusion: The Fed is now politically cornered, caught between inflation resilience and political coercion.
⊢
▦ 16:00 PM - Market Response & Euphoria Spike:
∴ U.S. indices - S&P 500, Nasdaq, Dow Jones - all reached all-time highs on the back of Powell's phrase and Trump’s pressure;
∴ Approximately 80% of S&P companies beat earnings expectations, providing fuel to the narrative;
∴ Market interpreted silence as assent, reactivating the “Fed put” theory.
✴️ Conclusion: Markets responded as if Powell had already signaled rate cuts, despite no formal commitment.
⊢
▦ 18:00 PM - Rate Cut Probability Assessment - (CME/FedWatch):
∴ Probability of a rate cut in September rose to (61.8%), precisely echoing the Fibonacci retracement now governing Bitcoin price;
∴ This alignment signals macro-on-chain-temporal resonance;
∴ Powell reiterates data dependency - no promises, but full optionality.
✴️ Conclusion: The macro veil is thin - policy pivot is anticipated, but not yet manifest. Tactical patience is vital.
⊢
🜎 Strategic Insight - Macro Oracle:
∴ Economic data weakens subtly;
∴ Political pressure intensifies;
∴ Market euphoria resurfaces on whispers, not substance.
∴ The silence of Powell is being interpreted, not spoken - a dangerous act of collective projection.
✴️ Conclusion: The Fed speaks in veils - and markets trade in illusions. The macro climate is now psychologically unstable, but not yet structurally broken.
⊢
𓂀 Stoic-Structural Interpretation:
▦ Structurally Bullish - Tactically Suspended:
∴ Price action remains well supported above all macro EMA's (21, 50), the OBV is intact, and no distribution signals are present;
∴ Momentum indicators (RSI, MACD, Stoch RSI) confirm a tactical cooldown, not collapse;
∴ On-chain fundamentals (Netflows, Miner Behavior, SOPR, Funding) remain constructively aligned.
✴️ Conclusion: Structurally, the market preserves a bullish foundation, while tactically locked in volatility suppression and directional indecision.
⊢
▦ Tactical Range Caution:
∴ Resistance: $123,377.19 (Upper BB), then $126,000 (local expansion);
∴ Pivot: $117,800 (EMA9) / $116,000 (EMA21);
∴ Support: $113,013.15 (Fibonacci 0.618), $111,691.19 (EMA50), then $107,400 (macro reversal threshold).
✴️ Conclusion: Tactical range is compressed within a ($116K-$123K) gate. Below $111K triggers macro risk.
⊢
◩ Codicillus Silentii - Strategic Note:
∴ In the breath between policy and projection, the markets chant futures yet unspoken.
BTC rests not in fear, nor in hope - but in silence.
✴️ Final Seal: The arc is intact. The veil has not fallen. Patience is power.
⊢
⧉
· Cryptorvm Dominvs · MAGISTER ARCANVM · Vox Primordialis ·
⚜️ ⌬ - Silence precedes the next force. Structure is sacred - ⌬ ⚜️
⧉
⊢
BTC Consolidates Below 119,300 Over the Weekend💎 BTC WEEKEND PLAN UPDATE (26/07)
NOTABLE BTC NEWS
The cryptocurrency market is attempting to stabilize after a wave of sell-offs during Friday’s Asian session, when Bitcoin (BTC) dropped to an intraday low of $114,723. A recovery trend is gradually strengthening, with BTC trading at $115,868 at the time of writing, indicating that buying interest at lower levels may increase in upcoming sessions.
TECHNICAL ANALYSIS PERSPECTIVE
Symmetrical Triangle Pattern
BTC is currently fluctuating within a symmetrical triangle pattern, with converging upper and lower trendlines. This pattern typically signals a strong consolidation phase before a decisive breakout.
Scenario unfolded as planned:
• The price failed to break the resistance zone around $120,000 (previously forecasted as a likely failed breakout zone).
• BTC then dropped sharply to the support zone around $115,000, touching the lower trendline and the potential breakout zone.
• At this level, the price rebounded as expected, indicating strong buying pressure at support.
MA lines supporting the trend:
• The price is currently moving around the 200-day MA (red line), showing that the dynamic support is working effectively.
• The 50-day MA (yellow line) is acting as short-term resistance. If broken, it could support the recovery momentum.
Two potential upcoming scenarios:
🔼 If BTC breaks above the $119,500 – $120,000 zone with strong volume, it may continue to test higher levels around $123,000 – $125,000.
🔽 Conversely, if it faces strong rejection around $119K and turns downward, BTC may retest the support zone at $114,000 – $115,000 once again.
Stay tuned to the channel for the latest and continuous updates on XAUUSD, CURRENCIES, and BTC.

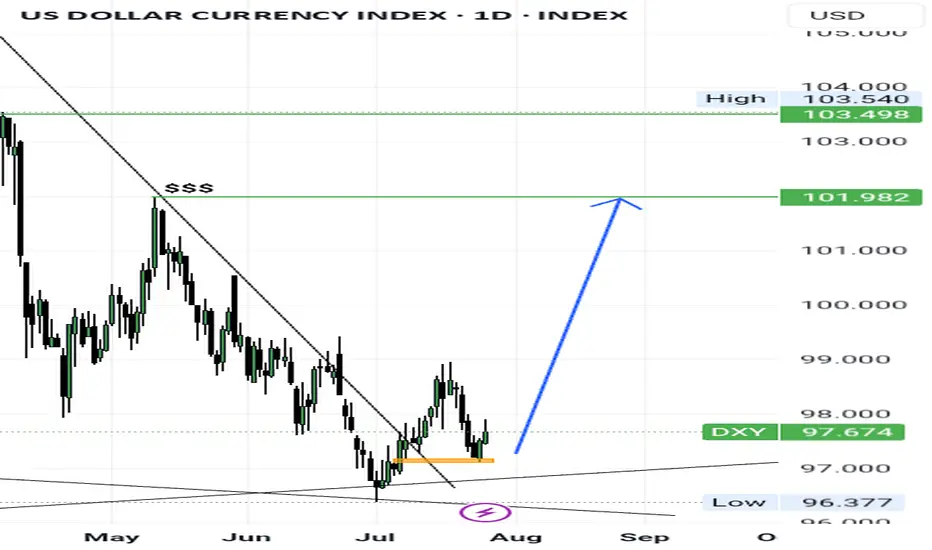
Dollar indexDollar index in deep discount
Looking for higher prices this month
This my idea not a signal
#ICT
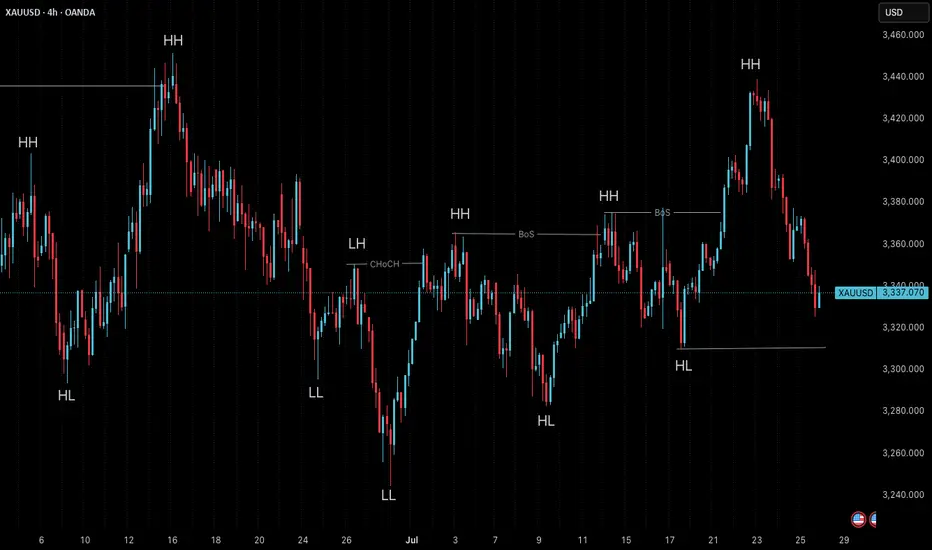
Market Structure is Not Strategy — It’s Your Starting Point“The chart doesn’t hide anything. But your mind does.”
Before any indicator, setup, or signal… comes structure.
🔍 What is Market Structure?
At its core, market structure is the sequence of higher highs (HH) and higher lows (HL) in an uptrend, or lower lows (LL) and lower highs (LH) in a downtrend.
It is the skeleton of price .
Everything else — entries, zones, signals — is just clothing.
If you can’t see the skeleton, you’re reacting to noise.
🎯 Why It Matters:
It’s not a signal. It’s context .
It tells you whether you’re trading with the market or against it .
It defines where your patience begins — not where your entry is.
Market structure helps you let go of the urge to chase. It brings order to the chaos.
🧩 Key Components to Track:
Break of Structure (BoS): Confirms trend continuation
Change of Character (ChoCH): Signals a potential reversal
Swing Points: Define the intent behind price moves
Liquidity Sweeps: Often mask real structure beneath short-term traps
🛑 Common Mistake:
Most traders jump straight to the setup without asking the most important question:
“Where am I in the structure?”
They try to buy a pullback — in a downtrend.
They try to fade a move — right before continuation.
They chase candles — instead of waiting for alignment.
That’s not strategy. That’s stress.
🛠 Tip to Practice:
Use this simple framework to build clarity:
Start from the H4 chart — this gives you the broader directional bias
Drop to M15 — here’s where structure begins to form tradeable setups
Finally zoom into M1 — this is where confirmation happens before entry
Ask yourself:
Where did the last BoS or ChoCH happen on each timeframe?
Is M15 aligning with H4 intent — or contradicting it?
Did you enter after M1 confirmation , or based on impulse?
You don’t need to predict price. You need to align with it.
🪞 Final Thought:
Structure isn’t strategy.
It’s the mirror that shows what’s real before your bias speaks.
When you master structure, you stop forcing trades — and start flowing with them.
💬 Want more like this?
If this post resonated with you — drop a comment below.
Let me know what you'd like to dive deeper into — price action, gold setups, market structure, or the psychology behind your trades.
I’ll build future tutorials based on what matters to you.
📘 Shared by @ChartIsMirror
GBPJPY Daily chart analyses
Advanced Price Analysis with Timeframes
1. Key Observations from the Provided Data (H4 Chart)
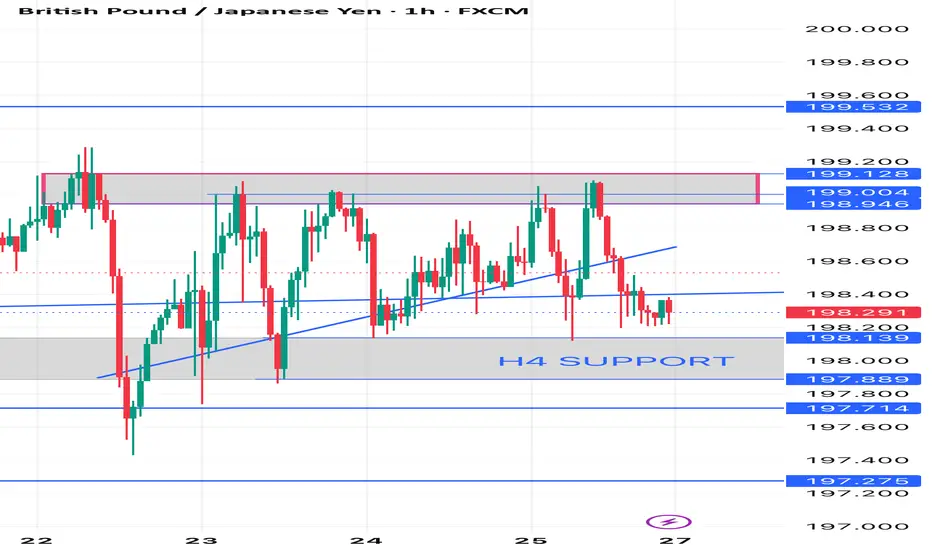
Current Price197.800 testing the H4 SUPPORTlevel at 198.000
- Trend Downtrend (Lower Highs & Lower Lows).
- *Recent Structure
- Resistance ~199.600 (rejected multiple times).
- **Support -198.000 (critical level).
- If 198.000 breaks next support is 197.500–197.000
*a) Higher Timeframe (Daily/D1)
- If the **daily trend is bearish**, the H4 downtrend is likely to continue.
- If the **daily trend is bullish**, the H4 drop could be a retracement before a bounce.
- **Key Confirmation Needed**:
- Check if **198.000 aligns with a daily support level** (e.g., Fibonacci, moving averages).
**b) Lower Timeframe (H1/M15)
- **Breakdown Scenario**: If price stays below **198.000** with strong bearish candles, expect a drop to **197.500 → 197.000**.
- **Rebound Scenario**: If price holds **198.000** and forms a bullish reversal pattern (e.g., hammer, double bottom), a bounce to **198.600–199.000** is possible.
---
*3. Key Levels to Watch
| **Level** | **Importance** | **Scenario** |
|-----------------|-------------------------|--------------|
| **199.600** | Strong Resistance | Only break = Trend reversal |
| **198.600** | Minor Resistance | Re-test if bounce occurs |
| **198.000** | **H4 SUPPORT (Critical)** | Hold = Bounce / Break = Drop |
| **197.500** | Next Support | Target if 198 breaks |
| **197.000** | Psychological Support | Strong demand zone |
---
4. Trading Strategy Suggestions**
- **Bearish Bias (Down)**:
- Short if **198.000 breaks** with confirmation (e.g., closing below + high volume).
- Target: **197.500 → 197.000**.
- Stop Loss: **Above 198.300**.
- **Bullish Bias (Up)**:
- Long if **price bounces from 198.000** with a bullish pattern.
- Target: **198.600 → 199.000**.
- Stop Loss: **Below 197.800**.
---
5. Final Verdict**
- **Higher Probability**: **Downside** (unless 198.000 holds strongly).
- **Reversal Signal Needed**: Bullish engulfing, RSI divergence, or volume surge.
**Recommendation**: Wait for **confirmation at 198.000** before taking a trade.
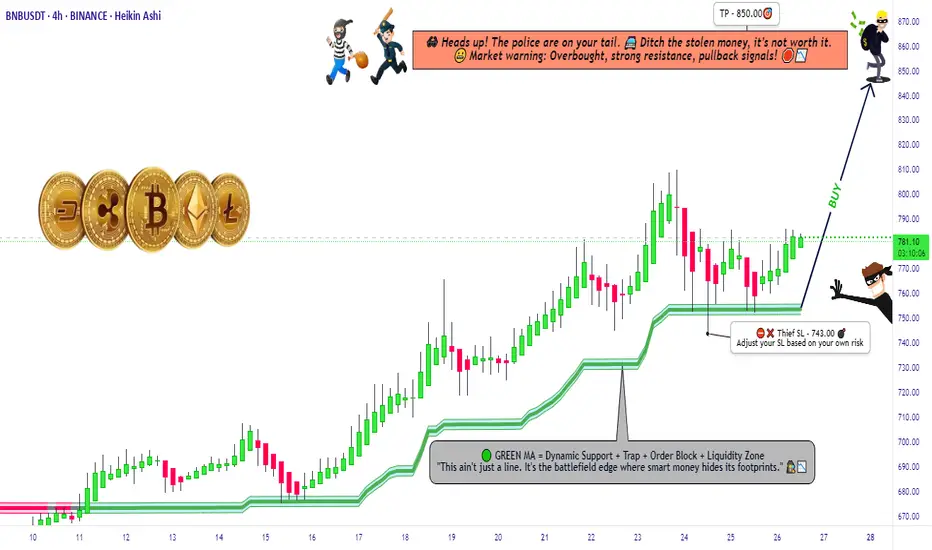
"BNB Primed for a Pump – Thief Trading Mode Activated!"🚨 BNB/USDT HEIST PLAN – SWIPE THE BULLISH LOOT BEFORE COPS ARRIVE! 🚨
🌟 Attention, Money Makers & Market Robbers! 🌟
(Hola! Oi! Bonjour! Hallo! Marhaba!)
The BNB/USDT vault is CRACKED OPEN—time to execute the ultimate heist! 🏦💰 Based on 🔥Thief Trading Style Analysis🔥, here’s your lucrative robbery blueprint for the Binance Coin vs. Tether market.
🔐 MASTER PLAN: LONG ENTRY HEIST (HIGH-RISK, HIGH-REWARD)
🎯 TARGET: 850.00 (or escape before the cops show up!)
🚨 POLICE TRAP ZONE: Overbought + Strong Resistance – Bears & cops are lurking!
💎 TAKE PROFIT EARLY & TREAT YOURSELF! (You’ve earned it, outlaw!)
⚔️ ENTRY STRATEGY: SWIPE FAST OR WAIT FOR THE PULLBACK!
🤑 VAULT IS OPEN! Enter any price if you’re bold (instant long).
🕵️♂️ SMART THIEVES: Use buy limit orders near 15M/30M swing lows/highs for a safer heist.
🛑 STOP-LOSS (ESCAPE ROUTE)
Thief SL: 743.00 (4H candle wick – adjust based on your risk tolerance!)
⚠️ WARNING: If the cops (bears) break in, DON’T HESITATE—RUN!
🎯 TARGETS & ESCAPE PATHS
Scalpers: Trail your SL & escape with quick loot! (Only long-side allowed!)
Swing Bandits: Hold strong but watch for police traps!
📡 MARKET INTEL (WHY THIS HEIST WILL WORK)
Bullish momentum in play! (But stay sharp—consolidation & reversals possible.)
Fundamentals, COT Reports, On-Chain Data, & Sentiment all hint at more upside!
🚨 TRADING ALERTS – DON’T GET CAUGHT!
📰 NEWS = VOLATILITY! Avoid new trades during major releases.
🔒 LOCK PROFITS! Use trailing stops to protect your stolen gains.
💥 BOOST THIS HEIST – STRENGTHEN THE SQUAD! 💥
🔥 Hit the LIKE & FOLLOW to support the robbery team!
🚀 More heists coming soon—STAY TUNED, OUTLAWS! 🚀
🎯 Trade Smart. Steal Big. Escape Faster. 🏴☠️
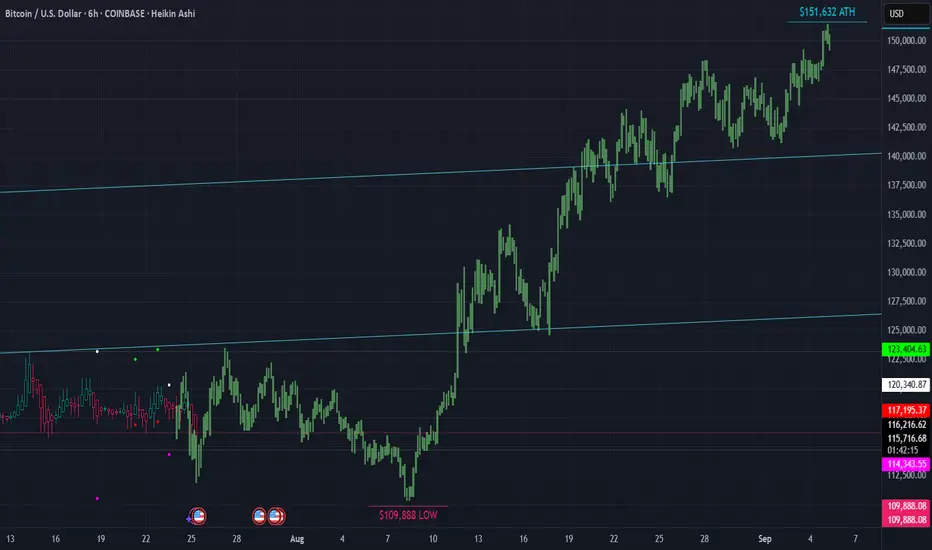
▒₿▒ BITCOIN FORECAST | 6HR ▒₿▒Hello @everyone. Long time. . . I was on a 3 year spiritual journey. I am back now and have many good things in the works. Who took my (non-financial) advice 3 years ago when I called the low of $15K a year in advance? And who believed me that it would go to $150K once we hit that $15K low? Who believes me now? Are you still thinking we've topped? Or do you think we have our $150K target in sight?
Have a look at this 6 HR Forecast. We have a low coming around AUG 8TH at $108K. And the most notable ATH of $151K around SEPT 5TH.
This is it. The playbook years in advance. I have never asked for anything or tried to sell you anything. It's all been done from a position of "paying it forward". Please, if you've taken my advice do the same.
I first bought Bitcoin in 2011. Was part of the MT GOX hack. And have had many ups and downs since then. One thing has never changed. . . And that is that Bitcoin is King. It's an asset class and a hedge against inflation. We're seeing this happen more now than ever. It's only got inflation as the halvings continue. The inflation rate of Bitcoin since/after this last halving is 0.84%. Bitcoin is up over 120-Million percent since 2011. Look at the BTC 6 MONTH candle chart and you'll see what Crypto asset you want to be in. Bitcoin is the only crypto asset.
When I first bought BTC it wasn't possible to purchase on an exchange with a debit card. I had to buy Linden Dollars from "Second Life" (which didn't always work because I had to deal with International Payment Processors due to US restrictions), then convert them to BTC on Mt Gox. Hardware wallets were not a thing. Now you can setup your bank account to auto buy on Coinbase and others. It's easier than ever. Store your coins on a hardware wallet and stay protected from the next FTX or hack.
This is the asset of the future. The "Digital Gold". I've seen the future and it runs on Blockchain and digital/virtual currency. A Super Artificial Intelligence will run and optimize all of our systems. Voting, assets, deeds, ownership and more will all be on a public blockchain ledger.
DEMATERIALIZATION/VIRTUALIZATION
INFORMATION & MEDIA
Music
We had music being played using metal, tin and wax in the 1800's, then mid 1900's we went to Vinyl and later in the late 1900's we went to plastic cassettes. And in 1990 - 2000 we had the CD which used laser optics to play the music. Effectively digitizing it. Then of course the MP3 player which was the next evolution in digitization. But where are we now? We are still in a type of digitization however it's evolved also. We are in a virtualization, where the music is not stored on the device itself, it's stored on servers which host the data to be accessed in the cloud/virtually.
You see the progression?
Metal/Wood > Vinyl/Plastic > Plastic/Digital > Metal/Digital > Virtual
(Or even further simplified on a higher level it would be Thoughts > Things > Digital > Virtual >)
What else has taken this path?
Movies
Metal/Wood - Film Projectors & Metal Reels
Plastic - Video Cassettes
Plastic/Digital - Optical Discs
Metal/Digital - Personal Digital Devices
Virtual - Cloud-Based Streaming
Books & The Written Word
Metal/Wood - The Printing Press
Paper/Plastic - Paperback Books
Plastic/Digital - Digital Archives on Discs
Metal/Digital - Handheld E-readers
Virtual - Cloud Libraries & Audiobooks
Money & Finance
Metal/Wood - Gold & Silver Coins (and even wooden coins)
Plastic - Payment Cards
Plastic/Digital - Secure Chip Cards
Metal/Digital - Mobile & Digital Wallets
Virtual - Digital/Crypto Currencies
This is the natural progression path. Are you the one still listening to cassette tapes while the MP3 player exists? Are you still using a physical thing while the virtual exists? (Nostalgia aside.)
NOW IS THE TIME!
Gold has been virtualized and it's called Bitcoin. While trading at 1,200,000 times more than it was 14 years ago it still has not yet realized it maximum value. In the past Gold and Silver were taken and bank/promissory notes were given in exchange. In fact it became illegal to not exchange your Gold and Silver for Dollars in the US. (1933 with the issuance of Executive Order 6102 by President Franklin D. Roosevelt.) The Dollar has no cap and is no different than Doge in that sense. BTC has a cap and a proof of work concept just like Gold. If you need to pay for things convert your BTC when you need to but holding or planning on making money off any other crypto currency that does not provide a base layer for our new virtualized financial infostructure it will not happen.
BITCOIN IS FINANCIAL LIBERATION FOR YOU, YOUR FAMILY, FRIENDS AND LEGACY.
BTC is up 3,000% in the past five and half years alone.
That's a 5.45 X Multiple per year. 545% growth rate compared to the unlimited and inflationary Dollar. Why not setup a reoccurring dollar cost average automatic purchase? We live in a day of virtualized programable currency, why not convert vapor currency to digital gold with the few clicks?
I am not a financial advisor. I am a Bitcoin Maximalist. Trade at your own risk. Assume your own responsibilities.
I have a big project I'm working on right now but also working on some TV Indicators in the background. I will share them with you all once I'm done testing them.
DISCLAIMER
I AM NOT A FINACIAL ADVISOR, NOR AM I YOURS. THIS IS NOT FINANCIAL ADVICE. MEARLY DOODLINGS ON A MATHMATICALLY DRIVEN GRAPHICAL INTERFACE, TRACKING AN INVISIBLE 256BIT MILITARY-GRADE ENCRYPTED ASSET. . . FOR ENTERTAINMENT/AMUSEMENT PUROSES ONLY. ENJOY!
EUR_CAD LOCAL SHORT|
✅EUR_CAD is going up to retest
A horizontal resistance of 1.6110
Which makes me locally bearish biased
And I think that we will see a pullback
And a move down from the level
Towards the target below at 1.6077
SHORT🔥
✅Like and subscribe to never miss a new idea!✅
Disclosure: I am part of Trade Nation's Influencer program and receive a monthly fee for using their TradingView charts in my analysis.
