Gold (XAUUSD) – July 7 | Watching 3326 POI for Short Setup🟡 Gold (XAUUSD) – July 7 Bias | Short Setup Developing at 3326 POI
The Gold market remains in a pullback phase on the H4 timeframe , and price may still revisit the 3280 H4 order block before resuming its broader uptrend.
On the M15 timeframe, structure has now shifted clearly.
After an initial Change of Character (ChoCh) , we’ve seen a confirmed Break of Structure (BoS) , placing M15 officially in a downtrend .
✅ Why This Matters:
With both ChoCh and BoS complete, we no longer treat this move as a potential liquidity grab — it now reflects a valid structural reversal in the short term.
But instead of reacting impulsively, we study this shift as a live example of structure-based price action — and how entry zones form after confirmation.
🔍 M15 Order Block in Focus:
• 3323.500 – 3327.800 → Valid M15 POI for short setups
→ This is where we expect price might retrace before resuming its move
→ We’ll observe this zone for M1 confirmation (ChoCh + micro BoS) before taking any action
🎯 Target Zone:
• 3280 – H4 Demand
→ A clean structure-based target aligned with higher timeframe pullback
→ Our model requires minimum 1:3 RR , anchored to price structure
🔁 Key Takeaways:
• H4: Pullback phase remains intact
• M15: Downtrend confirmed (ChoCh + BoS complete)
• Execution plan: Observe 3326 POI; respond only if structure confirms again on M1
• No anticipation. No prediction. Just process.
📖 This is structure-based learning in real time.
We don’t chase setups — we observe shifts.
Let structure teach you. Let price confirm it.
The chart is the mirror.
📘 Shared by @ChartIsMirror
Beyond Technical Analysis

Bears pressure early week below 3300⭐️GOLDEN INFORMATION:
Gold prices (XAU/USD) face renewed selling pressure, dipping toward the $3,320 level during the early Asian session on Monday. The pullback comes as June’s stronger-than-expected US Nonfarm Payrolls (NFP) report has reshaped market expectations around the Federal Reserve’s (Fed) policy path. Investors now turn their attention to the upcoming release of the FOMC Minutes on Wednesday for further guidance.
The US economy added 147,000 jobs in June, beating expectations and slightly up from May’s revised figure of 144,000. Meanwhile, the Unemployment Rate held steady at 4.1%. These figures reinforced the view that the labor market remains resilient, thereby lowering the odds of an imminent Fed rate cut. As a result, the US Dollar has strengthened, weighing on non-yielding assets such as Gold.
⭐️Personal comments NOVA:
Downtrend at the beginning of the week, gold price returns to accumulate below 3300
⭐️SET UP GOLD PRICE:
🔥SELL GOLD zone: 3337- 3339 SL 3344
TP1: $3328
TP2: $3312
TP3: $3300
🔥BUY GOLD zone: $3297-$3295 SL $3290
TP1: $3308
TP2: $3320
TP3: $3330
⭐️Technical analysis:
Based on technical indicators EMA 34, EMA89 and support resistance areas to set up a reasonable SELL order.
⭐️NOTE:
Note: Nova wishes traders to manage their capital well
- take the number of lots that match your capital
- Takeprofit equal to 4-6% of capital account
- Stoplose equal to 2-3% of capital account


Trade Breakdown: XAUUSD 15-Min | Liquidity Grab + Reversal PlayOANDA:XAUUSD
Psychological Setup
This trade is rooted in the psychology of smart money and retail behavior. After a sharp drop in price, most retail traders expect continuation (trend-following). However, institutions often manipulate liquidity zones — hunting for stop-losses before a true reversal. This trade capitalizes on that behavior.
🔍 Technical Explanation:
🔻 1. Market Structure:
Price was previously in a downtrend, forming lower highs and lower lows.
A falling wedge pattern (red lines) formed after a strong bearish move, signaling potential bullish reversal.
Price broke the wedge to the upside — a classic reversal signal.
🔁 2. Liquidity Concept:
Below the wedge: The market grabbed liquidity by taking out stop losses of buyers who entered too early.
Above the wedge (TP Areas):
TP 1 Area (red box): This is the first logical resistance where previous supply sits — many sellers will enter here, providing buy-side liquidity.
Next Target Liquidity (grey box above): This is a major imbalance zone and likely where stop-losses of early short sellers are stacked.
Price is expected to grab liquidity from that area (marked by the red arrow).
✅ Entry & Trade Logic:
Entry Zone: After liquidity was swept at the bottom of the wedge, a bullish engulfing candle formed near demand — signaling institutional interest.
Risk-Reward Setup:
Targeting 0.80% move (approx. 26.48 points).
Trade is based on reversal from demand zone + wedge breakout + liquidity grab confirmation.
🎯 Target Projections:
TP1 Area: Conservative target, just above recent structure.
Final Target: High-probability liquidity zone where market is drawn to clean up resting orders (grey zone).
🧠 Why This Trade Matters (Trading Psychology Insight):
Most retail traders get trapped in emotional entries — entering shorts after a drop or longs too early in a wedge.
Smart money waits for liquidity sweeps before moving price in the desired direction.
This setup shows the importance of patience, structure, and understanding market psychology rather than reacting emotionally to price action.
📌 Key Takeaways:
📉 Trap: Falling wedge builds false bearish confidence.
🧠 Psychology: Stop hunts create fuel for reversal.
📈 Reaction: Smart money absorbs liquidity, moves price toward next inefficiency.
Hashtags:
#XAUUSD #SmartMoney #LiquidityHunt #TradingPsychology #GoldTrade #PriceAction #WedgeBreakout #FXOpen #TechnicalAnalysis #SupplyDemand

Market Insights with Gary Thomson: 7 - 11 JulyMarket Insights: RBA Cut in Focus, UK GDP Weakens, Canada Jobs, FOMC Clues, Tariff Deadline
From rate decisions to rising unemployment and tariff deadlines, this week’s macro landscape is shaped by evolving dynamics and shifting momentum. If you’re trading FX, commodities, or indices — this is a moment to pay close attention.
In this episode of Market Insights, Gary Thomson unpacks the strategic implications of the week’s biggest events:
— RBA Interest Rate Decision
— UK GDP Growth Rate
— Unemployment Rate in Canada
— FOMC Minutes
— Tariff Deadline
Don’t miss out—gain insights to stay ahead in your trading journey.
This video represents the opinion of the Companies operating under the FXOpen brand only. It is not to be construed as an offer, solicitation, or recommendation with respect to products and services provided by the Companies operating under the FXOpen brand, nor is it to be considered financial advice.

EURusd Short position 07/07/2025English : According to our analysis, we anticipate a bearish scenario.
Morocan Darija : kanchofo d'apres l'analyse dyalna antsanaw hboot
ATENTION : I only share my ideas, not signal

Is Bitcoin Working Out a New Leg Up? Onchain Data Says It May BeDiamond hands are waving goodbye and institutions are loading up — it’s why Bitcoin may be struggling to break out of its current consolidation range. How long can this accumulation phase continue?
And yes — we look at the trades of the decade — two transactions where each one moved a cool billie from a $7.8K investment in 2011.
Some people cling to their Bitcoin BITSTAMP:BTCUSD stash like it’s their last protein bar before a marathon. Others, apparently, wake up one day and decide to dump their coins and browse the market for islands.
Welcome to the silent shift that’s redefining the big players in the Bitcoin market, worth about $2.2 trillion as per data from our Crypto Coins Heatmap .
Old-school whales — the very early adopters and miners holding the OG wallets — are quietly selling, while institutional heavyweights sweep in to buy every dip (part of the reason why lately every breakout never breaks out).
Over the past year, these OG whales have shed about half a million Bitcoin — worth north of $50 billion — according to data from 10x Research. And guess who’s gobbling it all up? ETFs, corporate treasuries, and family offices that didn’t want anything to do with crypto five years ago.
Is it bullish? Is it bearish? Is it just Bitcoin being Bitcoin? Let’s pull up the charts, squint at the data, and see what the world’s most famous digital coin might be plotting next.
📈 A Record High — And Now What?
So here’s the setup. Bitcoin has been strutting under its record high of $111,000 for months now. You’d think the hype machine — from Trump’s pro-crypto administration, to corporate balance sheets going full Michael Saylor (looking at you, GameStop NYSE:GME ) — would send BTC blasting past the Moon and landing on Mars.
Instead? It’s just... chilling. Volatility’s drying up like the last drop of liquidity in a summer Friday session. And the reason is surprisingly simple: the massive handover happening between big, anonymous early adopters and the suit-and-tie institutional crowd.
😌 From Wild Ride to Easy Cruising?
You could argue this is exactly what Bitcoin needs: maturity, respectability, less drama. But don’t tell that to the day traders who want 20% swings before breakfast. As these whales get out and institutions get in, analysts say the upside could be capped at a chill 10% to 20% a year.
Good news for your retirement portfolio, maybe not so great for that “Lambo by Labor Day” dream.
Institutions now hold about 25% of all Bitcoin in circulation — and once these get in, they tend to sit tight for years.
🚀 The $1.1 Billion Time Capsule
Speaking of whales: ever wonder what happens when a Bitcoin wallet goes dark for 14 years? It pops back online to make your mind melt.
On April 3, 2011, a wallet labeled “1HqXB...gDwcK” moved 23,377 BTC to three addresses. At the time, Bitcoin was worth a mere 78 cents. Fast forward: two of those receiving wallets, each with 10,000 BTC, sat dormant for over a decade.
This month, both wallets moved their treasure troves — worth over $1.1 billion each — within 30 minutes of each other. Talk about a coordinated exit. What’s behind the move? Tax planning? A lost key finally found?
A savvy crypto thief who figured how to crack the earliest key generation method? We may never know. Also, OG guy, if you’re reading this — props for the all-at-once move without even a test transaction.
⛓️ What Onchain Data Says
Onchain data is like reading tea leaves for nerds with Bloomberg terminals. It says the supply is tightening — not because there’s less Bitcoin, but because fewer coins are actually available to trade.
When long-term holders move coins, that typically signals big-picture changes. Here’s the twist: the net effect has been… stability. Institutional demand, like Bitcoin exchange-traded funds , soaks up supply just as fast as whales drip it back in.
That’s why Bitcoin’s been stuck in this $100K–$110K limbo, ping-ponging while the accumulation phase is still going strong.
👀 So, Is a New Leg Up Coming?
This is where the optimists and realists start to bicker over the charts. On the one hand, the structural handover to institutions makes Bitcoin more credible, more regulated, and more boring.
But less volatility can mean steadier gains — especially if you believe that the world will always want an inflation hedge that no central bank can print into oblivion.
On the other hand, a sideways market can test your patience more than a typical drawdown. Some of the whales are gone, the suits have arrived, and the easy moonshots might not be so easy anymore.
🌱 The Trade-Offs of Growing Up
Bitcoin was born in the wild west of finance — an anonymous, volatile, meme-fueled phenomenon. Now, it’s drifting deep into the mainstream. That might limit the fireworks, but it also locks in its place as an asset class that’s not going away.
🌊 Closing Thoughts: The Next Billion-Dollar Move
Will we see another $7,800 investment turn into a cool $1 billion? Maybe not exactly like that. But the game isn’t over — it’s just evolving.
Keep your eyes on the whales, the ETFs, the Fed’s next move , and those onchain breadcrumbs.
Over to you , chart-watchers: does this calm consolidation make you bullish, bearish, or just plain bored? Share your thoughts in the comments!

Gold Consolidates Around 3,310 – Waiting for a Breakout📊 Market Developments:
• Gold is currently holding near $3,310, which aligns with the weekly pivot level on TradingView.
• With the upcoming FOMC minutes and key data (CPI, NFP) approaching, the market remains cautious. The USD is stable, keeping gold in a tight range.
📉 Technical Analysis:
• Short-term Resistance: $3,325–3,335 (H4 supply zone)
• Nearest Support: $3,300–3,305 (weekly pivot + H1/H4 lows)
• EMA 09 on H4: Price is trading below EMA09 → short-term bearish bias.
• Candlestick/Volume/Momentum: Lower highs on H4 candles with declining volume indicate weak buying momentum and a possible continuation of consolidation or mild pullback.
📌 Outlook:
• As long as gold stays below $3,305 and the USD remains firm, a pullback toward $3,300–3,295 is likely.
• A break above the $3,325–3,335 resistance zone could trigger a rally toward $3,350 or higher.
💡 Suggested Trade Setup:
🔻 SELL XAU/USD at: $3,322–3,325
🎯 TP: $3,300
❌ SL: $3,332
🔺 BUY XAU/USD at: $3,300–3,303
🎯 TP: $3,325–3,335
❌ SL: $3,295

BTC up following H1 trend linePlan BTC today: 07 July 2025
Related Information:!!!
Bitcoin (BTC) trades slightly below $109,000 at the time of writing on Monday, following its highest weekly close on record. Institutional and corporate demand continues to serve as a key catalyst, with Metaplanet acquiring an additional 2,205 BTC on Monday, while US-listed spot Bitcoin Exchange Traded Funds (ETFs) saw over $769 million in net inflows last week.
As market participants assess the latest bullish indicators, focus now shifts to broader macroeconomic developments, including new trade-related headlines and reports suggesting that the administration of US President Donald Trump may extend the current tariff pause until August 1.
personal opinion:!!!
BTC moves sideways in the trend line, trend line support 108,300
Important price zone to consider :!!!
support zone : 108.300
Sustainable trading to beat the market

waiting for new ATH this week , btc💎 BTC PLAN UPDATE FOR THE BEGINNING OF THE WEEK (07/07)
NOTABLE BITCOIN NEWS: Focus on 4 key points today
1. Elon Musk – “America Party” to Support Bitcoin
Elon Musk has confirmed that his newly formed political party, the “America Party,” will support Bitcoin, stating that “fiat is hopeless.”
2. Cup-and-Handle Pattern Analysis: Targeting $230K
According to technical analysis by Cointelegraph, BTC is forming a “cup and handle” pattern on the monthly chart, which could lead to a target peak of $230,000 if a breakout continues.
3. BTC Price Holds Steady Around $109K Amid “Crypto Week” and Trade Tensions
Bitcoin is currently trading around $109,000, influenced by “Crypto Week” and concerns over U.S. tariffs.
4. Institutional Inflows Increase, But Market Demand Weakens
According to CoinDesk, institutional investors are still buying BTC, but not enough to offset declining demand in the spot market, negatively affecting short-term market sentiment.
⸻
TECHNICAL ANALYSIS PERSPECTIVE
The short-term trend remains bullish. However, the steep slope of the trend indicates buying pressure is still being contested and unstable.
BTC remains stuck at Fibonacci levels—pay close attention to the resistance zones at 112K and 115K. If these two resistance levels are broken, investors may get the answer to whether BTC can approach the 120K level.
In the short term, both gold and BTC are moving sideways, indicating that market liquidity and investor capital are unstable and being divided across multiple portfolios.
==> This analysis is for reference only. Wishing all investors successful trading!

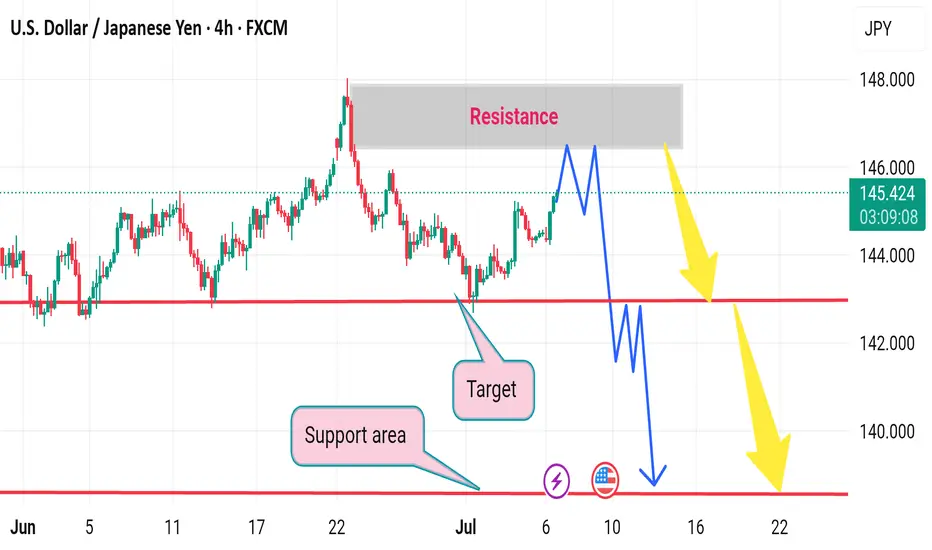
USDJPY h4 strong downResistance Reversal Zone: 145.80–146.20 (watch for break or rejection).
Support Trap Area: 143.80–144.20 (possible fakeout and rally).
Breakout Confirmation: Sustained candle close above 146.30.
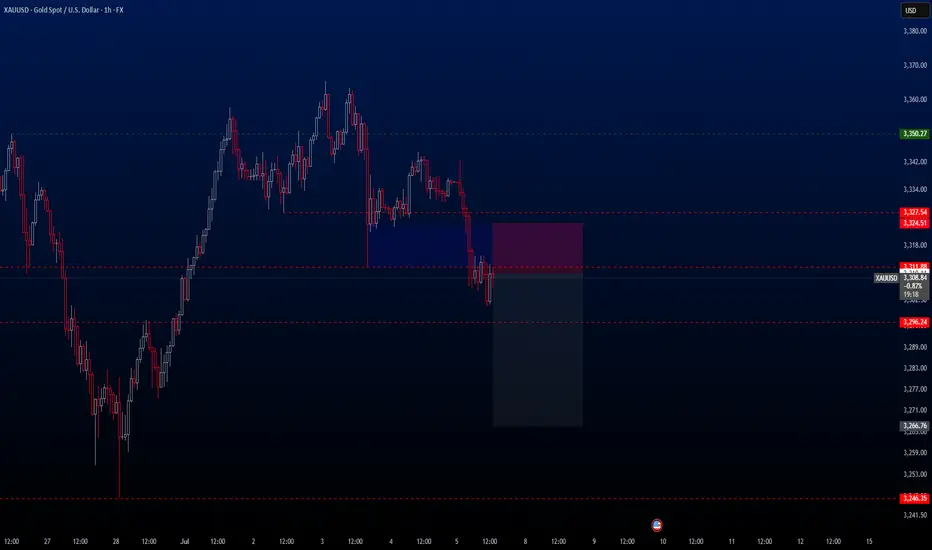
XAUUSD – Fresh Bearish Setup After TP HitWelcome to Velatrix Capital.
Last week’s short position on Gold has just hit Take Profit.
Based on current structure and momentum, we remain bearish-biased and have already entered a fresh short trade from a key resistance level.
This setup aligns with our internal system’s confluence logic and is now active.
🔍 Trade Parameters
• Timeframe: 1H
• Direction: Sell
• Entry: 3310.11
• Take Profit: 3266.76
• Stop Loss: 3324.51
• Risk/Reward: 1:3
Note: This is not financial advice. This is a real trade taken by our team based on a structured, repeatable trading model.
Use it as insight. Not as instruction.
🔔 Follow Us
We don’t chase hype.
We build edge.
Follow for raw setups, structured strategies, and institutional-grade breakdowns.

XAUUSDHello traders,
The Gold trade I shared last week has just hit TP. Based on current market conditions, I believe gold may continue its downward movement for a while. Therefore, I’m still holding a bearish bias and have just activated a new sell trade, which I’d like to share with you as well.
🔍 Trade Details
✔️ Timeframe: 1-Hour (H1)
✔️ Risk-to-Reward Ratio: 1:3
✔️ Trade Direction: Sell
✔️ Entry Price: 3310.11
✔️ Take Profit: 3266.76
✔️ Stop Loss: 3324.51
🔔 Disclaimer: This is not financial advice. I’m simply sharing a trade I’ve taken based on my personal trading system, strictly for educational and illustrative purposes.
📌 Interested in a systematic, data-driven trading approach?
💡 Follow the page and turn on notifications to stay updated on future trade setups and advanced market insights.
Uptrend Resumes After BOS – Ready to Load LongsI am expecting price to continue higher after mitigation of this fractal 4hr demand zone. In 4hr Price has shifted the swing structure to bullish with strong momentum and now price has formed a another bullish continuation structure within the bullish leg imbalance zone. This is the very clean winning trade setup and has the higher probability. The closest target is the 4hr swing weak HH.

I want to to see gold drop bearish to 3245.560 lows This is not financial advice nor is it a signal but rather an idea that i want to see happen

Bollinger Bands: How to Stop Being a Slave to the Markets.Bollinger Bands are a technical analysis indicator widely used in trading to assess the volatility of a financial asset and anticipate price movements. Created in the 1980s by John Bollinger, they consist of three lines superimposed on the price chart:
The middle band: a simple moving average, generally calculated over 20 periods.
The upper band: the moving average to which two standard deviations are added.
The lower band: the moving average to which two standard deviations are subtracted.
These bands form a dynamic channel around the price, which widens during periods of high volatility and narrows when the market is calm. When a price touches or exceeds a band, it can signal an overbought or oversold situation, or a potential trend reversal or continuation, depending on the market context.
What are Bollinger Bands used for?
Measuring volatility: The wider the bands, the higher the volatility.
Identify dynamic support and resistance zones.
Detect market excesses: A price touching the upper or lower band may indicate a temporary excess.
Anticipate reversals or consolidations: A tightening of the bands often heralds an upcoming burst of volatility.
Why is the 2-hour time frame so widely used and relevant?
The 2-hour (H2) time frame (TU) is particularly popular with many traders for several reasons:
Perfect balance between noise and relevance: The H2 offers a compromise between very short time frames (often too noisy, generating many false signals) and long time frames (slower to react). This allows you to capture significant movements without being overwhelmed by minor fluctuations.
Suitable for swing trading and intraday trading: This TU allows you to hold a position for several hours or days, while maintaining good responsiveness to take advantage of intermediate trends.
Clearer reading of chart patterns: Technical patterns (triangles, double tops, Wolfe waves, etc.) are often clearer and more reliable on H2 than on shorter time frames, making decision-making easier.
Less stress, better time management: On H2, there's no need to constantly monitor screens. Monitoring every two hours is sufficient, which is ideal for active traders who don't want to be slaves to the market.
Statistical relevance: Numerous backtests show that technical signals (such as those from Bollinger Bands) are more robust and less prone to false signals on this intermediate time frame.
In summary, the 2-hour time frame is often considered "amazing" because it combines the precision of intraday trading with the reliability of swing trading, thus providing superior signals for most technical strategies, particularly those using Bollinger Bands.
To summarize
Bollinger Bands measure volatility and help identify overbought/oversold areas or potential reversals.
The 2-hour timeframe is highly valued because it filters out market noise while remaining sufficiently responsive, making it particularly useful for technical analysis and trading decision-making.

Price correction and re-increase in copper prices1.Growing Global Demand: Rising infrastructure projects and renewable energy initiatives (like EVs and energy storage systems) are boosting copper demand.
2.Supply Constraints: Declining reserves in major mines, production disruptions in key producers (e.g., Chile, Peru), and limited new investments are tightening supply.
3.Weaker USD: If the Fed cuts interest rates, a weaker US dollar (as copper is dollar-denominated) could push prices higher.
4.China’s Recovery: Economic stimulus in China (the world’s top copper consumer) is expected to drive stronger demand.
5.Inflation Hedge: Copper is seen as a hedge against inflation, attracting more investor inflows if global inflation persists.
Strong demand, tight supply, and supportive macro trends could drive copper prices upward in the coming months.
Sasha Charkhchian

US OILBullish move might continue on US OIL from our zone, can look for confirmation before entry and target Buyside.

Boeing: Potential Pullback Ahead, But Long-Term Growth IntactCurrent Price: $215.92
Direction: LONG
Targets:
- T1 = $222.00
- T2 = $227.00
Stop Levels:
- S1 = $209.00
- S2 = $193.00
**Wisdom of Professional Traders:**
This analysis synthesizes insights from thousands of professional traders and market experts, leveraging collective intelligence to identify high-probability trade setups. The wisdom of crowds principle suggests that aggregated market perspectives from experienced professionals often outperform individual forecasts, reducing cognitive biases and highlighting consensus opportunities in Boeing.
**Key Insights:**
Boeing is riding bullish momentum within the industrials sector, buoyed by global aerospace recovery post-pandemic. While the company’s fundamentals are strong, technical indicators suggest near-term overbought conditions, potentially signaling a pullback. Geopolitical risks, including trade tensions, may create volatility, but the recent U.S.-Vietnam trade deal could open new markets and drive future growth.
Investors should monitor resistance levels between $222 and $227 carefully, as breaking above these points could indicate further upside potential. Continued demand for defense aircraft and increasing global airline orders bolster Boeing’s medium to long-term prospects, making it a compelling equity in its sector.
**Recent Performance:**
Recent price movements indicate robust upside momentum in Boeing, fueled by sector-wide strength in industrials and rising demand for aerospace products. RSI and MACD have moved into cautionary territory, suggesting near-term consolidation or retracement. However, supportive factors like industrial recovery and increased government procurement have kept Boeing trending upward. The company’s stock remains closely tied to macroeconomic recovery themes, such as higher consumer airline bookings and renewed defense contracts.
**Expert Analysis:**
While overbought signals are emerging, experts widely agree on the bullish potential of Boeing’s stock in a medium to long-term timeframe. Resistance levels near $222 and $227 are critical—as they represent key inflection points for market sentiment. At the same time, some analysts have flagged short-term risks around geopolitical tensions affecting aerospace trade. A break above $227 could lead to further buying pressure, while staying above $209 ensures robust downside support.
**News Impact:**
The recent U.S.-Vietnam trade deal aligns Boeing with strategic expansion in Southeast Asia, potentially unlocking new long-term growth avenues. Despite broader geopolitical trade risks, analysts believe Boeing could leverage these relationships to drive international aerospace orders. Additionally, the industrial recovery and stronger-than-anticipated defense procurements have underscored positive near-term sentiment, providing substantial tailwinds. Investors are advised to consider this while navigating short-term fluctuations and long-term opportunities.
**Trading Recommendation:**
Given Boeing’s current trajectory and resistance levels, traders should consider taking LONG positions while monitoring stop-loss levels ($209 and $193) to manage downside risks. Breaking resistance near $222 and $227 would confirm bullish continuation. With strong fundamentals, promising international expansion opportunities, and sector-wide momentum, Boeing remains an attractive trade for medium to long-term gains. Risk management is paramount given near-term volatility concerns, but the overall outlook remains positive for growth-oriented investors.

Apple: Next Week’s Long Trade Opportunity with Upside PotentialCurrent Price: $213.55
Direction: LONG
Targets:
- T1 = $225
- T2 = $240
Stop Levels:
- S1 = $210
- S2 = $200
**Wisdom of Professional Traders:**
This analysis synthesizes insights from thousands of professional traders and market experts, leveraging collective intelligence to identify high-probability trade setups. The wisdom of crowds principle suggests that aggregated market perspectives from experienced professionals often outperform individual forecasts, reducing cognitive biases and highlighting consensus opportunities in Apple.
**Key Insights:**
Apple continues to lead the technology sector with sustained bullish momentum. Strong seasonal trends averaging 13.4% gains during July and August further underscore its upside potential. AI-driven product developments and its role in mega-cap leadership positions it for ongoing strength, though near-term overextension risks persist.
**Recent Performance:**
Apple gained 6% last week, spotlighting its dominance among mega-cap stocks as a leader of the broader tech rally. While the "Magnificent 7" stocks, including Nvidia and Tesla, showed mixed signals, Apple has preserved relative strength and upward momentum.
**Expert Analysis:**
Portfolio managers have expressed confidence in Apple as part of the "big three" tech stocks, favoring its innovation and operational strategies despite valuation concerns. The mixed sentiment, with mentions of potential put activity, suggests cautious optimism, but its breakout above $213 highlights stronger short-term opportunities.
**News Impact:**
Apple’s AI initiatives, such as outsourcing Siri's development, contribute positively to market sentiment. Additionally, anticipation of earnings season strength in late July adds weight to bullish strategies. As mega-cap stocks maintain leadership, Apple’s pivot into AI-driven innovation reinforces its critical role in technological advancement.
**Trading Recommendation:**
Based on robust performance trends, seasonal advantages, and a supportive macro backdrop, a LONG position on Apple offers strong upside potential with defined risk parameters.

Caterpillar's Bullish Momentum Points to Extended GainsCurrent Price: $397.86
Direction: LONG
Targets:
- T1 = $407.80
- T2 = $415.75
Stop Levels:
- S1 = $390.50
- S2 = $384.00
**Wisdom of Professional Traders:**
This analysis synthesizes insights from thousands of professional traders and market experts, leveraging collective intelligence to identify high-probability trade setups. The wisdom of crowds principle suggests that aggregated market perspectives from experienced professionals often outperform individual forecasts, reducing cognitive biases and highlighting consensus opportunities in Caterpillar.
**Key Insights:**
Caterpillar continues to benefit from strong tailwinds in global infrastructure investments, particularly in developed nations seeking economic revitalization through construction and public works projects. The company's focus on innovating within heavy machinery, including more environmentally sustainable equipment, enhances its long-term appeal and positions it well against industry competitors. Additionally, technical signals show that the asset remains steadily above key support levels, reinforcing the bullish outlook.
**Recent Performance:**
Caterpillar has demonstrated consistent resilience, outperforming broader market indices in recent weeks. The stock price has increased by approximately 6% in the last month, driven by robust quarterly earnings and positive forward guidance. This indicates healthy investor sentiment and confidence in Caterpillar's ability to navigate current market conditions, including inflationary pressures and energy price fluctuations.
**Expert Analysis:**
Industry analysts continue to assign high price targets for Caterpillar, citing its leadership in the heavy equipment and machinery sector as a significant competitive advantage. The diversification of its product line and its ability to capture market share in emerging markets bolsters its projected growth. Caterpillar's commitment to innovation in both machinery and operational efficiency has attracted long-term investors, solidifying the stock as a popular pick for capital appreciation.
**News Impact:**
Recent announcements regarding Caterpillar's expansion efforts into emerging markets and increased government contracts for infrastructure-related equipment have ignited optimism among investors. Additionally, favorable macroeconomic developments, such as global spending on infrastructure projects, have acted as a tailwind, further amplifying expectations of continued strong performance.
**Trading Recommendation:**
Given its resilience, favorable macroeconomic setup, and technical strength, Caterpillar offers an attractive opportunity for long positions. Investors should consider the outlined targets and stops for entry points, keeping in mind the ongoing positive sentiment and bullish factors driving the asset forward. This trade setup provides a high-probability scenario to capture extended gains in the heavy machinery sector.

Costco: Strong Membership Model Suggests Bullish Upside Current Price: $987.02
Direction: LONG
Targets:
- T1 = $1,016.00
- T2 = $1,032.00
Stop Levels:
- S1 = $957.00
- S2 = $940.00
**Wisdom of Professional Traders:**
This analysis synthesizes insights from thousands of professional traders and market experts, leveraging collective intelligence to identify high-probability trade setups. The wisdom of crowds principle suggests that aggregated market perspectives from experienced professionals often outperform individual forecasts, reducing cognitive biases and highlighting consensus opportunities in Costco.
**Key Insights:**
Costco's membership-driven model continues to thrive in a challenging economic climate, characterized by inflationary pressures and uncertain economic outlooks. Consumers are increasingly drawn to the value and cost-saving advantages offered through bulk purchases and exclusive benefits. This positions Costco as a defensive retail stock, appealing to investors seeking stability in turbulent markets. Furthermore, its strong customer loyalty and ability to generate predictable revenue streams make it attractive during periods when discretionary spending tightens.
Costco is also leveraging technology, particularly trends like AI, to streamline operations and improve supply chain efficiency. This strategic use of innovative tools ensures competitive pricing, mitigates potential supply issues, and enhances profit margins. Traders should keep a watchful eye on how these advancements influence quarterly results and broader investor sentiment.
**Recent Performance:**
Costco has been trading near historical highs, delivering resilience even amid broader economic challenges. At $987.02, the stock exhibits strong momentum, supported by favorable financial metrics such as consistent revenue growth and a growing membership base. This performance reflects the company's robust fundamentals and its ability to thrive despite macroeconomic headwinds.
**Expert Analysis:**
Industry analysts are largely bullish on Costco due to its distinct positioning in the retail sector. Unlike many peers, Costco benefits from a focus on essential goods and services, making it less vulnerable to sudden changes in spending patterns. Experts are optimistic about its pricing power, scale advantages, and ability to expand margins through operational innovation, which together enhance its growth trajectory. While some external risks such as rising interest rates and energy costs persist, Costco's defensive characteristics provide substantial protection against volatility in the broader market.
**News Impact:**
Recent economic data points to tightening discretionary spending, which works in Costco's favor given its focus on essential goods. Inflationary conditions further amplify the appeal of the company's bulk purchasing model, while its ability to control operational costs protects margins even in less favorable environments. Meanwhile, ongoing global supply chain concerns and trade tariffs could create modest headwinds, but Costco's scale and efficiency offset these risks to a significant extent.
**Trading Recommendation:**
Costco's strong fundamentals and consistent growth make it an attractive candidate for a long position. The stock demonstrates stable demand and earnings resilience, even in challenging economic environments, backed by its membership model and operational innovations. The outlined price targets offer an excellent risk-reward ratio, with upside expected from continued execution success and strategic initiatives. Investors seeking defensive growth should consider entering long positions at current levels.

Crude Oil: Key Breakout Levels Suggest Bullish MomentumCurrent Price: $65.81
Direction: LONG
Targets:
- T1 = $67.45
- T2 = $69.30
Stop Levels:
- S1 = $64.20
- S2 = $62.50
**Wisdom of Professional Traders:**
This analysis synthesizes insights from thousands of professional traders and market experts, leveraging collective intelligence to identify high-probability trade setups. The wisdom of crowds principle suggests that aggregated market perspectives from experienced professionals often outperform individual forecasts, reducing cognitive biases and highlighting consensus opportunities in Crude Oil.
**Key Insights:**
Crude Oil is showing signals of a potential recovery after recent bearish movements. Technical indicators such as the Relative Strength Index (RSI) and Moving Average Convergence Divergence (MACD) demonstrate bullish divergence, suggesting upward momentum could be on the horizon. Additionally, easing geopolitical tensions may stabilize global energy markets, fostering an environment for prices to rally. Supply adjustments by OPEC+ members and ongoing production data are crucial elements to monitor, given their direct impact on crude oil price action.
**Recent Performance:**
In recent sessions, crude oil has seen a rebound following a sharp sell-off. Prices have ranged within a consolidation zone near $65. Global factors, including inflation risks and geopolitical concerns, pressured prices downward before entering a stabilization phase. This recovery is supported by improved market sentiment and reduced volatility linked to energy commodities.
**Expert Analysis:**
Market watchers have noted mixed signals in Crude Oil’s technical chart patterns, where support levels around $64 have held firmly against downward pressure. Some analysts forecast a breakout above $67 in the short term, potentially targeting the $69 range if conditions remain favorable. Factors like increased demand expectations from Asia and continued OPEC+ discipline reinforce bullish sentiment. Conversely, traders should watch for unexpected supply shocks or policy changes that could challenge upward movement.
**News Impact:**
Recent geopolitical developments, particularly reduced tensions in key oil-producing regions, have positively impacted global crude prices. Additionally, expectations of further interest rate moderation by major economies may aid crude oil’s price trajectory by reducing recession risks. The U.S.'s strategic push for renewable energy has had mixed implications for hydrocarbon demand in the short term, underpinning crude oil prices in global markets.
**Trading Recommendation:**
Given current technical setups and improving fundamentals, taking a bullish position on Crude Oil offers a promising opportunity. Key support levels suggest limited downside risk, while near-term targets provide a favorable risk-reward ratio. Traders should focus on the $67.45 mark as an initial upside pivot, with extended gains anticipated at $69.30 under strengthened bullish conditions.
