Dow Jones: Bullish Momentum Suggests Strong Upside Potential Current Price: $44828.53
Direction: LONG
Targets:
- T1 = $45550
- T2 = $46300
Stop Levels:
- S1 = $44350
- S2 = $44000
**Wisdom of Professional Traders:**
This analysis synthesizes insights from thousands of professional traders and market experts, leveraging collective intelligence to identify high-probability trade setups. The wisdom of crowds principle suggests that aggregated market perspectives from experienced professionals often outperform individual forecasts, reducing cognitive biases and highlighting consensus opportunities in Dow Jones.
**Key Insights:**
The Dow Jones Industrial Average demonstrates bullish momentum, supported by trading above significant moving averages such as the 50-day SMA and 200-day SMA. Optimism is further fueled by signs of easing inflation and resilience in the labor market. Healthcare and technology sectors are contributing to the bullish outlook, with recent buying activity indicating opportunities for further price growth. However, traders should monitor the key support level at 42,000, as a potential break below this might trigger bearish reversals. Geopolitical risks and global macroeconomic challenges remain potential headwinds but seem subdued for now.
**Recent Performance:**
Over the past few weeks, the Dow has shown steady growth, closing in on prior resistance levels near $45000. Compared to the S&P 500 and NASDAQ, gains have been more measured, reflecting rotation into defensive sectors amid broader market consolidation. The Russell 2000's outperformance suggests increased confidence across smaller-cap stocks, hinting at overall market strength. Volatility indicators suggest low levels, supporting sustained bullish sentiment, although profit-taking risks may emerge during market consolidation phases.
**Expert Analysis:**
Market experts highlight that a continuation of the bullish trend depends on breaking above the $45000 resistance level on sustained volume. This could serve as confirmation of further upward momentum toward the stated price targets. Analysts also stress the importance of holding above the $44400 level, which is a key short-term support, as failing to maintain this level could lead to retracement scenarios. Technical patterns such as upward channels and Fibonacci levels signal further growth potential, while Elliott Wave frameworks suggest the Dow is in an impulsive bullish wave pattern.
**News Impact:**
Recent inflation data, including Core PCE readings, implies that pressures are moderating, which bolsters confidence in equities. Additionally, strong corporate earnings from major players such as Nvidia and Apple contribute to positive sentiment in the technology-heavy components of the Dow. However, ongoing concerns related to geopolitical tensions and tariff adjustments remain risks that could derail short-term bullish prospects.
**Trading Recommendation:**
Based on current momentum, professional insights, and a favorable macroeconomic backdrop, taking a LONG position on the Dow Jones at current prices presents a high-probability opportunity. Ensure rigorous risk management through predefined stop levels at $44350 and $44000, while aiming for price targets of $45550 and $46300, respectively. Close monitoring of upcoming economic reports and geopolitical developments will be crucial to navigating potential market volatility.
Beyond Technical Analysis

Ethereum: Potential for Long Trend as Bulls Eye Key Levels Current Price: $2581.17
Direction: LONG
Targets:
- T1 = $2645
- T2 = $2710
Stop Levels:
- S1 = $2530
- S2 = $2480
**Wisdom of Professional Traders:**
This analysis synthesizes insights from thousands of professional traders and market experts, leveraging collective intelligence to identify high-probability trade setups. The wisdom of crowds principle suggests that aggregated market perspectives from experienced professionals often outperform individual forecasts, reducing cognitive biases and highlighting consensus opportunities in Ethereum.
**Key Insights:**
Ethereum has shown signs of resilience and stability despite broader market volatility. Professional traders are favoring Ethereum as a potential long opportunity based on its consolidation at key support levels. Bullish divergence has been noticed in its relative strength index (RSI) and trading volume, indicating that sellers are starting to exhaust themselves while buyers gradually regain control. This sets the stage for a potential upward breakout in the coming days.
Moreover, Ethereum’s dominance in the digital asset space continues to benefit from the expanding use of decentralized applications (dApps) and smart contracts, which solidify the outlook for continued adoption and innovation. Long-term sentiment remains positive, with Ethereum receiving accumulating interest from institutional investors.
**Recent Performance:**
Ethereum recently held firm at $2580 despite testing lower support levels near $2500 in volatile trading sessions. Its ability to close above significant levels repeatedly demonstrates strong relative momentum compared to other cryptocurrencies. Over the last week, Ethereum has gained 4.5%, outperforming Bitcoin and other altcoins in the same period. This resilience has attracted renewed attention from both short-term swing traders and long-term holders.
**Expert Analysis:**
Technical analysts highlight Ethereum's symmetrical triangle formation over the past three weeks, which traditionally signals a breakout potential. Coupled with increasing accumulation volume, Ethereum seems poised to test resistance around $2645 in the next trading sessions. Should momentum sustain, secondary resistance near $2710 is realistic. However, traders should keep an eye on fundamental factors such as total market capitalization trends and external economic indicators, which may trigger unexpected volatility.
Moreover, Ethereum's scalability developments through upgrades such as "The Merge" to Ethereum 2.0 have bolstered its long-term outlook. Analysts remain optimistic about Ethereum's role as a cornerstone for decentralized finance (DeFi) and web3 technologies.
**News Impact:**
Recent reports of institutional accumulation—particularly from asset management firms—highlight growing confidence in Ethereum as a diversified investment vehicle. Moreover, Ethereum's sustained relevance in the transition to proof-of-stake (PoS) reinforces its strategic positioning. The cryptocurrency market has shown relative resilience amid equity market dips, and Ethereum's eco-friendly upgrades are being well-received in global markets. This news underpins Ethereum's current bullish setup.
**Trading Recommendation:**
Based on technical, fundamental, and sentiment analyses, Ethereum appears to be a strong candidate for a long position. Its consolidation above support levels, combined with bullish technical setups, signals potential upside in the near term. Traders should use disciplined stop losses, with S1 at $2530 and S2 at $2480, for risk management. Upside targets of $2645 (T1) and $2710 (T2) provide strong risk-reward opportunities. Ethereum's robust ecosystem and accumulating investor interest affirm its value as a long-term and speculative asset.

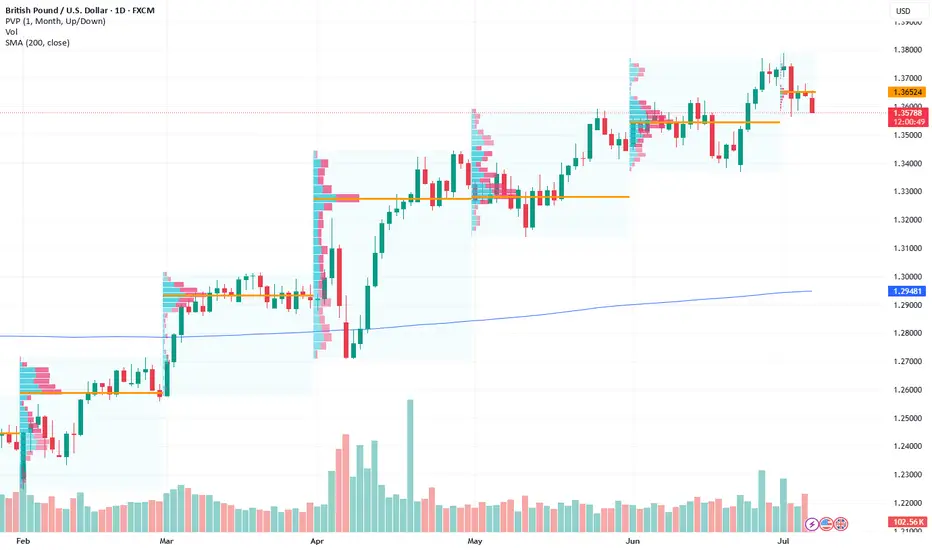
GBP/USD Analysis: Short Opportunity Amid Bearish Sentiment Current Price: $1.36282
Direction: SHORT
Targets:
- T1 = $1.3550
- T2 = $1.3485
Stop Levels:
- S1 = $1.3660
- S2 = $1.3723
**Wisdom of Professional Traders:**
This analysis synthesizes insights from thousands of professional traders and market experts, leveraging collective intelligence to identify high-probability trade setups. The wisdom of crowds principle suggests that aggregated market perspectives from experienced professionals often outperform individual forecasts, reducing cognitive biases and highlighting consensus opportunities in GBPUSD.
**Key Insights:**
Bearish sentiment dominates GBP/USD amid declining momentum and weak macroeconomic indicators. Recent price action highlights sellers' control over the market, with structural patterns backing further downside potential. Risk-averse behavior is amplifying the US Dollar's recent recovery, contributing to weakness in GBP/USD. The currency pair faces prominent support levels, which, if broken, could accelerate selling pressure.
Both the technical and fundamental setups are consistent with a bearish view in the short term. The current bearish flag pattern aligns with broader expectations for dollar strength and UK economic soft patches, increasing the likelihood of downward movement. Confirmation signals should be awaited before active trades.
**Recent Performance:**
GBP/USD recently struggled to sustain bullish momentum after encountering strong resistance at $1.3723. A subsequent retracement to $1.3553 underscores persistent selling pressure. The pair’s inability to establish higher highs further supports the bearish outlook. Despite minor rebounds, GBP/USD has remained trapped in a descending pattern over the past two weeks.
**Expert Analysis:**
Market analysts have largely aligned on a bearish stance for GBP/USD due to ongoing monetary policy divergence between the UK and the US, coupled with weak UK macroeconomic developments. Several key technical indicators, including MACD and RSI, reflect bearish conditions, while chart patterns point to sustained weakness. Additionally, resistance levels near $1.3660 serve as critical areas where sellers can re-enter positions, further targeting new lows.
**News Impact:**
News surrounding the US Dollar Index signals bullishness for USD amid safe-haven flows, reinforcing the bearish outlook for GBP/USD. Moreover, the UK's upcoming GDP data release later this week could serve as a major catalyst, particularly if the data fails to meet expectations. Weak UK data could cement the bearish trend and accelerate downward price movement, while positive surprises could mitigate losses and prompt short-term rebounds.
**Trading Recommendation:**
Based on market sentiment, technical setups, and fundamental drivers, traders should consider short positions in GBP/USD. Key stop-loss levels are placed above short-term resistance zones to safeguard against sudden reversals, while price targets aim to capitalize on further weakening amid bearish macroeconomic conditions. Vigilance around news releases and confirmation signals is advised to refine risk management strategies.
Silver's Key Support Holds: Bullish Target at $39.20 Near TermCurrent Price: $37.12
Direction: LONG
Targets:
- T1 = $38.50
- T2 = $39.20
Stop Levels:
- S1 = $36.60
- S2 = $36.20
**Wisdom of Professional Traders:**
This analysis synthesizes insights from thousands of professional traders and market experts, leveraging collective intelligence to identify high-probability trade setups. The wisdom of crowds principle suggests that aggregated market perspectives from experienced professionals often outperform individual forecasts, reducing cognitive biases and highlighting consensus opportunities in Silver.
**Key Insights:**
Silver has shown resilience at its current levels, supported by increased industrial demand and heightened investor interest due to inflationary concerns. The metal remains strongly positioned as a hedge against macroeconomic uncertainties, including currency devaluations and geopolitical tensions. Technical indicators show a consolidation phase near the $37 range, presenting an upside potential if momentum persists. Key support levels around $36.60 strengthen the case for bullish sentiment, while upside resistance near $38.50 may be tested soon.
**Recent Performance:**
Over the last few weeks, Silver has experienced steady growth with a notable 5% climb from the $35 price zone. Despite minor retracements triggered by short-term profit-taking, strong underlying demand has consistently pushed prices back above critical levels. This performance highlights growing optimism for commodities in general, as traders eye Silver's historic role as a safe-haven asset during times of economic uncertainty.
**Expert Analysis:**
Market experts point to bullish patterns forming on Silver's daily charts, with its relative strength index (RSI) hinting at further upward movement. The convergence of moving averages signifies medium-term bullish strength, bolstered by increasing net longs in futures contracts. Experts also cite expanding industrial applications of Silver, especially in renewable energy technologies and electric vehicles, enhancing its demand profile in the long run.
**News Impact:**
Recent inflation-linked announcements have bolstered Silver's appeal as an investment hedge, while budget allocations in renewable energy initiatives signal supply-chain expansions for Silver usage. Additionally, the Federal Reserve's cautious stance on rate hikes has maintained supportive conditions for precious metals, which thrive in lower interest rate environments. These factors contribute positively to Silver's price outlook.
**Trading Recommendation:**
Traders seeking exposure to safe-haven assets or hedges against economic uncertainty may consider taking a long position on Silver. With critical support levels holding firm and a favorable demand backdrop, the metal offers a robust upside potential toward the $39.20 resistance in the near term. Placing stops below $36.20 can help mitigate downside risks, allowing traders to capitalize on this promising setup.

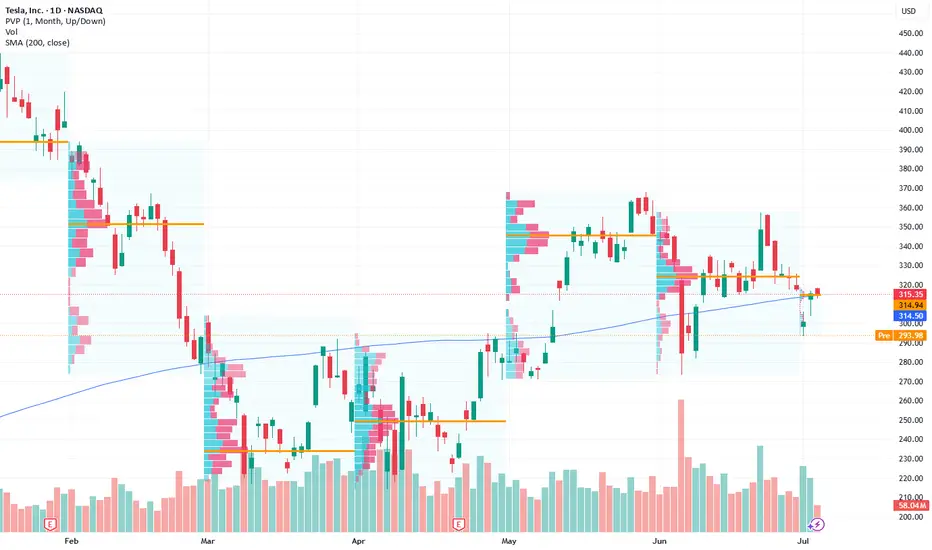
Tesla: Ticking Higher on Consolidation Breakout Potential
Current Price: $315.35
Direction: LONG
Targets:
- T1 = $322
- T2 = $330
Stop Levels:
- S1 = $310
- S2 = $305
**Wisdom of Professional Traders:**
This analysis synthesizes insights from thousands of professional traders and market experts, leveraging collective intelligence to identify high-probability trade setups. The wisdom of crowds principle suggests that aggregated market perspectives from experienced professionals often outperform individual forecasts, reducing cognitive biases and highlighting consensus opportunities in Tesla.
**Key Insights:**
Tesla’s stock has been consolidating within a narrow range of $305–$320, reflecting investors' cautious optimism ahead of potential catalysts. Technical resistance at $322 is acting as a key breakout point that could open the path to higher price levels. The bullish sentiment is fueled by improving production efficiencies, ongoing expansion in international markets, and Elon Musk’s ambition to transform Tesla into a broader technology conglomerate. However, concerns surrounding increasing competition in the EV market and potential headwinds from regulatory changes remain significant risks.
**Recent Performance:**
Tesla’s recent price action has showcased volatility while maintaining key support levels around $301.11. The stock has demonstrated resilience, holding firm during tech sector corrections. Over the past month, Tesla has seen short-term rallies driven by positive speculation about its EV lineup, alongside broader optimistic movement in the S&P 500. Investors have stayed engaged, with trading volumes suggesting sustained interest despite external pressures.
**Expert Analysis:**
Market experts underscore $322 as a critical resistance level that serves as the decision point for renewed momentum. The stock's recent consolidation pattern signals a possible breakout, assuming macroeconomic conditions remain favorable. Analysts have also cautioned about rising competition from other EV manufacturers like BYD, which intensifies pressure on Tesla's pricing strategy and market share. Nevertheless, Tesla’s ambitious pipeline, including autonomous driving technologies, remains a significant source of long-term investor confidence.
**News Impact:**
Tesla’s near-term outlook is influenced by competing factors. On one hand, reports of a lower-cost EV could dramatically increase its addressable market, while ongoing advances in AI and battery technologies enhance the company’s competitive edge. On the other hand, upcoming expiration of federal EV tax credits and increasing geopolitical scrutiny over Musk’s public statements may weigh on investor sentiment. Despite this, news of expanded production capabilities in Gigafactory Nevada has bolstered optimism regarding Tesla’s capacity to scale effectively.
**Trading Recommendation:**
Taking a long position in Tesla appears favorable as price action signals bullish momentum within its established range. The short-term trade targets $322 followed by $330, with stop-loss levels placed at $310 and $305 to manage downside risk. Traders are advised to monitor any developments in macroeconomic conditions and competitive activity, which remain key influences on price trajectory.
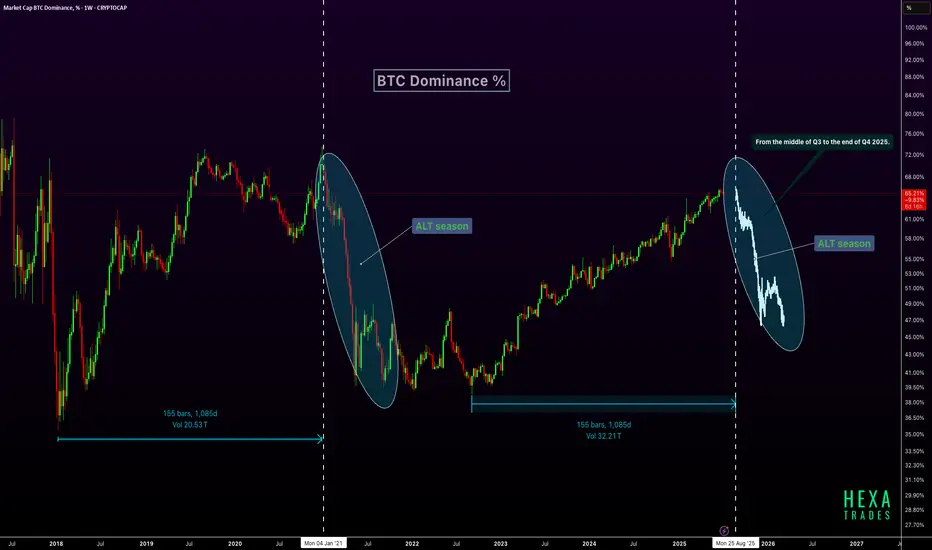
Altseason Ahead? BTC Dominance Cycle RepeatsBTC dominance is forming a pattern similar to the 2021 cycle, where dominance peaked after a long uptrend and then sharply declined, triggering a major altseason. Interestingly, that drop occurred after a 1,085-day rise, a time span we are once again approaching in 2025, projected to end around late August. If history repeats, BTC dominance could start declining from mid-Q3 2025, leading into a strong altcoin rally that may last through the end of Q4. This setup aligns with typical post-halving behavior, suggesting the final phase of the cycle could heavily favor altcoins.
CRYPTOCAP:BTC CRYPTOCAP:ETH CRYPTOCAP:XRP
"Euro vs Kiwi Heist - Bullish Loot Opportunity!🔥 EURNZD BULL HEIST! Euro vs Kiwi Raid Plan (Swing/Day) 🚨💰
🌟 Attention, Market Bandits! 🌟
"The vault is cracked—time to grab the loot!"
🔮 Thief’s Intel (TA + FA):
EURNZD is flashing BULLISH signals, but beware—overbought traps & police (bears) lurk near resistance!
🎯 ENTRY POINTS (Where to Strike!)
🟢 LONG RAID (Bullish Thieves):
"Swipe the loot on pullbacks!"
Buy limit orders (15-30min TF) near swing lows/highs.
Aggressive heist? Enter any price—but watch for traps!
🛑 STOP-LOSS (Escape Plan)
📍 SL at recent swing low (2H TF) = 1.93500 (Adjust based on risk!)
💰 TAKE-PROFIT (Cash Out Before Cops Arrive!)
🎯 TP = 1.98500 (Or escape early near red zones!)
⚠️ WARNING: Police (Bears) Ahead!
Overbought + Consolidation = Reversal risk!
News = High alert! Avoid new trades during volatility.
Trailing SL = Your getaway car!
📡 FUNDAMENTAL BACKUP (Why This Heist Works)
Bullish momentum from COT data, macro trends & sentiment.
Check full analysis for targets & intermarket clues!
💥 BOOST THIS HEIST! 💥
Like & Share to strengthen our crew! More alerts = More profits!
🚨 Next raid coming soon… Stay tuned, thieves! 🚨

AUDCAD – Bearish Setup Following Retracement to Key ResistanceWelcome to Velatrix Capital.
Below is a live market opportunity identified by our internal trading desk.
This is not financial advice. It’s a data-backed, logic-driven trading edge. Use it with discipline — or don’t use it at all.
🧠 Technical Outlook
AUDCAD is currently showing bullish momentum on the lower timeframes, approaching a key resistance zone between 0.89057 – 0.89272.
Our trading desk expects price to reach this supply zone and then present a short-selling opportunity with favorable risk/reward potential.
We advise waiting patiently for the price to enter this key range before initiating any short trades.
Trade Parameters:
• Timeframe: 1H
• Direction: Sell
• Entry Zone: 0.89272 – 0.89057
• Stop Loss (SL): 0.89386
• Take Profit 1 (TP1): 0.88458
• Take Profit 2 (TP2): 0.87954
• Risk/Reward (R/R): 1:2 / 1:4.80
Note: Setup is invalidated if price breaks and closes above 0.89386.
🔔 Follow Us
This is just the surface.
For more setups, clean breakdowns, and performance-driven content:
📌 Follow, engage, and stay sharp. Our edge is real — and it’s public.
We don’t chase hype. We build edge.

EURUSD Technical Outlook – StarseedFX Market InsightPrice has just confirmed a new higher high on the H4 timeframe, sweeping liquidity above the most recent bullish candle and then closing below its low with a strong bearish body.
After a brief retracement upward, price failed to break the previous higher high. This suggests the possible formation of a supply zone, but it is still too early to consider short positions.
If price breaches 1.17460 without breaking above the most recent higher high, this would confirm an ABCD pattern within the premium zone. If that setup completes, I will begin looking for bearish confirmation on lower timeframes, particularly M5, which I am currently focused on.
My short-term target would be the recent buy zone around 1.16375.
Keep in mind that the market moves in waves. We may see several pullbacks, minor changes of character, or even full structural shifts on lower timeframes. This technical setup remains in development and will require confirmation as price action evolves.
Stay patient. Let the structure speak.
StarseedFX

Threat or Catalyst? Impact of MasOrange IPO on TelefonicaThreat or Catalyst? Impact of the Upcoming MasOrange IPO on Telefónica
By Ion Jauregui – Analyst at ActivTrades
The potential IPO of MasOrange, valued between €5.37 and €9.44 billion based on applied EV/EBITDA multiples (ranging from 7x to 8.4x), could significantly reshape the competitive landscape of Spain’s telecommunications sector. The new entity, formed by the merger of MásMóvil and Orange Spain, aims to capitalize on a market that is once again showing appetite for new public listings. But what impact could this operation have on Telefónica?
The Return of a Real Threat in the Domestic Market
MasOrange is not just another telecom operator. With a leading customer share in Spain, an already deployed fiber optic network, and EBITDA margins above the industry average (37.9%), it is emerging as a highly efficient competitor. Although it carries a high net debt (€14.11 billion), it benefits from projected synergies of €500 million by 2027, which could justify a premium valuation versus other operators. Furthermore, the potential entry of a new partner into its shared fiber subsidiary with Vodafone—valued at up to €10 billion—could unlock capital, reduce leverage, and increase the appeal of its upcoming IPO.
For Telefónica, this represents added pressure in its most strategic market: Spain. While the company diversifies across Latin America, Germany, and the UK, its domestic market remains key for cash flow generation. A well-capitalized, listed MasOrange could intensify price competition, compress margins, and pressure Telefónica's local profitability.
Fundamental Analysis of Telefónica: Financial Stabilization Amid Structural Challenges
Telefónica has achieved progressive financial stabilization in recent years after a period marked by high debt and structural revenue pressure in mature markets. As of Q1 2025, the company reported the following key figures:
Revenue: €10.15 billion (+1.1% YoY), driven by growth in Germany and Brazil.
OIBDA: €3.20 billion, with a margin of 31.5%.
Net financial debt: €26.3 billion, improved from €27.48 billion at year-end 2023.
Net profit: €509 million (+9.6% YoY).
Telefónica has strengthened its financial profile through the sale of non-core assets and the rotation of infrastructure, such as towers and data centers. This has helped reduce debt and improve ROCE. It has also maintained an attractive dividend policy, with a €0.30 cash dividend per share for 2025, offering a yield close to 6.5% at current prices.
By region, Brazil and Germany continue to perform well, while Spain remains a mature, low-growth market characterized by high competition and regulatory pressure. In this context, the entry of a more efficient, fiber-leveraged MasOrange could negatively impact margins and market share in Spain.
Telefónica is investing in digital transformation, artificial intelligence, and 5G network deployment, although these efforts have yet to translate into double-digit revenue growth. The company also maintains a strategic alliance with the Spanish government (SEPI), which now holds over 10% of its capital—a potential source of stability amid possible corporate moves in the sector.
Technical Analysis: Bearish Pressure
Telefónica shares are currently trading at €4.56 as of Monday’s open, down -0.13% from Friday’s session. The stock appears to have lost momentum from the recent quarterly earnings release and has entered a sideways phase. Nevertheless, its long-term uptrend remains intact. Since the golden cross on April 14, the 50-day moving average continues to expand above the 100- and 200-day averages. The price is currently supported by the 50-day moving average.
The RSI shows slight overbought conditions at 56.32%, while the MACD suggests a weakening trend accompanied by a bell curve pointing to a control level around €4.08. As long as the current support at €4.43 holds, we may see a push to test the recent high of €4.628. However, if this momentum lacks strength, the price could retest the support zone, and a break below it could lead to a pullback with €4.43 as the first potential stopping point.
Conclusion
MasOrange's return to the stock market reshapes the playing field. For Telefónica, the risk lies not so much in the newcomer’s valuation, but in its operational efficiency, fiber advantage, and renewed investment capacity. While Telefónica remains a global reference in telecom, this move could force the company to accelerate its transformation and defend its share in its most mature and competitive market.
*******************************************************************************************
The information provided does not constitute investment research. The material has not been prepared in accordance with the legal requirements designed to promote the independence of investment research and such should be considered a marketing communication.
All information has been prepared by ActivTrades ("AT"). The information does not contain a record of AT's prices, or an offer of or solicitation for a transaction in any financial instrument. No representation or warranty is given as to the accuracy or completeness of this information.
Any material provided does not have regard to the specific investment objective and financial situation of any person who may receive it. Past performance is not reliable indicator of future performance. AT provides an execution-only service. Consequently, any person acting on the information provided does so at their own risk.

Market ViewWatch
Trade
Manage
Smile
@New-day, breath and appreciate the life taking the right call of decision backed with action. You got the control, take charge.

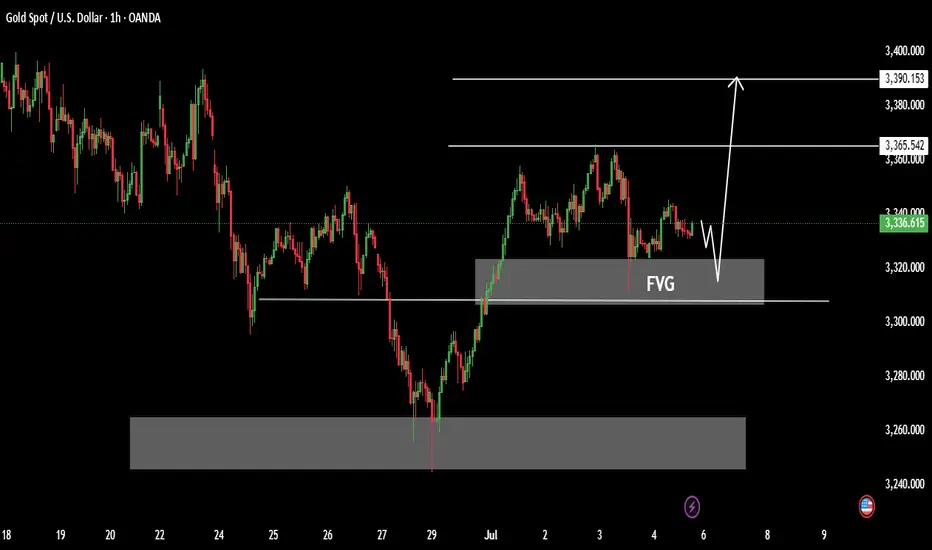
XAUUSD – High-Precision Sell Setup with 1:2.70 R/RGreetings, traders.
After a brief tactical pause, we’ve identified a **high-conviction short setup** on **XAUUSD**.
Despite the U.S. Independence Day holiday, structural momentum suggests there’s still room for meaningful movement in gold during today’s session. The risk-to-reward profile on this setup is exceptional — clocking in at **1:8.70**, it meets our highest-tier execution standards.
If momentum stalls or price consolidates excessively, the trade will be manually closed by **23:00 (UTC+4)**, regardless of outcome.
🧠 Trade Parameters:
• **Timeframe:** 1-Hour (H1)
• **Direction:** Sell
• **Entry:** 3337.09
• **Take Profit:** 3312.16
• **Stop Loss:** 3345.63
• **Risk/Reward Ratio:** 1:2,70
• **Trade Management Note:** Will be closed manually by 23:00 (UTC+4) if momentum conditions are not met.
🔗 Signal Source
All trade setups are published directly by Velatrix Capital — a high-discipline trading desk focused on FX, crypto, and global indices.
No opinions. No hype. Just statistically-grounded execution.
All signals are posted via our TradingView desk:
👉 (www.tradingview.com)
📈 **We don’t chase hype. We build edge.**
🔔 **Subscribe for future setups and institutional-grade trade intelligence.**
**Velatrix Capital**

Are You Really Analyzing Or Just Defending your imagination? You might think you're analyzing every time you open a chart.
But what if you're just looking for reasons to justify a bad trade?
Real analysis is data-based. Justification is emotion-based.
Let’s figure out if you're really trading smart or just lying to yourself.
Hello✌
Spend 3 minutes ⏰ reading this educational material.
🎯 Analytical Insight on Bitcoin:
BINANCE:BTCUSDT is currently testing a strong resistance near the upper boundary of its parallel channel. A breakout to the upside looks likely soon. From this level, I expect at least a 5% gain, with a main target around $114,500. 📈🚀
Now , let's dive into the educational section,
🎯 Analysis or Mental Justification?
Many traders, once they’re in a position, stop looking for truth and start looking for confirmation.
Instead of reading what the chart actually says, they twist every line and indicator to make it look like their trade still makes sense even when it doesn’t.
🛠 TradingView Tools That Kill Self-Deception
TradingView is way more than just a place to slap on some EMAs and MACDs. If used right, it can literally stop you from fooling yourself:
Replay Tool – Use this to backtest without future data bias. It trains your brain to analyze based only on the present moment.
Multi-Timeframe Layouts – View your idea across multiple timeframes. Confirmation bias collapses fast when you see the same chart from different angles.
Volume Profile – This shows where real trading happens, not where you wish it would happen.
Community Scripts & Public Indicators – Looking at someone else's logic helps you catch your own blind spots.
Idea Journal & Posts – Publish your analysis and compare it with what actually happened. You’ll quickly see how often emotion was driving your trade.
😵💫 What Does Justification Even Look Like?
It’s when you’re deep in the red but instead of managing your loss, you draw a new trendline… or add a reversed Fibonacci… or tell yourself, “It’s just a correction.”
That’s not analysis. That’s emotional defense.
💡 Know the Real Difference
Analysis = data-driven, emotion-free.
Justification = emotion-driven, data-twisted.
🔂 Why Do You Keep Making the Same Mistake?
Because your brain loves to feel right even when it's wrong.
Instead of accepting reality, it tries to bend it.
So you dig for signals to support your bad position, not question it.
🧠 The Psychology Behind the Trap
What you’re feeling is cognitive dissonance. Two thoughts fighting in your head:
“This position is failing.”
“I don’t want to be wrong.”
So your brain builds fake reasons to stay in it. Welcome to the mental loop that kills portfolios.
🎯 How To Break the Cycle
Write down why you’re entering any trade before you open it.
Only trade what you can explain, not what you hope.
Decide your stop-loss level before you enter.
If you’re “hoping” for something to turn around, it probably won’t.
🪞Be Brutally Honest With Yourself
The real question isn’t “Can you analyze?”
It’s “Can you admit you were wrong when it matters?”
Every losing trade you hold onto out of ego is a reminder that you chose comfort over skill.
⚠️ What Makes a Pro Trader?
A pro doesn’t just win trades. They cut losses fast.
They don’t “marry” a position just because they drew a trendline.
They survive by respecting truth, not bending it.
🧪 Train Your Brain To See Reality
To break the habit of self-justification, you need to rewire your analysis process. Here's how:
Before analyzing a chart, review your previous trade honestly.
Ask: What made me enter? Strategy or emotion?
Replay the chart with TradingView’s tool. If you didn’t know the future, would you still take that trade?
Answer those questions and you'll start separating real analysis from self-defense.
👁 Look at the Chart Without Bias
If you’re holding a position while analyzing, you’re probably just looking for evidence to stay in.
Try this instead: Pick a timeframe where you have no position, and do a clean analysis.
No hope. No fear. No money on the line.
That’s when real analysis happens.
🔚 Final Note
Real analysis hurts because it forces you to face mistakes. But it's also the path to real consistency.
Next time you open a chart, ask yourself:
“Am I seeking the truth or just a reason to hold on?”
One moment of honesty can change your entire trading journey.
✨ Need a little love!
We put so much love and time into bringing you useful content & your support truly keeps us going. don’t be shy—drop a comment below. We’d love to hear from you! 💛
Big thanks , Mad Whale 🐋
📜Please remember to do your own research before making any investment decisions. Also, don’t forget to check the disclaimer at the bottom of each post for more details.

XAUUSD Gold Weekly solid Bullish zone Gold weekly Forecast lets see how the price will plays out open and see and send your feedback about Gold.
After the breaking Price could catch there support after pull back top but last week on Friday due to the low volume price could not move Highly Gold stabilized after correction after the falling weekly from 3366 Gold price found demand again in Asia on Friday but US Budgets risk due to the holiday could increase,
Technically Price range in last week 3357 to 311 there is important level and Bullish zone,
Resistance zone 3365 / 3390
Support Levels 3325 /. 3311
it is important situation for you traders to use trade long-term hope you can find more details in the chart POs Support with like and comments for more analysis.
Bitcoin will Return all-time high Interestingly Bitcoin (BTC) has not been particularly impressive over the weekend, which has been a somewhat consistent theme of the cryptocurrency market so far in the year 2025. The premier cryptocurrency continues to hover around the $108,000 mark, showing signs of indecision amongst the investors.
Resistance zone 111K
Support zone 107K
The conversation has been about when the Bitcoin price will return to its all-time high. Interestingly, the latest on-chain data shows that investors are becoming increasingly confident in the long-term promise of the flagship cryptocurrency.
Hope you can understand all our chart Pattern According the Bitcoin analysis.
Thanks for your Support.
if you found this analysis share you Opinion in comments I'm Tankful from you.

Moodeng Set to Drop 33% with Target at 0.12500 SoonHello,✌
let’s dive into a full analysis of the upcoming price potential for Moodeng 🔍📈.
OKX:MOODENGUSDT is currently approaching the upper boundary of a strong descending channel, aligned with a significant daily resistance level. Given this setup, a correction of at least 33% appears likely, with the main target near 0.12500. Traders should watch for confirmation before entering positions. ⚠️📉
✨ Need a little love!
We pour love into every post your support keeps us inspired! 💛 Don’t be shy, we’d love to hear from you on comments. Big thanks , Mad Whale 🐋

CelesTIA, All-Time Low Last Month, Trend Change—2025 Bull MarketI am showing multiple charts but my prediction is that the market will turn—the entire Cryptocurrency market—the altcoins market will turn bullish.
CelesTIA
There is an uptrend between late 2023 and early 2024, the same with the rest of the market. There was also a bullish wave late 2024. Huhhh, there will be an uptrend in late 2025 and early 2026.
Ok. Celestia. TIAUSDT.
It is easy to distinguish the downtrend vs no more downtrend.
The period drawn orange did produce lower lows but it is very different compared to the "downtrend," red on the chart.
So this is the transition. Strong down, then sideways, then up.
This pair is producing lower lows in its consolidation period but I also showed you many pairs that are producing higher lows, it makes no difference. Lower lows or higher lows, the action is very different compared to the "downtrend." The downtrend is no more.
My thesis concludes with a change of trend. This is where everything is leading, hundreds and hundreds of charts, more than 500 since 7-April. They all say the same.
In short, these hundreds of charts are saying that the market is about to become extremely bullish and that is something that we welcome with open arms. Actually, we have been waiting patiently, and some not so patiently, for this change to occur.
Many trust me; trusted me;
Many doubted me and that is also ok.
I love the truster and the doubter...
I love the reader and the follower...
I love TradingView and the Cryptocurrency market; but I will be proven right in the end.
I accept the fact that it is impossible to get it always right. I accept the fact that many times I am so, so very wrong.
You have to accept the fact that time is running out, Crypto is going up.
Celestia just hit a new all-time low and this is awesome news for me and for you, because, from this bottom low we will grow. You can mark these words... Just watch!
I would like to take just a few seconds of your time to say, thank you. Time is precious, and you took the time to read this long. If you enjoy the content, make sure to follow.
Thanks a lot for your continued support.
There is only one Cryptocurrency market, this is us.
It is you and me, it is all of us. It is not the whales or the exchanges. We are the whales and the exchanges. We are the government, the institutions, the programmers, the designers; the owners, the planners, the coders, the security expert, the writer, the reporter, the auditor; the professor, the mom, the father and the son. You are the market. You are it. You are the whole thing, the whole world.
You might think yourself unimportant as just a tiny ray of light, but there is no life without the sun. You being light, you permeate everything that exist around us. So you are the Cryptocurrency market. You are Bitcoin and you are the altcoins.
Namaste.

Rain or Ruin? Analyzing Wheat Prices During Precip Extremes1. Introduction: When Rain Means Risk for Wheat Traders
Rain is life for wheat crops—until it isn’t. In the world of agriculture, water is essential, but extremes in precipitation can cause just as much harm as droughts. For traders in the wheat futures market, understanding this relationship between rainfall and price action is not just useful—it’s essential.
Wheat is a crop with a long growth cycle, grown across diverse geographies like the U.S. Plains, the Canadian Prairies, Russia, and Ukraine. Each region has its own precipitation rhythm, and any disruption can ripple through the global supply chain. The question is: can weather signals—especially rainfall—be used to predict market behavior?
This article dives into that question using a data-driven lens. We categorized precipitation data and measured how wheat futures returns responded to different rainfall environments. The results? Revealing, and at times, counterintuitive.
2. The Role of Rainfall in Wheat Production
Wheat, especially spring and winter varieties, is particularly sensitive to soil moisture levels at key phases like germination, tillering, and heading. Too little rain in early development and the crop can fail to establish. Too much rain close to harvest? Risk of disease, sprouting, and quality degradation.
Traders have long known that unexpected wet or dry weeks can trigger speculative surges or hedging activity. But how do these events influence actual futures returns?
Before answering that, we need to translate rain into something traders can use: categories based on historical norms.
3. Methodology: Categorizing Rainfall and Measuring Market Response
To understand how wheat prices respond to different levels of rainfall, we analyzed weekly precipitation data across global wheat-producing regions. We normalized the data using percentiles:
Low Precipitation: Below the 25th percentile
Normal Precipitation: Between the 25th and 75th percentiles
High Precipitation: Above the 75th percentile
We then matched this categorized weather data with weekly returns from wheat futures (symbol: ZW) to explore if price behavior systematically varied depending on how wet or dry a week had been.
To test significance, we used a simple t-test comparing the mean returns of low-precip and high-precip weeks. The p-value (6.995E-06) revealed a compelling result: yes, there is a statistically significant difference.
4. Results: High Rainfall, Higher Price Volatility
The data confirms that weeks with extreme rainfall—especially those with high precipitation—often align with more volatile wheat price movements.
But here’s the twist: while low-precip weeks didn’t consistently show bullish returns, high-precip weeks correlated with negative or erratic returns. That makes sense when you think about harvest delays, rot, and declining grain quality.
Traders watching forecasts for excessive rainfall should consider the implications for grain availability and price stabilization mechanisms. This is where speculative plays or hedging via options and standard or micro futures contracts can become especially useful.
5. Interpreting the Volatility: Why the Market Reacts to Rain
Why does excessive rain lead to such uneven price behavior?
The answer lies in uncertainty. Heavy rainfall often introduces multiple variables into the equation: planting delays, logistical bottlenecks, and downgraded wheat quality due to fungal infections. For example, a wet harvest can reduce protein content, pushing millers to seek alternatives—altering both demand and supply expectations simultaneously.
This dual-sided pressure—reduced high-quality yield and uncertain export capability—tends to shake market confidence. Traders respond not just to the supply data but also to how much trust they place in the supply pipeline itself.
6. Futures Contracts: Navigating Risk with Position Size Control
Traders looking to participate in wheat price action have two main CME-listed options:
Standard Wheat Futures (ZW)
Contract Size: 5,000 bushels
Tick Size: 1/4 cent per bushel (0.0025) has a $12.50 per tick impact
Margin Requirement: Approx. $1,700 (subject to change)
Micro Wheat Futures (MZW)
Contract Size: 500 bushels (1/10th the size of the standard contract)
Tick Size: 0.0050 per bushel has a $2.50 per tick impact
Margin Requirement: Approx. $170 (subject to change)
Micro contracts like MZW offer a lower-cost, lower-risk way to trade wheat volatility—perfect for sizing into weather-related trades with precision or managing risk in a more granular fashion. Many traders use these contracts to test strategies during seasonal transitions or while responding to forecast-driven setups.
7. Visual Evidence: Price Behavior by Precipitation Category
To visually represent our findings, we used box plots to show wheat weekly returns grouped by precipitation category:
The shape of these distributions is revealing. High-precipitation weeks not only show lower average returns but also a wider range of possible outcomes—underscoring the role that rainfall extremes play in price volatility rather than just directional bias.
We are also complementing this visual with a weather map that shows real-time precipitation patterns in major wheat-growing regions. This could help traders align weather anomalies with trading opportunities.
8. Final Thoughts: The Forecast Beyond Forecasts
Precipitation isn’t just an agricultural concern—it’s a market catalyst.
Our analysis shows that rainfall extremes, particularly heavy rain, create meaningful signals for wheat traders. The price response is less about direction and more about uncertainty and volatility, which is equally important when structuring trades.
If you’re serious about trading wheat futures, don’t just watch the charts—watch the clouds.
This article is one piece in our broader series on how weather influences ag futures. Stay tuned for the next one, where we continue to decode the atmosphere’s impact on the markets.
When charting futures, the data provided could be delayed. Traders working with the ticker symbols discussed in this idea may prefer to use CME Group real-time data plan on TradingView: www.tradingview.com - This consideration is particularly important for shorter-term traders, whereas it may be less critical for those focused on longer-term trading strategies.
General Disclaimer:
The trade ideas presented herein are solely for illustrative purposes forming a part of a case study intended to demonstrate key principles in risk management within the context of the specific market scenarios discussed. These ideas are not to be interpreted as investment recommendations or financial advice. They do not endorse or promote any specific trading strategies, financial products, or services. The information provided is based on data believed to be reliable; however, its accuracy or completeness cannot be guaranteed. Trading in financial markets involves risks, including the potential loss of principal. Each individual should conduct their own research and consult with professional financial advisors before making any investment decisions. The author or publisher of this content bears no responsibility for any actions taken based on the information provided or for any resultant financial or other losses.

Framing a scalp.. ICT style.. The R2F way..In this short video I go through how I personally frame a trade using ICT concepts. We have the opportunity to see it pan out pretty quickly, which is always a nice thing.
- R2F Trading

Decisive Week: Duties, Oil and Flight from the Dollar
Hello, I am Forex trader Andrea Russo and today I want to talk to you about the week full of tensions and opportunities in global currency markets. The new tariff threats from the United States, the strategic moves of OPEC + and the growing instability in the British government bond market are shaking up the entire Forex landscape, with direct implications on USD, AUD, CAD, GBP and JPY. I thank in advance the Official Broker Partner PEPPERSTONE for the support in the creation of this article.
The most explosive news concerns the possible imposition of new duties by the United States, with a deadline set for July 9. The American administration, according to Reuters sources, is ready to activate tariffs of up to 70% on some categories of strategic imports if new bilateral agreements are not signed by the end of the month. The market has reacted cautiously, but signs of systemic risk are starting to filter through: US futures are falling, capital is moving into safe havens, and the dollar is starting to lose ground structurally.
The decline in oil has added further pressure. OPEC+ announced the start of an increase in production from August, with about 550 thousand barrels per day more than the current level. This has hit Brent and WTI hard, which are now both below $68. Currencies that are highly correlated to commodities, such as CAD and NOK, are weakening, especially in the absence of a monetary response from their respective central banks.
Meanwhile, the UK is facing a delicate moment. Yields on 10-year gilts have risen to their highest since April, with a sell-off that has forced the Bank of England to review the pace of its asset disposal. The instability of the British debt is putting pressure on the pound, already tested by inflation that is struggling to recover and a stagnant housing market. The GBP/USD pair remains extremely volatile, while EUR/GBP is moving sideways waiting for a clearer direction.
But the star of the week is Australia. The AUD has scored the eighth consecutive week of gains, taking advantage of both the weakness of the dollar and the expectations of a more gradual future rate cut by the RBA. The AUD/USD cross has broken the highs of November 2024 and is now targeting levels of 0.67-0.68. The same goes for NZD/USD, which is also in a phase of bullish consolidation. The US dollar, on the other hand, has recorded its worst start to the year since 1973: a combination of political uncertainty, fiscal instability and falling confidence is eroding global demand for the USD, pushing many managers to diversify into emerging or commodity-linked currencies.
Finally, the Federal Reserve is taking its time. Powell stated that the path of rates will be closely linked to the evolution of trade tensions. The Fed, therefore, appears more wait-and-see than expected, postponing a possible cut to the third quarter. This leaves the dollar exposed to downward pressure, especially if inflation were to slow further in the meantime.
In summary, this week offers extremely interesting scenarios for Forex traders. Institutional flows seem to favor alternative currencies to the dollar, while sentiment remains fragile on GBP and CAD. AUD, NZD and JPY emerge as potential winners, at least until new macro developments or significant technical breaks.
The watchword is: selection. With volatility on the rise and the geopolitical context rapidly evolving, only those who know how to read the movements of central banks and institutions in advance will be able to take full advantage of the opportunities offered by the markets.

You MUST BUILD CONFLUENCE and learn how to read CANDLES!!!All the information you need to find a high probability trade are in front of you on the charts so build your trading decisions on 'the facts' of the chart NOT what you think or what you want to happen or even what you heard will happen. If you have enough facts telling you to trade in a certain direction and therefore enough confluence to take a trade, then this is how you will gain consistency in you trading and build confidence. Check out my trade idea!!
www.tradingview.com

FED: less than 5% probability of a rate cut on July 301) The US labor market remains resilient according to the latest NFP report, which is good news for the macro-economic situation
The US labor market demonstrated its resilience last week, making a rate cut by the FED on Wednesday July 30 unlikely: the unemployment rate fell to 4.1% of the labor force, after several months of stability around 4.2%. This drop in unemployment suggests that, despite two years of monetary tightening and current macro-economic uncertainties, the US economy continues to show resilience in its ability to create jobs. This is good news for economic growth, but it delays the FED's next rate cut.
By clicking on the link below, you can reread our S&P 500 analysis proposed following the latest NFP report update last Thursday.
2) The probability of a rate cut on July 30 reduced to almost zero, barring any huge surprises between now and then on inflation, employment or trade diplomacy
Up until now, most investors were expecting an earlier decision, as early as July 30, at the next meeting of the Monetary Policy Committee. But cautious communication from Fed officials tempered these expectations. Jerome Powell and several governors reiterated that they would wait for “sustainable” evidence of a return of inflation to the 2% target before committing themselves. The fall in the unemployment rate to 4.1% introduces a nuance: it confirms that the economy is not contracting sharply, allowing the Fed to wait a few more weeks without taking the risk of slowing growth more than necessary. At the same time, the latest consumer confidence indicators and manufacturing activity data suggest a gentle slowdown, closer to a controlled landing than a halt.
Note that this week's Wednesday July 9 deadline for trade agreements will reveal more about the future impact of tariffs on inflation, and this will further alter the FED's monetary policy expectations. When these lines are written, the probability of a FED pivot on July 30 is less than 5%.
3) Here are the fundamental dates that will be decisive between now and the FED's monetary choice on Wednesday July 30
Wednesday July 9: the current deadline for trade diplomacy between the USA and its main trading partners. The final amount of tariffs will be decisive for US inflation expectations.
Tuesday July 15: US CPI inflation , the last major US inflation figure to be updated before the FED's monetary policy decision on July 30.
Initial and ongoing weekly US jobless claims are published on the Thursday of each week and will have an impact on the likelihood of the FED's action on July 30, but only marginally.
Barring exceptional events, it is therefore unlikely that the FED will resume cutting the federal funds rate on July 30.
The next PCE and NFP are due after the FED (July 31 and August 1) and will therefore have an impact on the FED's monetary policy decision on September 17.
DISCLAIMER:
This content is intended for individuals who are familiar with financial markets and instruments and is for information purposes only. The presented idea (including market commentary, market data and observations) is not a work product of any research department of Swissquote or its affiliates. This material is intended to highlight market action and does not constitute investment, legal or tax advice. If you are a retail investor or lack experience in trading complex financial products, it is advisable to seek professional advice from licensed advisor before making any financial decisions.
This content is not intended to manipulate the market or encourage any specific financial behavior.
Swissquote makes no representation or warranty as to the quality, completeness, accuracy, comprehensiveness or non-infringement of such content. The views expressed are those of the consultant and are provided for educational purposes only. Any information provided relating to a product or market should not be construed as recommending an investment strategy or transaction. Past performance is not a guarantee of future results.
Swissquote and its employees and representatives shall in no event be held liable for any damages or losses arising directly or indirectly from decisions made on the basis of this content.
The use of any third-party brands or trademarks is for information only and does not imply endorsement by Swissquote, or that the trademark owner has authorised Swissquote to promote its products or services.
Swissquote is the marketing brand for the activities of Swissquote Bank Ltd (Switzerland) regulated by FINMA, Swissquote Capital Markets Limited regulated by CySEC (Cyprus), Swissquote Bank Europe SA (Luxembourg) regulated by the CSSF, Swissquote Ltd (UK) regulated by the FCA, Swissquote Financial Services (Malta) Ltd regulated by the Malta Financial Services Authority, Swissquote MEA Ltd. (UAE) regulated by the Dubai Financial Services Authority, Swissquote Pte Ltd (Singapore) regulated by the Monetary Authority of Singapore, Swissquote Asia Limited (Hong Kong) licensed by the Hong Kong Securities and Futures Commission (SFC) and Swissquote South Africa (Pty) Ltd supervised by the FSCA.
Products and services of Swissquote are only intended for those permitted to receive them under local law.
All investments carry a degree of risk. The risk of loss in trading or holding financial instruments can be substantial. The value of financial instruments, including but not limited to stocks, bonds, cryptocurrencies, and other assets, can fluctuate both upwards and downwards. There is a significant risk of financial loss when buying, selling, holding, staking, or investing in these instruments. SQBE makes no recommendations regarding any specific investment, transaction, or the use of any particular investment strategy.
CFDs are complex instruments and come with a high risk of losing money rapidly due to leverage. The vast majority of retail client accounts suffer capital losses when trading in CFDs. You should consider whether you understand how CFDs work and whether you can afford to take the high risk of losing your money.
Digital Assets are unregulated in most countries and consumer protection rules may not apply. As highly volatile speculative investments, Digital Assets are not suitable for investors without a high-risk tolerance. Make sure you understand each Digital Asset before you trade.
Cryptocurrencies are not considered legal tender in some jurisdictions and are subject to regulatory uncertainties.
The use of Internet-based systems can involve high risks, including, but not limited to, fraud, cyber-attacks, network and communication failures, as well as identity theft and phishing attacks related to crypto-assets.

Howmet Aerospace: Navigating Geopolitics to New Heights?Howmet Aerospace (HWM) has emerged as a formidable player in the aerospace sector, demonstrating exceptional resilience and growth amidst global uncertainties. The company's robust performance, marked by record revenues and significant earnings per share increases, stems from dual tailwinds: surging demand in commercial aerospace and heightened global defense spending. Howmet's diversified portfolio, which includes advanced engine components, fasteners, and forged wheels, positions it uniquely to capitalize on these trends. Its strategic focus on lightweight, high-performance parts for fuel-efficient aircraft like the Boeing 787 and Airbus A320neo, alongside critical components for defense programs such as the F-35 fighter jet, underpins its premium market valuation and investor confidence.
The company's trajectory is deeply intertwined with the prevailing geopolitical landscape. Escalating international rivalries, particularly between the U.S. and China, coupled with regional conflicts, are driving an unprecedented surge in global military expenditures. European defense budgets are expanding significantly, fueled by the conflict in Ukraine and broader security concerns, leading to increased demand for advanced military hardware incorporating Howmet’s specialized components. Simultaneously, while commercial aviation navigates challenges like airspace restrictions and volatile fuel costs, the imperative for fuel-efficient aircraft, driven by both environmental regulations and economic realities, solidifies Howmet’s role in the industry’s strategic evolution.
Howmet's success also reflects its adept navigation of complex geostrategic challenges, including trade protectionism. The company has proactively addressed potential tariff impacts, demonstrating a capacity to mitigate risks through strategic clauses and renegotiation, thereby protecting its supply chain and operational efficiency. Despite its premium valuation, Howmet’s strong fundamentals, disciplined capital allocation, and commitment to shareholder returns highlight its financial health. The company's innovative solutions, crucial for enhancing the performance and cost-effectiveness of next-generation aircraft, solidify its integral position within the global aerospace and defense ecosystem, making it a compelling consideration for discerning investors.
