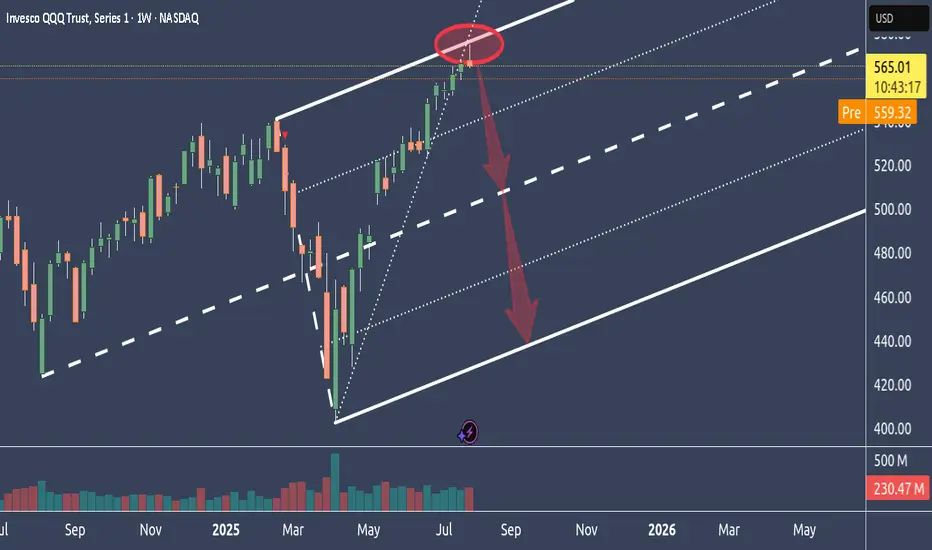
Why NQ is probably tanking big timeIn this weekly chart, we see QQQ, which represents the Nasdaq.
As we can see, it had a hell of a run up.
Too far too fast IMO, and it reached the stretch level at the Upper Medianline Parallel.
The natural move is now to let go, take a breath and trade down to center again, which is the Centerline.
After all the most major and most important earnings results are over, and Funds have pumped up their gains through manipulative Options plays, it's time to reap what they have planted and book the gains.
It's all in line with, all moves are at the point, and everything is showing in a simple chart.
Unless price is opening and closing outside of the U-MLH, it's time to load the Boat and sail to the South.
Beyond Technical Analysis
SUI | Spot Buy Zone for PullbackPrice has pulled back after a local top and is heading toward a clear demand zone.
Key buy area sits around $3.12, aligned with 0.618 retracement and recent consolidation.
Strong structure below—if majors keep retracing, this is where risk/reward for new spot buys becomes attractive.
Plan:
Waiting for price to reach the green zone to accumulate spot.
Invalidation below $2.80, targeting a move back toward $4.45 and higher if momentum returns.

Gold Showing Signs of Reversal After Hitting Key ResistanceHello Guys.
Gold has reached a major resistance zone around 3439–3425, which has already acted as a strong ceiling in the past. The price tapped into this area again, forming a clear divergence, and failed to break higher.
Here’s what stands out:
Divergence signals a weakening bullish momentum at the top.
The price rejected the resistance and is now breaking structure to the downside.
A minor pullback may occur before continuation, as shown in the projected moves.
First target: 3259.792
Second target (if support breaks): 3136.869, a deeper zone for potential bounce or further drop.
This setup hints at a bearish trend building up. Stay cautious on longs unless the price structure changes again.

US30 Robbery Blueprint: Breakout, Pullback, Escape Setup💎 Dow Jones Robbery Blueprint: The US30 Vault Crack Plan 💎
(Maximized for reach — within TradingView title limit)
🌟Hi! Hola! Ola! Bonjour! Hallo! Marhaba!🌟
Dear Market Robbers & Money Movers 🕵️♂️💰🚨
This ain't your average analysis — it’s a Thief Trader-style 🔥tactical mission🔥 aimed at the mighty "US30/DJI" (Dow Jones Industrial Average). We're talkin' about a precision heist with a full blueprint: entry zones, trap setups, and escape exits. Read carefully — this ain’t for the faint-hearted traders! 🧠🦾
🧠 Entry Zones (The Break-In) 📈
🛠 ENTRY 1: Crack the wall near 44700.00 – that’s the resistance gate. Wait for confirmation.
🎯 ENTRY 2: Sneak in at the Market Makers’ Trap around 43500.00 – a dirty zone where retailers get baited. Perfect time to strike long!
🧱 DCA/Layering strategy recommended. Stack those buy orders like a thief layering explosives on a safe. 💣💸
🛑 Risk Levels (Escape Routes/Stop Loss)
🔊 "Listen up, vault raiders! Never drop your SL until breakout is confirmed. If you jump early, you might land in a bear trap! 🪤"
🔐 Stop Zones (Based on Strategy):
📌 Swing Buy SL (2H TF): Place at 44100.00 for the stealth buy.
🏦 Institutional SL (Swing Zone): Drop it around 43000.00
🔐 Max Risk SL (3H TF): If you're deep, your last stand is at 39200.00
☝️ SL depends on your position sizing, number of entries, and risk appetite. Trade like a thief, not a gambler.
🎯 Heist Target (Profit Exit)
🏁 Escape Point: 46200.00 — or exit before heat rises! Don’t be greedy. Rob and vanish. 💨💰
🔥 Market Mood: Why the Heist Is On
"US30/DJI" is bullish AF — thanks to:
📊 Macro-Economic Wind at Our Back
📈 Institutional momentum
📰 Strong sentiment and intermarket flows
Check your chart radar: Fundamentals + technicals aligning = green light for robbery! 🟢
⚠️ Tactical Reminder: News Can Jam the Plan
📵 Avoid new entries during major economic releases
🛡 Use trailing SLs to protect running trades
Stay alert, stay alive. 💡
❤️ Support the Robbery Crew
Hit that 💥BOOST💥 — your love fuels our next mission.
Join us and ride daily heist plans with Thief Trading Style 🏴☠️🚀💰

PLTR Pressured at Key Support — Can $155 Hold? 8/1PLTR Pressured at Key Support — Can $155 Hold or Is a Break to $150 Next?
🔍 GEX & Options Flow Insight (1st Image Analysis)
PLTR has been sliding after failing to hold its $160+ range and is now testing the $155–156 gamma support. The GEX profile still shows moderate call dominance, but support is thin below this level, meaning a break could bring swift downside.
* Call Walls & Resistance:
* 📍 $160.14 → 2nd Call Wall (59.02% GEX)
* 📍 $161.44 → Gamma Wall / Highest positive NET GEX
* 📍 $162.50 → 3rd Call Wall resistance
* Put Walls & Support Zones:
* 🛡️ $155.94 → Current gamma pivot and support
* 🚨 $153.06–$154.91 → 2nd Put Wall & HVL zone — break here risks slide to $150
* 📉 $146.00 → 3rd Put Wall & major downside target
* Volatility Insight:
* IVR 36.1, IVx Avg 73 → Elevated volatility
* Call flow 37.5% → Still skewed bullish, but waning
* GEX sentiment: 🟢🟡🟢 = Cautiously bullish gamma positioning but losing ground
✅ Option Trading Suggestion:
Bias: Bearish if $156 fails; bullish recovery possible only above $160
Strategy: Bear put spread if $156 breaks
* Entry Idea: Buy 155P / Sell 150P (Aug 2 or Aug 9 expiry)
* Invalidation: Strong reclaim above $160
* Target: $153 → $150
Why this works: PLTR is nearing a key gamma inflection. Below $156, dealers may need to hedge by selling, fueling a sharper drop. Bulls need to defend this pivot.
🧠 Technical Analysis (1H Chart) (2nd Image Analysis)
Market Structure & SMC:
* 🟥 CHoCH confirmed after rejection at $160+
* ❌ Broke out of ascending structure to the downside
* Sitting just above prior BOS zone at $155
Trendline Dynamics:
* Broken short-term uptrend now acting as resistance
* Downward-sloping structure points toward $153–150 retest
SMC Zones:
* 🟩 Demand Zone: $155–$153 → Current defense area
* 🟥 Supply Zone (Purple Box): $160–$162.5 → Strong resistance cluster
🔄 Price Action & Key Levels
* Support:
* ✅ $155.94 → Gamma pivot / current defense
* ✅ $153.06–$154.91 → Last key support before major drop
* 🚨 $146.00 → Next downside target
* Resistance:
* 🚩 $160.14 → First upside target if bounce
* 🚩 $161.44–$162.50 → Gamma & call wall zone
🧭 Scalping / Intraday Trade Setup
🟥 Bearish Setup (Preferred):
* Entry: Breakdown under $156
* Target 1: $153.50
* Target 2: $150
* Stop: Above $158
🟩 Bullish Reversal Setup:
* Entry: Reclaim of $160 with volume
* Target 1: $161.44
* Target 2: $162.50
* Stop: Below $158
🔁 Summary Thoughts
* PLTR is at a critical gamma support level.
* A failure here brings a quick shot to $153–150.
* Bulls must defend $156 and reclaim $160 to flip structure back bullish.
* Options positioning still leans bullish but is weakening, meaning downside acceleration risk is real.
🚨 Disclaimer:
This analysis is for educational purposes only and does not constitute financial advice. Always do your own research and manage your risk accordingly.

AMZN - LONG Swing Entry PlanNASDAQ:AMZN - LONG Swing Entry Plan
Entry Zone 1: $220.00 – $217.00
→ Open initial position targeting +8% from entry level.
Entry Zone 2: $212.00 – $209.00
→ If price dips further, average down with a second equal-sized entry.
→ New target becomes +8% from the average of Entry 1 and Entry 2.
Edit Zone : $192.00 – $190.00
→ If reached, enter with double the initial size to lower the overall cost basis.
→ Profit target remains +8% from the new average across all three entries.
Risk Management:
Stop Loss:
Risk is capped at 12% below the average entry price (calculated across all executed positions including the Edit Zone).
Position Sizing Approach:
Entry 1: 1x
Entry 2: 1x
Edit Zone: 2x
→ Total exposure: 4x
→ Weighted average determines final TP and SL calculations.
______________________________________
Legal Disclaimer
The information provided in this content is intended for educational and informational purposes only and does not constitute financial, investment, or legal advice or recommendations of any kind. The provider of this content assumes no legal or financial responsibility for any investment decisions made based on this information. Users are strongly advised to conduct their own due diligence and consult with licensed financial advisors before making any financial or investment decisions.
Sharia Compliance Disclaimer: The provider makes no guarantees that the stocks or financial instruments mentioned herein comply with Islamic (Sharia) principles. It is the user’s responsibility to verify Sharia compliance, and consultation with a qualified Sharia advisor is strongly recommended before making any investment decisions

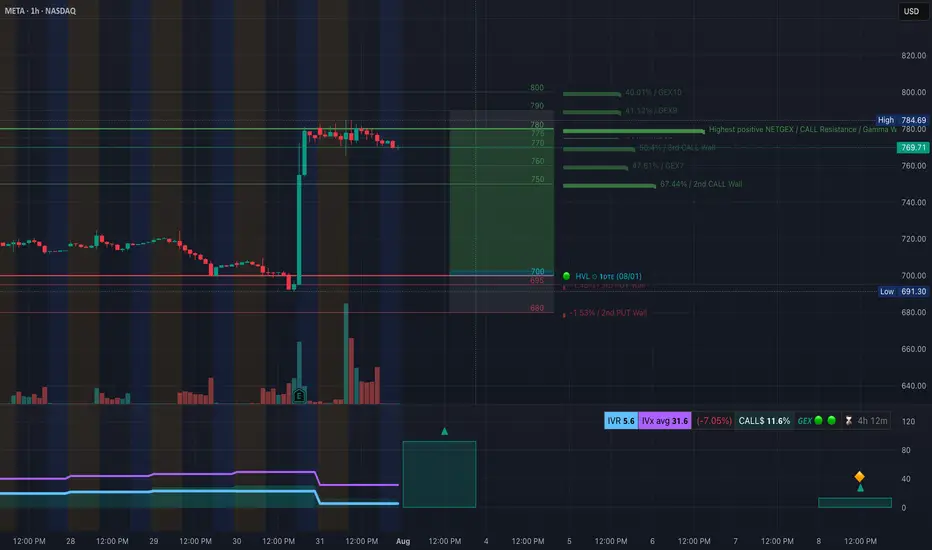
META’s Monster Gap — Gamma Ceiling. 8/1META’s Monster Gap — Gamma Ceiling at $785 or Room to Run Past $800?
🔍 GEX & Options Flow Insight (1st Image Analysis)
META ripped higher on earnings momentum, gapping from the $690s into the $770s, and is now stalling just under the Gamma Wall / Highest Positive NET GEX at $784.69. Options positioning shows bullish gamma support but overhead resistance could trigger a stall or pullback before another leg up.
* Call Walls & Resistance:
* 📍 $784.69 → Highest positive NET GEX / Gamma Wall
* 📍 $800.00 → GEX10 & GEX9 ceiling = ultimate squeeze target if momentum continues
* Put Support Zones:
* 🛡️ $750.00 → Key 2nd Call Wall zone now acting as gamma support
* 📉 $700.00 / $691.30 → HVL zone + hard put support
* 🚨 Breakdown below $691 opens the door to a deep retracement
* Volatility Insight:
* IVR 5.6, IVx Avg 31.6 → Low IV = cheaper premium for directional plays
* Call flow 11.6% = Not euphoric, but bullish sentiment
* GEX sentiment: 🟢🟢🟢 = Long gamma environment, supportive of dips
✅ Option Trading Suggestion:
Bias: Bullish but extended — watch for consolidation before breakout
Strategy: Debit call spread (protects from IV crush)
* Entry Idea: Buy 780C / Sell 800C for Aug 2 or Aug 9 expiry
* Invalidation: Breakdown under 750 with volume
* Target: 785 → 800 on continuation
Why this works: META is riding strong bullish gamma positioning. As long as it holds above $750, dealer hedging supports price. Break above $785 could trigger short gamma acceleration to $800. But extended after earnings, so controlled size is key.
🧠 Technical Analysis (1H Chart) (2nd Image Analysis)
Market Structure & SMC:
* ✅ BOS + CHoCH sequence with a massive impulsive move from liquidity grab under $700
* 📈 Price is currently in the supply zone (purple box $768–$784) from historical resistance alignment
* 📊 First consolidation post-gap — watching for either breakout or gap-fill attempts
Trendline Dynamics:
* Strong bullish breakout from long consolidation
* Price is riding the upper slope of a sharp post-gap channel
SMC Zones:
* 🟩 Demand / OB Zone: $750–$724 → Ideal dip buy zone if retested
* 🟥 Supply Zone (Purple Box): $768–$784 → Current battle zone
🔄 Price Action & Key Levels
* Support:
* ✅ $750 → Former resistance, now key support
* ✅ $724 → Fib retracement confluence
* 🚨 $700 / $691.30 → HVL & hard gamma put wall
* Resistance:
* 🚩 $784.69 → Gamma Wall + supply top
* 🧨 $800 → Ultimate squeeze ceiling
🧭 Scalping / Intraday Trade Setup
🟩 Bullish Setup:
* Entry: $770–$772 dip reclaim
* Target 1: $784.69
* Target 2: $800 extension
* Stop: Close under $750
🟥 Bearish Pullback Setup:
* Entry: Rejection at $784.69
* Target 1: $760
* Target 2: $750
* Stop: Breakout above $785
🔁 Summary Thoughts
* META just printed a post-earnings breakout that could keep running into $785–$800 if gamma fuel continues.
* First consolidation after the gap is critical — if bulls defend $750, breakout setups remain strong.
* Caution chasing highs; better reward/risk comes from pullback buys into $750–$760.
* Dealers are long gamma, which supports range-bound chop with bullish bias.
🚨 Disclaimer:
This analysis is for educational purposes only and does not constitute financial advice. Always do your own research and manage your risk accordingly.
104This channel is not providing individualized trading or investment advice, nor is it a banking service, brokerage service, trading service, investment service or money management service

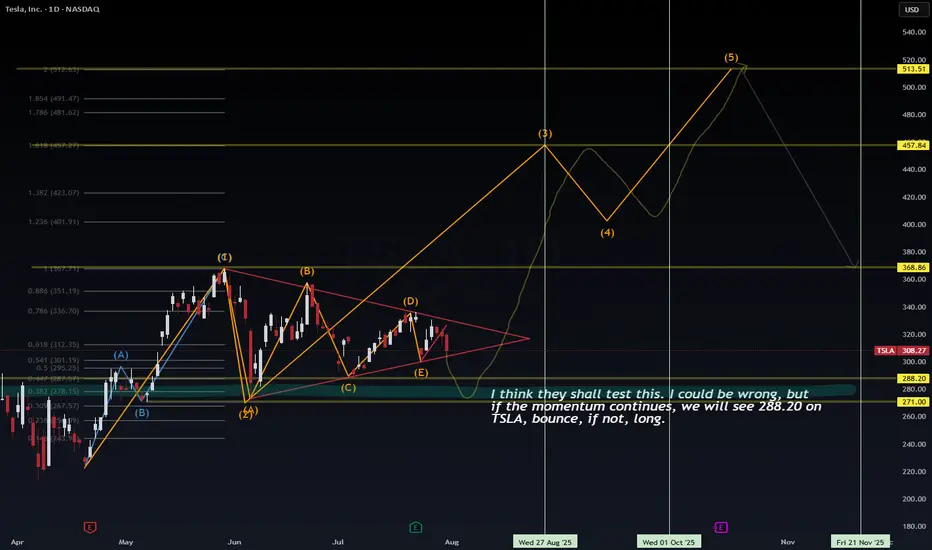
Tesla (TSLA) – VolanX Forecast: The Calm Before the Storm?📊 Tesla (TSLA) – VolanX Forecast: The Calm Before the Storm?
Wave structure analysis + liquidity map + roadmap to $513
🧩 The Story So Far – Compressed Potential
Tesla has spent the past three months inside a contracting triangle (ABCDE) — a classic Elliott Wave corrective pattern that signals energy compression before expansion. From the May high (Wave (1)), price has been coiling within tightening range boundaries, forming lower highs and higher lows. The triangle culminates with leg (E), now hovering near support.
🟠 VolanX flags this as a terminal wedge—an area where institutions test both sides of the book, hunting liquidity.
🌀 Wave Forecast – Impulse Awakening
If the triangle completes as expected, we enter Wave (3)—typically the most explosive wave in Elliott sequences.
Here's how the projected roadmap unfolds:
Wave (2) ends around $288.20–$271.00 (key demand/liquidity zone)
Wave (3) initiates from this springboard, aiming toward:
📈 1.0 Fib Extension at $367.71
📈 1.618 Extension at $457.84
Consolidation expected at that level forms Wave (4)
Final thrust into Wave (5) targets $513.51, aligning with extended Fib projection and historical order block
This sequence respects classical Elliott impulse structure: 5-wave motive into macro target zone.
🧪 Timing & Liquidity – Watch the Clock, Watch the Flow
🗓 Key Windows from chart verticals:
Aug 27–Sep 1, 2025: Liquidity test at $288.20 zone
Oct 1–15, 2025: Expansion toward Wave (3)
By mid-November 2025: Completion of Wave (5) → exhaustion at $513 zone before probable macro retracement
🔍 Liquidity Zones:
$288.20 – Institutional reaccumulation level (VolanX confirms large resting bids)
$271.00 – Final sweep zone. Break below would invalidate bullish count
Above, $336.70–$351.19 is the first liquidity magnet
Major stops above $457.84, then final cluster $513.51
🧠 VolanX Opinion – AI View on Risk & Opportunity
VolanX signals high-probability breakout setup, with confluence across:
Liquidity clusters
Fibonacci symmetry
Elliott sequencing
Gamma positioning (institutional hedging tilts long below $290)
📈 Current predictive bias: 68% probability of breakout from triangle resolving bullishly, conditional on $288 support holding.
If tested and respected, AI favors aggressive repositioning in long gamma, echoing historical TSLA breakout behavior.
📌 Strategy Summary:
“I think they shall test this… I could be wrong. But if momentum holds, $288.20 bounce is likely. If not, wait for structure to rebuild before long.”
🧭 Trade Setup (Not Financial Advice):
Watch zone: $288–271
Confirmation: Strong rejection wick + volume delta flip
Stop: Below $267.57
Targets: $367.71 → $457.84 → $513.51
🔻 Risk comes from invalidation below $271.
⚡ Reward stems from recognizing compression before expansion.
#TSLA #VolanX #ElliottWave #LiquiditySweep #WaveAnalysis #FibonacciLevels #SmartMoney #OptionsFlow #TeslaForecast #AITrading #WaverVanir
BABA: We have a bounce but is it temporary? Too many questions but dss forecasts a price growth near-term on ticker symbol $BABA. We will see where it goes. Another one on the watch is NASDAQ:PDD
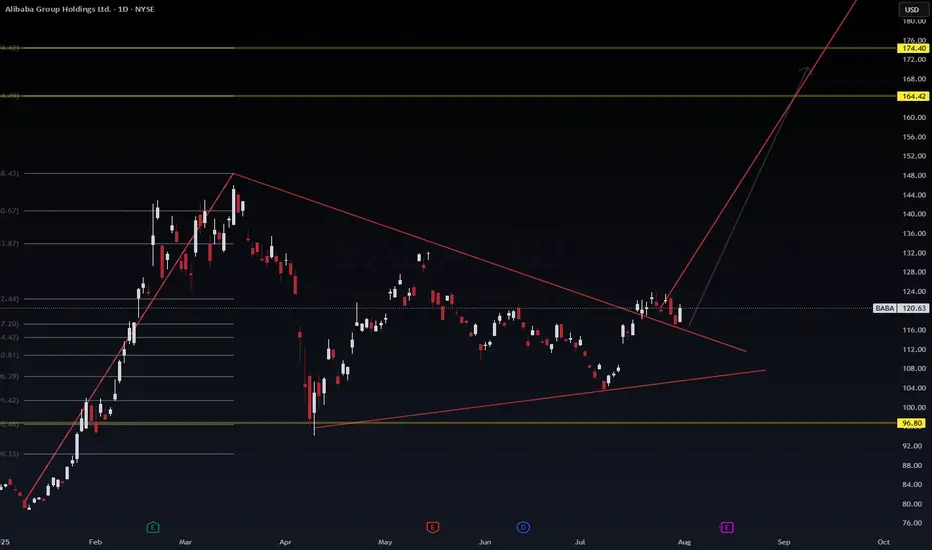
The key point to watch is whether it can rise to 3900.73-4107.80
Hello, traders. Nice to meet you.
If you "Follow," you'll always get the latest information quickly.
Have a great day.
-------------------------------------
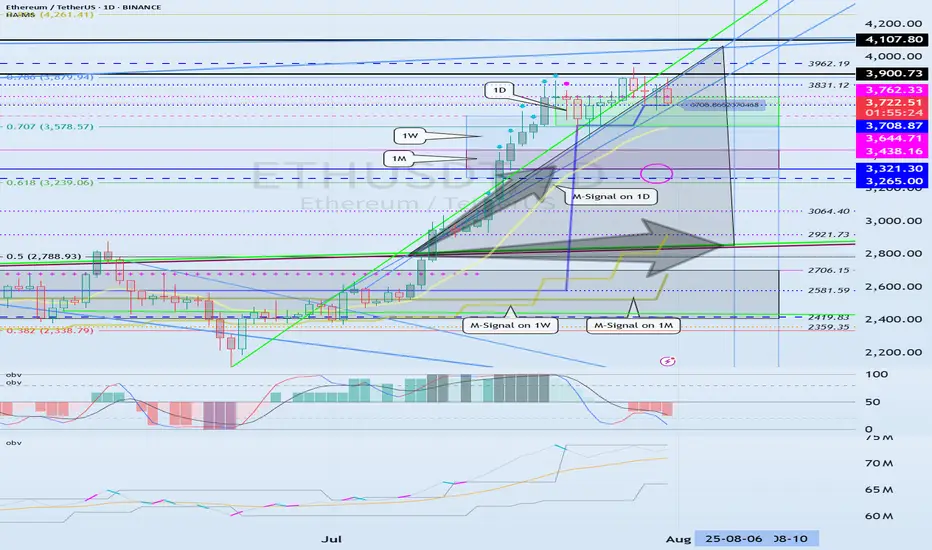
(ETHUSDT 1D Chart)
The upward trend continues, with the M-Signal on the 1D chart > M-Signal on the 1W chart > M-Signal on the 1M chart.
Therefore, if the price holds above 3265.0-3321.30, a medium- to long-term uptrend is likely.
Currently, the HA-High ~ DOM(60) range is formed across the 3265.0-3762.33 range on the 1M, 1W, and 1D charts.
Therefore, the key question is whether support is found within the 3265.0-3762.33 range.
-
While the price is trending upward along the short-term trendline, if it falls below the short-term trendline and encounters resistance by falling below the M-Signal indicator on the 1D chart, a decline to the 3265.0-3321.30 range is likely.
ETH's volatility period is expected to last from August 6th to 10th.
The key point to watch is whether it can rise above the 3900.73-4107.80 range after this volatility period.
-
Since the StochRSI indicator has entered an oversold zone, the downside is likely to be limited.
Since the OBV indicator of the Low Line ~ High Line channel remains OBV > OBVEMA, a significant decline is unlikely.
However, since the TC (Trend Check) indicator is below zero, selling pressure is dominant.
Therefore, a decline below 3708.87 could lead to further declines. However, as previously mentioned, the decline is likely to be limited, so a significant decline is not expected.
Once the M-Signal indicator on the 1D chart is encountered, the trend is expected to re-establish itself.
-
Thank you for reading to the end.
I wish you successful trading.
--------------------------------------------------
- This is an explanation of the big picture.
(3-year bull market, 1-year bear market pattern)
I will explain in more detail when the bear market begins.
------------------------------------------------------
Seeking the nearest Sell SideThe image speaks for itself
this is an ict concept idea and from experience work that I have done over 7yrs

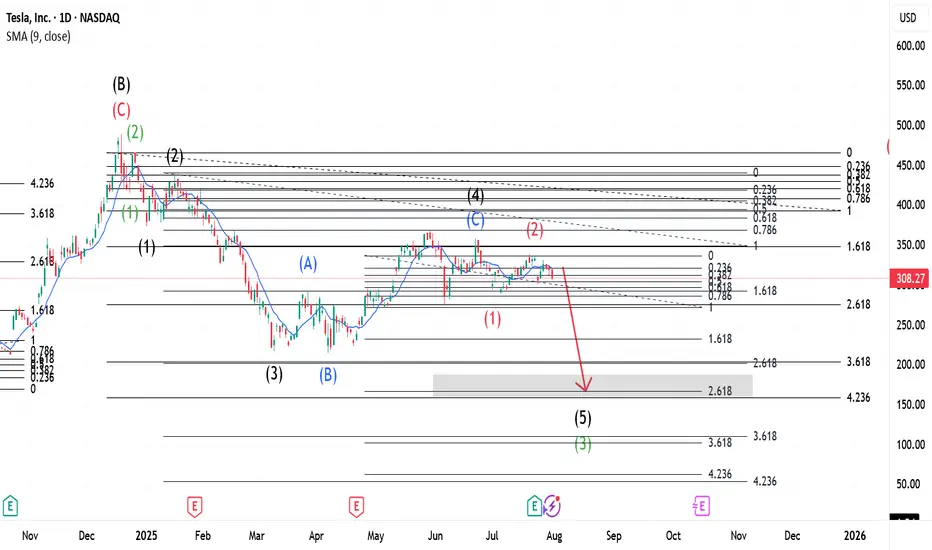
$TSLA ~ Elliott Wave Updates.This whole wave is Wave C(Black) that started when Wave B(Black) was completed. This Wave C(Black) expresses itself in 5 main waves shown in Green. Wave 2(Green) was a Zigzag and a Flat should be expected for 4(Green). Meanwhile, Wave 3(Green) expresses itself in a 5 wave move shown in Black- with Wave 2(Black) being a Zigzag, our 4 was a Flat. This Flat is shown as Blue ABC. When Wave 4(Black) completed, our Wave 5 began which upon completion, would be Wave 3(Green) of the main wave. Wave 2(Red) is a Flat and a Zigzag should be expected after 3(Red).
Go to for more information of the same.
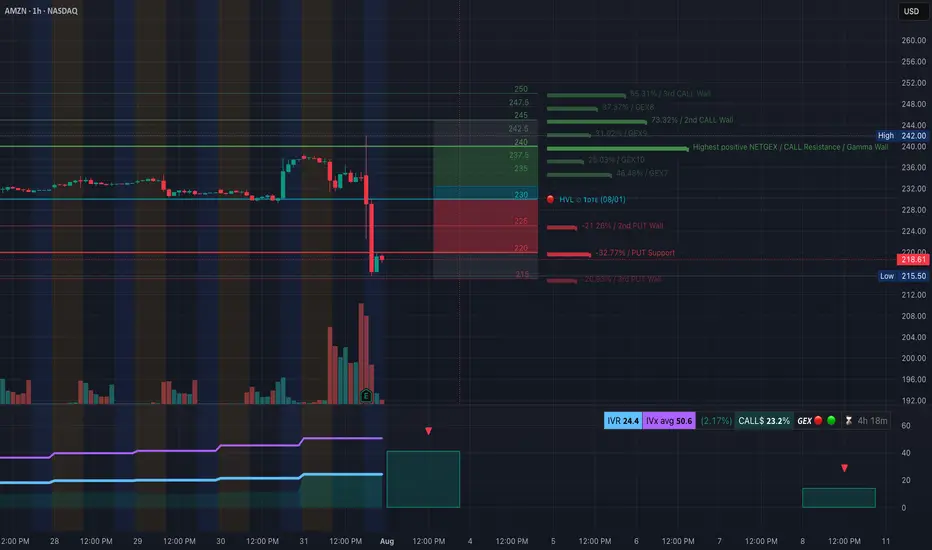
AMZN Earnings Flush — Gamma Flip to the Downside. 8/1AMZN Earnings Flush — Gamma Flip to the Downside, Eyes on $215 Support!
🔍 GEX & Options Flow Insight (1st Image Analysis)
AMZN collapsed post-earnings, breaking through major gamma support levels and flipping into a negative gamma environment. Price is now pressing against a critical $215–218 demand zone, with GEX showing heavy put concentration.
* Call Walls & Resistance:
* 📍 $230.00–$234.00 → Former gamma pivot now acting as strong resistance
* 📍 $237.50 → Prior support zone; now a sell wall
* 📍 $244.00 → Highest Positive NET GEX / Gamma Wall (too far for immediate recovery unless momentum shifts)
* Put Walls & Support Zones:
* 🛡️ $222.18 → 2nd Put Wall resistance-turned-support
* 🚨 $218.00 → Current price — key defense line
* 📉 $215.50 → Hard put wall support — losing this could accelerate selloff toward $210
* Volatility Insight:
* IVR 24.4, IVx Avg 50.6 → Elevated IV post-earnings
* Call flow 23.2% → Bearish options flow bias
* GEX sentiment: 🔴🟡🔴 = Negative gamma = higher volatility risk to downside
✅ Option Trading Suggestion:
Bias: Bearish unless AMZN reclaims $224+
Strategy: Bear put spread
* Entry Idea: Buy 220P / Sell 215P for Aug 2 or Aug 9 expiry
* Invalidation: Strong daily close above $224
* Target: $215 → $210
Why this works: Negative gamma positioning means market makers hedge by selling into weakness, accelerating downside moves. The inability to reclaim $224 confirms the bearish structure.
🧠 Technical Analysis (1H Chart) (2nd Image Analysis)
Market Structure & SMC:
* 🟥 CHoCH confirmed after earnings drop
* ❌ Lost all recent BOS levels in one sharp flush
* Price trapped under former OB resistance at $224–230
Trendline Dynamics:
* Broke out of prior bullish channel to the downside
* New descending channel forming with lower highs
SMC Zones:
* 🟩 Demand Zone: $215.50–$218.00 → Immediate defense
* 🟥 Supply Zone (Purple Box): $224–$230 → Sell wall
🔄 Price Action & Key Levels
* Support:
* ✅ $218.00 → Current defense
* ✅ $215.50 → Last line of gamma support
* 🚨 Below $215.50 → Sell momentum can accelerate to $210
* Resistance:
* 🚩 $224.00 → First reclaim needed for relief rally
* 🚩 $230.00–$234.00 → Heavy resistance
🧭 Scalping / Intraday Trade Setup
🟥 Bearish Setup (Preferred):
* Entry: Failed reclaim of $224
* Target 1: $218.00
* Target 2: $215.50
* Stop: Above $224
🟩 Bullish Reversal Setup:
* Entry: Strong reclaim of $224 with volume
* Target 1: $230.00
* Target 2: $234.00
* Stop: Back under $222
🔁 Summary Thoughts
* AMZN flipped from bullish gamma to negative gamma — puts are now driving price action.
* As long as price stays under $224, rallies are sell opportunities.
* Losing $215.50 risks an accelerated drop to $210 or lower.
* Bears remain in control unless buyers step in aggressively at support.
🚨 Disclaimer:
This analysis is for educational purposes only and does not constitute financial advice. Always do your own research and manage your risk accordingly.
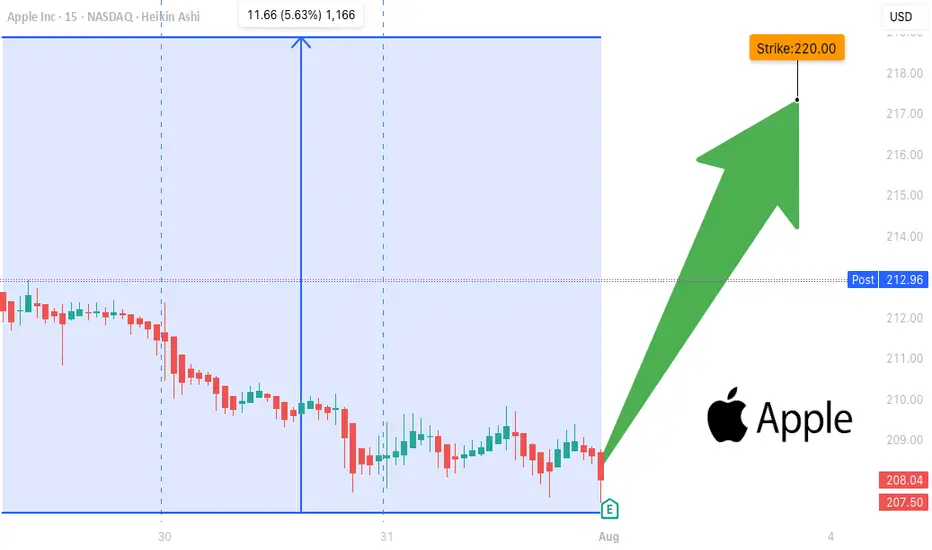
AAPL EARNINGS TRADE SIGNAL (JULY 31)
### 🍏 AAPL EARNINGS TRADE SIGNAL (JULY 31) 🚀
📊 **AAPL Call Play** — Earnings Strategy
🧠 Multi-model conviction: **75% Bullish Bias**
---
### 🔍 Fundamental Drivers
✅ TTM Revenue: +5.1%
✅ Gross Margin: 46.6%
✅ 8 straight earnings beats
⚠️ Sector shift: growth → value = caution
📉 TTM EPS Est: \$8.31 (+29.4% growth est.)
🧮 **Score**: 8/10
---
### 💰 Options Flow Breakdown
🔥 IV Rank: 0.70
🔵 Bullish OI @ \$220C = 25,950 contracts
🔻 Skew: Heavy puts @ \$197.5 / \$200
⚠️ Gamma squeeze possible near \$220
📈 **Score**: 8/10
---
### 📉 Technicals
📍 RSI: 39.3 (Oversold)
📉 Trading below 20DMA (\$211.64)
🟥 Low volume pre-earnings = low conviction
📌 Support: \$207.5 | Resistance: \$220
📉 **Score**: 6/10
---
### 🌐 Macro Setup
⚠️ Supply chain pressures
⚠️ Regulatory risk ongoing
🔄 Growth → Value rotation still underway
🌐 **Score**: 5/10
---
### 🧠 Trade Setup (Call Option)
* 🎯 **Strike**: \$220
* 💵 **Entry**: \$0.87
* 📅 **Expiry**: 08/01 (2DTE)
* 📈 **Target**: \$2.61
* 🛑 **Stop**: \$0.43
* ⚖️ **Risk**: 2% of portfolio
* ⏰ **Timing**: Enter before close, report after market
🧮 Expected Move: ±5.0%
🔒 Confidence Level: 75%
---
### ⚙️ Exit Plan
✅ Profit: Exit @ \$2.61
❌ Stop: Exit @ \$0.43
🕒 Time Exit: Force close within 2 hours post-earnings
---
📣 **EARNINGS SCALP PLAY**
— AAPL is oversold w/ strong EPS beat history
— Bullish OI stacking at \$220
— High gamma setup, low IV risk = 💥
\#AAPL #EarningsTrade #CallOption #TradingView #0DTE #OptionsFlow #GammaSqueeze #UnusualOptions #AppleEarnings #SwingTrade #TechStocks
S&P 500 ETF & Index Hit Resistance – A Technical Warning Shot 📉⚠️ S&P 500 ETF & Index Hit Resistance – A Technical Warning Shot 🔍🧠
Following up on the video I just posted , I had to share this updated chart of the VOO ETF (Vanguard S&P 500) and US500 Index , now that both are testing key resistance levels.
On the left: AMEX:VOO has reached the very top of a multi-year ascending channel—a zone that has historically triggered sharp corrections. The level at 590.85 marks a major resistance zone.
On the right: The US500 Index is showing a similar technical overextension, trading just under 6,450, with 5,928.25 as the nearest support below.
🎯 Technicals at play:
VOO could retrace toward 526.17 and potentially 465.72, both of which are solid technical supports within this channel.
This setup doesn't mean panic—but it does argue for caution, especially after such an extended run.
🧠 And yes, the Buffett Indicator (Stocks-to-GDP) continues to point toward an overheated market . While it's not a timing tool, it adds macro weight to the technical signals.
In the video, I also touched on:
Taking profits on NASDAQ:NVDA after a near-perfect technical rejection at target.
Reviewing Rolls Royce nearing upper channel resistance.
Gold and Silver at inflection points—likely to be impacted if equities begin to unwind.
Rotational potential into Bitcoin and Ethereum, which may benefit from macro shifts.
This is how I trade: respect structure, stay proactive, and prepare before the move—not after. Let me know how you’re positioning or if you’re sitting on hands waiting for a dip.
One Love,
The FX PROFESSOR 💙
Disclosure: I am happy to be part of the Trade Nation's Influencer program and receive a monthly fee for using their TradingView charts in my analysis. Awesome broker, where the trader really comes first! 🌟🤝📈

S&P 500 ETF & Index– Technicals Hint at a Possible Correction📉📊 S&P 500 ETF & Index at Resistance – Technicals Hint at a Possible Correction 🔍⚠️
Everything here is pure technicals— but sometimes, the market whispers loud and clear if you know how to listen. 🧠📐
The VOO ETF, which tracks the S&P 500 , has now reached the upper boundary of a long-term ascending channel, once again brushing against resistance near 590.85. This zone has consistently led to major pullbacks in the past.
On the right panel, the US500 Index mirrors this move—pushing toward all-time highs, right as broader sentiment turns euphoric. Technically, both charts are overextended and pressing into key zones.
👀 Potential Path:
🔻 Rejection from current zone ➝ Down toward 526.17, then 465.72 (green support channel)
🔁 Possible bounce after correction — trend still intact long term
And while we’re keeping it technical, it’s worth noting that the Buffett Indicator (Stocks-to-GDP) i s currently screaming “overvaluation.” This doesn't predict timing—but it adds macro context to an already overheated chart setup.
The lesson? Price respects structure. Whether or not the fundamentals are in agreement, the charts are warning that now may not be the time to chase.
History doesn’t repeat, but it often rhymes. Stay sharp, stay technical. 🎯
One Love,
The FX PROFESSOR 💙
ps. the beauty of these levels? Tight Stop loss- excellent R/R
Disclosure: I am happy to be part of the Trade Nation's Influencer program and receive a monthly fee for using their TradingView charts in my analysis. Awesome broker, where the trader really comes first! 🌟🤝📈

HCL Copper 1M, TF Anticipating Growth & Key Levels ⚙️ Materials: Commodity Cycle Turnaround
(Green energy metals, China recovery)
Government of India Enterprise
Hindustan Copper Limited (HCL)
The company is undergoing a significant mine expansion, projecting a 5x increase in output. This positive development is already reflected in institutional interest, with DIIs increasing their exposure by 8.2% in Q1.
At the time of this analysis, the price stood at 273.
We've observed a volume climax at the bottom, suggesting a potential exhaustion of selling pressure and a base formation.
The white ghost candles pattern illustrate an anticipated future price path, which I project based on current market dynamics and patterns. This projection outlines a potential trajectory we will monitor closely as price develops.
A strong engulfing bullish candle formation above the 281 pivot (🔵) would signal significant bull strength and confirm a strong upward momentum.
A confirmed breakout above the monthly resistance level (🔴) would be a critical bullish signal. initiating further long positions upon a successful retest of this breakout level.
My primary accumulation zone for potential entries is identified in green (🟢 dotted), ranging between 241 and 212. This range represents an area where I anticipate favorable risk-reward for entry.
Target & Time Horizon:
While precise timing is always challenging, I estimate the projected target up to 100% ( above in the white dotted line) could be reached around Q2 2026 or before as markets perform.
Disclaimer:
This analysis represents a personal projection
based on current market observations.
Trade Safely,
Always DYOR
#हिन्दुस्तान कॉपर लिमिटेड
#indianeconomygrowth


Gold Price Outlook: Bearish Trend DevelopingGold has broken below key top resistance, indicating potential for continued downside movement.
The US Dollar's recent rise has slowed amid renewed concerns about the US-China trade truce and profit-taking ahead of this week’s key employment data, following already strong GDP and ADP reports. While the dollar remains supported overall, uncertainty is capping its momentum, indirectly adding short-term volatility to gold.
The price action suggests a bearish breakout from key resistance zones. Momentum is building toward the downside, indicating the market could continue lower unless strong support levels hold. A potential bearish flag or breakdown structure is forming, and if confirmed, we may see a decline toward next support zones.
📍 Key Levels to Watch:
Resistance: 3310 / 3320
Support: 3269 / 3240
If gold remains below the broken resistance and fails to reclaim 3320, the bearish pressure is likely to continue. Watch upcoming employment data as it could add volatility and confirm the direction.
You may find more details in the chart.
Ps: Support with like and comments for better analysis Thanks.

POSSIBLE BEARISH CONTINUATION ON GOLDBased on price action, Gold presents a very bearish sentiment from the daily point of view.
The indicated supply region may be the area of interest for the build up of the sells if indeed Gold is bound for the monthly lows.
Confirmation is needed for an entry.

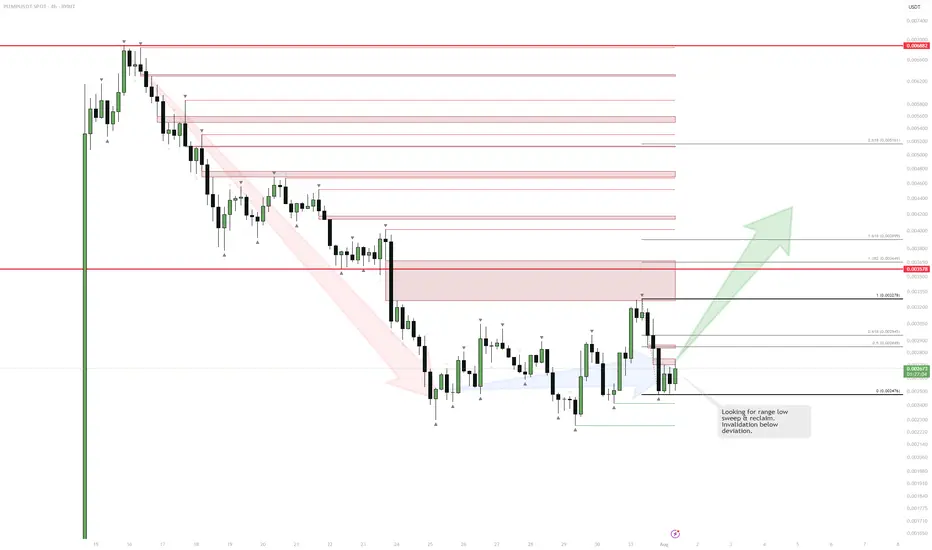
PUMP | Watching for Base ConfirmationThe sharp downtrend is showing signs of exhaustion as price starts to consolidate and build a potential range.
If we see a sweep and reclaim of the range low, that would confirm the start of a new accumulation phase and signal a potential reversal.
The invalidation for any long attempt is a confirmed breakdown below the deviation or the origin of the reclaim.
Plan:
Wait for a clean sweep and reclaim of the range low to trigger a long entry.
Target resistance levels above, with stops set below the reclaim origin.