$SOL breakoutbeen waiting for quite sometime for this to break.
taking a good size low lev long on todays close.
invalidation if we get a daily close below the tl, really good r/r to ignore
gl
Beyond Technical Analysis

Market ViewWatch
Trade
Manage
Smile
@Comtent is pure technical and candle interpretation. Watch and remember to be at peace with your trade decision, as the present is key ingredient to regret or rejoice.

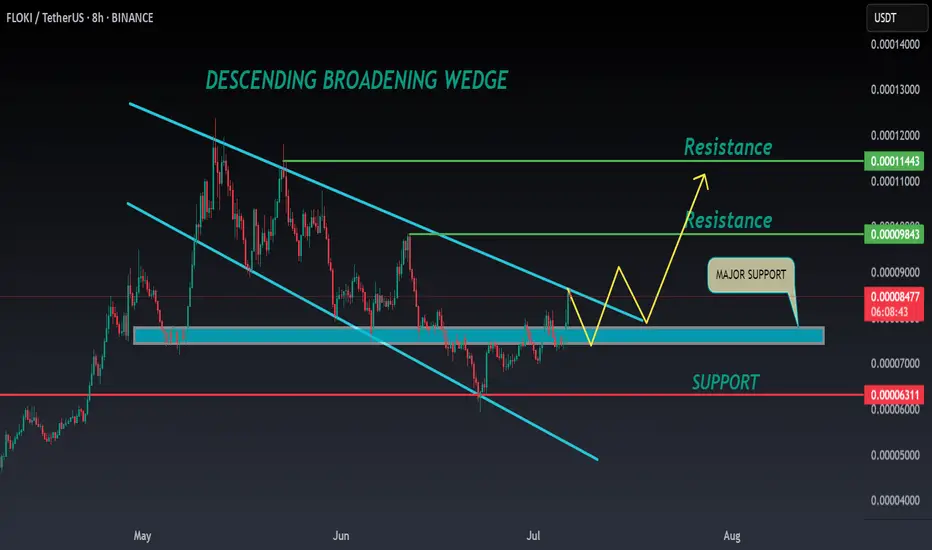
FLOKI ANALYSIS🔮 #FLOKI Analysis 🚀🚀
💲💲 #FLOKI was trading in a Descending Broadening Wedge Pattern, and trying to breakout the pattern. Also there is a instant support zone and after the breakout of resistance zone we will see a bullish move. 📈📈
💸Current Price -- $0.00008540
📈Target Price -- $0.00009840
⁉️ What to do?
- We have marked crucial levels in the chart . We can trade according to the chart and make some profits. 🚀💸
#FLOKI #Cryptocurrency #Breakout #DYOR
S&P 500 and the Elliott Wave TheoryAnalysis shows that the Wave 3(Black) correction is a Flat because Wave 2(Black) was a Zigzag. From the ending of Wave 3(Black), we see a shallow Wave A(Blue) forming. This is our first Wave of the 3 move correction. From A(Blue), another 3 wave move MUST occur and must go beyond the ending of Wave 3(Black) as seen. The correction of Wave A(Blue) is marked by an unfolding 3 wave move shown in Green. Waves A and B are formed after Wave A(Blue) completes. For the last 'leg' of the 3 Wave correction, we find a 5 Wave move shown in Red and this should contain all properties of a normal 5 wave move. Wave 1(Red) is followed by a Zigzag correction and we should expect a Flat correction at Wave 3(Red). Indeed a Flat is formed and is highlighted in Purple. Wave 4(Red) is complete. This sets in motion a last wave that upon completion would be the end of Wave C(Green) hence the end of Wave B(Blue) and would trigger the start of Wave 4(Black). Follow for breakdown of the same chart in the Daily time frame.

SPX Expansion with Historical DataGood morning everyone!
This week I wanted to elaborate more on my previous idea of SPX with the historical data that led to this analysis. This is almost all fundamental analysis adding in the retracement percentages which can also be evaluated through some technical instruments.
Unemployment rate is currently at 4.1%, with inflation at 2.4%. Based on the data, it is evident the market is currently in an expansion period which is why the narrative that we will see 2 interest rate drops by the end of year continues to diminish. I think we will probably see 1 before the year ends and that would just fuel the market and gain momentum to the upside.
If we were to measure the expansion of SPX going back to the 2000's, we get an extension of at least 75%. If we were to extend 75% based on the previous swing high (6,147) we could see future SPX price at 8,500. Now, do your own research, but the data is here. I expect the market to possibly retest previous high, but if you did not enter during the dip, no worries. There is still plenty of upside potential and better late than never.
Remember... CASH FLOW IS KING!
Avoid all the noise and distractions. The job of many platforms out there is to have something to put out for the public EVERYDAY! A good amount of that is noise. Look for macroeconomic news and let that be your indicator.
Historical Data:
(1) .com Bubble (2000 - 2002) We had a 50% drop of SPX. This lasted for almost 2 years before recovery.
(2) Housing Market (2007 - 2009) The SPX dropped 57% due to the collapse of subprime lenders collapsing. Housing prices decline drastically leaving people with high mortgage payments than what their homes are actually worth leading to a wave of foreclosures.
(3) Covid (2020) This was a global event with government mandated shutdowns causing the entire financial markets to come to a halt. Many business closures that led to jobs loss with an unemployment rate of approximately 15%.
(4) Inflation & Rate Hikes (2022) When Covid happened, upon recovery market expanded way too fast causing inflation to rise and the Feds to increase interest rates to slow down the economy.
(5) Tariffs (2025) Will stay away from politics on this one, however, a rebalancing of trade has taken place with some countries still working on tariff deals with the U.S. This has caused huge uncertainty for companies and corporation. VIX (fear index) reached 60.13.
Hope you enjoyed this post. Have a great rest of your week, don't forget to like and follow and Happy Trading!

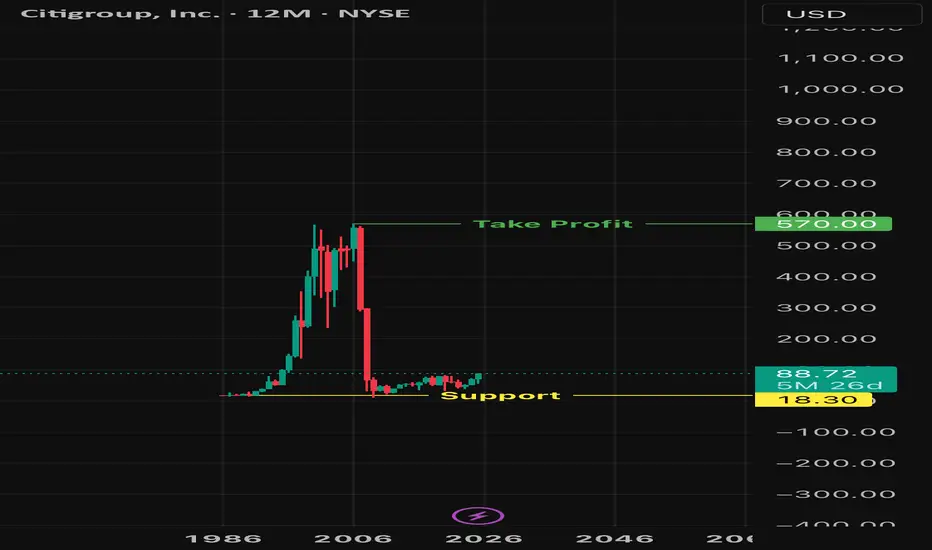
Citigroup Citigroup looks like a great buying opportunity. A seemingly double bottom has formed so I expect a bullish trend to the all time high and perhaps, eventually beyond.
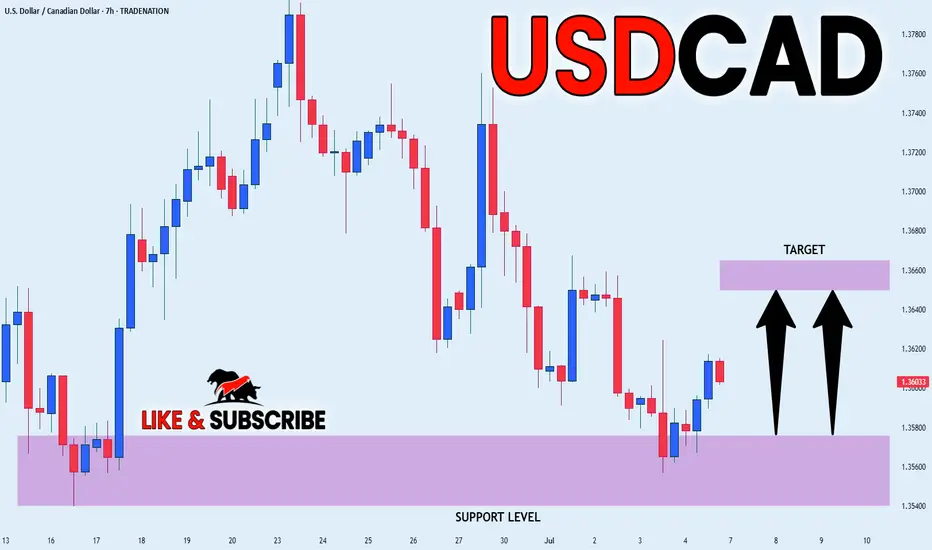
USD_CAD POTENTIAL LONG|
✅USD_CAD went down to retest
A horizontal support of 1.3560
Which makes me locally bullish biased
And I think that a move up
From the level is to be expected
Towards the target above at 1.3652
LONG🚀
✅Like and subscribe to never miss a new idea!✅
Disclosure: I am part of Trade Nation's Influencer program and receive a monthly fee for using their TradingView charts in my analysis.
Middle East Tensions vs. Global Demand Hello Traders 🐺
🧠 Fundamental Insight:
Recent geopolitical developments in the Middle East — particularly tensions involving Iran, Israel, and unrest around the Red Sea shipping routes — have reignited fears of supply shocks in the oil market.
But how much of this is just market sentiment, and how much is a real, structural threat?
It’s important to note that most oil-producing nations in the Middle East are heavily reliant on oil revenue to sustain domestic budgets.
Prolonged disruption in oil supply would backfire economically, forcing them to eventually restore production — or risk budget deficits, currency devaluation, or inflation.
Moreover, while global efforts are pushing toward electrification and renewable energy, a large portion of electricity is still generated using fossil fuels — many of which are petroleum-based.
So even as demand shifts in form (from gasoline to electricity), crude oil remains embedded in the global energy matrix.
🇺🇸 The U.S. & 🇨🇳 China: Macro Drivers at Work
The U.S. remains the world’s largest oil producer thanks to shale output. Any significant rise in Brent can be quickly counterbalanced by a ramp-up in U.S. production.
The Fed’s monetary policy also plays a role. A stronger USD (via rate hikes) generally pressures oil prices downward.
China, as the largest importer of crude, has a decisive influence on demand. Weak industrial output or real estate troubles in China can nullify even a strong supply shock.
Watch for China’s stimulus policies — any sign of renewed growth can boost Brent significantly.
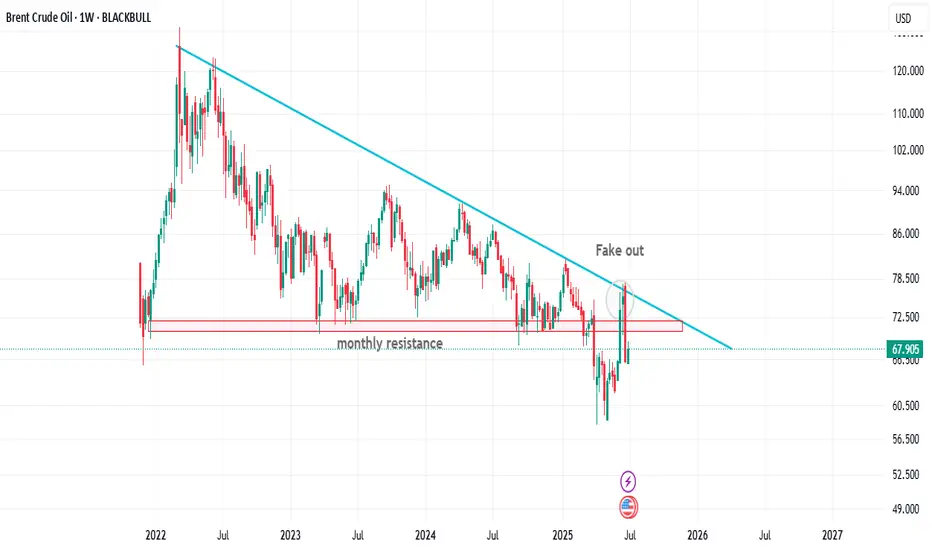
📉 Technical Outlook (Brent Crude - Weekly Chart Hypothesis):
As you can see on the weekly chart , price was trying to pump above the monthly resistance area however It's turned into the fake out and all of us knows that this is a massive sign of weakness for BRENT but I still think that price is currently could goes a little bit higher than the current level and break above the blue trend line in the mid term .
Any news-driven spike (e.g., new conflict headlines) must be validated by volume and follow-through — otherwise, it's a fade opportunity.
🎯 Conclusion:
Don’t blindly buy into every geopolitical headline.
While the Middle East remains a key risk factor for Brent, true price action will depend on the balance between physical disruptions and global demand signals — particularly from the U.S. and China.
In this market, the chart reacts first, but macro confirms the move.
As traders, we must track both — not just price, but purpose.
let me know what you are thinking about the current situation in the comment section down below !
and as always remember :
🐺 Discipline is rarely enjoyable , but almost always profitable 🐺
🐺 KIU_COIN 🐺
Shorty GbpJpyLook for liquidity sweep at the end of each trend
Mark your retracement zones
Use Fibonacci to find your sl and tp zones
Rule of your deposit
Try to set sl at 10% of your deposit
Use a reasonable lot size
AND MAKE A TRADE

EOS -> Vaulta : (0.5013 support is the key)
Hello, traders.
If you "Follow", you can always get new information quickly.
Have a nice day today.
-------------------------------------
EOS switched from banking to blockchain during the network reorganization.
(AUSDT 1D chart)
The key is whether it can rise to around 0.5013 and receive support.
If not, it is likely to show a step-down trend.
-
(4h chart)
In terms of day trading,
Support range: 0.4942-0.4822
Resistance range: 0.5959-0.6394
We need to see whether it can receive support and rise in the above range.
However, since the M-Signal indicator of the 1D chart is passing around 0.5013, it is important to see how the volume profile formed around this area and 0.5389 will rise.
-
Thank you for reading to the end.
I hope you have a successful trade.
--------------------------------------------------
- Here is an explanation of the big picture.
(3-year bull market, 1-year bear market pattern)
I will explain the details again when the bear market starts.
------------------------------------------------------

See if we can hold the price above 0.05709
Hello traders.
Please "Follow" to get the latest information quickly.
Have a nice day today.
-------------------------------------
(AWEUSDT 1D chart)
The total supply of 2 billion has been unlocked.
Therefore, it seems that temporary profit taking will occur.
We will have to wait and see what kind of flow it will show in the future, but I think the key is whether there is support around 0.05709, which is the HA-Low indicator point.
Since the volume profile section formed on the current 1D chart is formed at 0.06367, we need to check whether there is support around this area.
The 0.06981-0.07188 section corresponds to the previous high point of the 1M chart.
Therefore, the start of the uptrend is expected to begin when the price breaks through the 0.06981-0.07188 section upward and is maintained.
-
In summary of the above,
- The time to buy is when support is confirmed around 0.05709.
- The resistance section is likely to be around 0.06367 and the 0.06981-0.07188 section.
Therefore, you should create a response strategy depending on whether there is support at the points or sections mentioned above, that is, 0.05709, 0.06367, 0.06981-0.07188.
If the price falls below 0.05709, you should stop all trading and wait and see.
The reason is that it is likely to lead to a step-down trend.
Even if it rises, it is expected that there will be a limit to the rise due to profit taking for the time being because all tokens have been unlocked.
-
Thank you for reading to the end.
I hope you have a successful trade.
--------------------------------------------------
- This is an explanation of the big picture.
(3-year bull market, 1-year bear market pattern)
I will explain more details when the bear market starts.
------------------------------------------------------

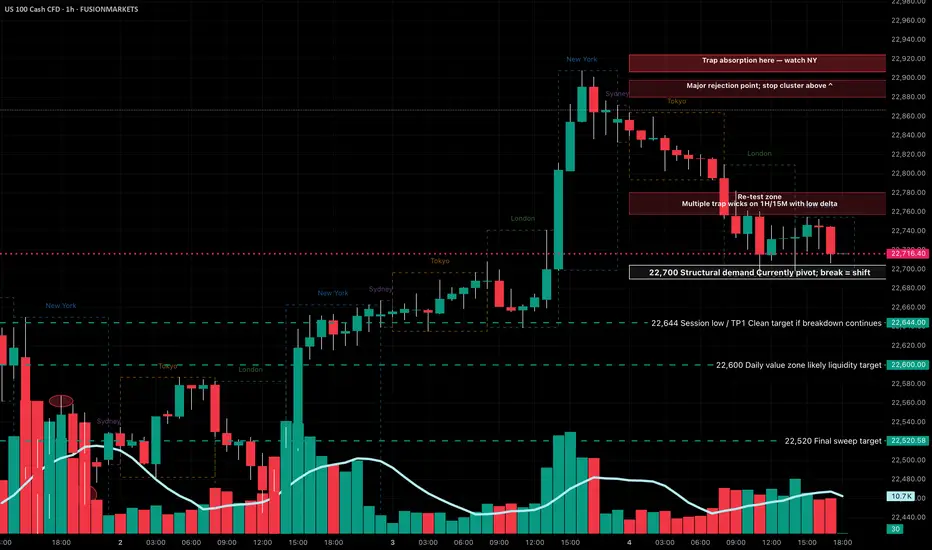
NASDAQ Key Levels July 7 2025If NY fails to reclaim 22,755–780 early in the week, expect a grind back toward 22,644 → 22,600, with 22,520 in play only if volume confirms. Reclaiming and holding above 22,800+ would invalidate this bearish setup.
Watch for trap volume, delta reversals, and volume imbalances at all key zones before entering.
22,880 – 🔻 Weekly wick top
➤ Major rejection zone with a stop cluster sitting above.
22,800–820 – 🧱 Possible NY trap zone
➤ Trap absorption detected here on footprint — watch New York for rejection or breakout.
22,755–22,780 – 🔁 Retest zone
➤ Multiple trap wicks with low delta on 1H/15M. Likely to bait breakout traders before fading.
22,700 – ⚠️ Structural demand / pivot point
➤ A clean break + hold below = bearish market shift.
22,644 – ✅ Session low / Take Profit 1
➤ If 22,700 breaks, this is the first clean downside target.
22,600 – 🎯 Daily value zone
➤ High-probability liquidity target if selling extends below 22,644.
22,520 – 🧨 Final sweep target
➤ Only likely if New York session sells off hard mid-to-late week.
Gold Weekly Recap – Week 27 (30 Jun – 04 Jul)🟡 XAUUSD | MJTrading
Overview
Gold (XAUUSD) staged a significant recovery this week after retesting a critical support zone. Price action reflected strong buying interest at lower levels, followed by consolidation near mid-range resistance.
🔹 Key Levels:
Strong Support Zone: 3,246 – 3,250
Weekly Low: 3,246.35 (30 June)
Weekly High: 3,365.77 (3 July)
Closing Price: ~3,343
🔹 Price Action Summary:
✅ Early Week Retest & Reversal
After the prior week’s decline, gold opened the week near the major support area around 3,246. This zone acted as a strong demand pocket, triggering a swift rejection and initiating a bullish reversal.
✅ Sustained Rally to Resistance
Price climbed steadily, riding the 15-period EMA to reach the weekly high of 3,365.77 on 3 July. This move represented a nearly 4% recovery off the lows, fueled by renewed safe-haven flows and short covering.
✅ Midweek Consolidation
Following the rally, gold entered a sideways consolidation phase between 3,340 and 3,365. EMA flattening reflected a pause in momentum as traders assessed the next directional catalyst.
✅ Late-Week Pullback
Toward the end of the week, price tested the 3,310–3,320 area before modestly bouncing into the Friday close. Overall, the market maintained a cautiously bullish tone while holding above the prior support.
🔹 Technical Perspective:
🔸 Bias: Cautiously Bullish
Price defended the strong support and printed a higher low structure.
Sustained closes above 3,300 maintain the bullish outlook.
🔸 Near-Term Resistance:
3,365–3,390 remains the immediate supply zone to monitor for breakout attempts.
🔸 Key Support:
The 3,246–3,250 area continues to be the primary downside line in the sand.
🔹 Special Note – 4th July US Bank Holiday
Trading volumes were notably lighter on Thursday, 4th July, due to the US Independence Day holiday. This contributed to reduced liquidity and muted volatility, with many traders and institutions off desks. The thinner market conditions likely influenced the late-week pullback and consolidation, as participation was limited heading into the weekend.
🔹 Sentiment & Outlook
The decisive rebound from support suggests that buyers are defending value zones aggressively. However, failure to close the week above 3,365 leaves gold vulnerable to another retest of mid-range levels if fresh catalysts don’t emerge.
Traders should watch for:
A clean breakout above 3,365 to confirm continuation higher.
Any sustained weakness below 3,300 as a signal of fading bullish momentum.
🧭 Next Week’s Focus:
Monitoring whether the consolidation evolves into accumulation or distribution.
Watching for a breakout or deeper pullback
Reactions to upcoming economic data
EMA alignment: If the 15 EMA continues to track above the 60 EMA, it supports a bullish bias.
Chart Notes:
The main chart highlights this week’s action, while the inset provides a fortnight overview of the broader decline and recovery for context.
Thank you for your time and your support...
🚀🚀Boost it if you like it (Thanks)🚀🚀
#Gold #XAUUSD #GoldTrading #Forex #Commodities #TechnicalAnalysis #PriceAction #TradingRecap #MJTrading #GoldForecast #MarketReview #WeeklyRecap #TradingView

NQ 100 E mini
🧠 NASDAQ 100 (NQ) Weekly Outlook – July 8–12, 2025
📍Liquidity Sweep Before Expansion?
After the rejection near 23,100, NQ appears to be entering a rebalancing phase, with potential downside liquidity grabs before any continuation to the upside.
📊 Key Technical Levels:
🔸 High: 23,102.50 → Major buy-side liquidity zone.
🔸 Equal Lows: 22,675 – 22,725 → Potential draw on liquidity.
🔸 0.75–1.00 retracement zone (from the recent bullish leg) overlaps with a clear demand area.
🔸 Multiple open Fair Value Gaps (FVGs) remain above and below current price.
📈 Primary Scenario:
✅ Bullish bias, after a potential liquidity sweep below the Equal Lows.
🔻 A downside sweep into the 22,675–22,725 zone would open up opportunities to go long on bullish confirmation, targeting:
22,975 (FVG fill)
23,050 (intermediate resistance)
23,102+ (liquidity above previous high)
⚠️ Alternate Scenario:
If the market fails to sweep the lows and begins pushing higher early in the week, I’ll look for breakout-retest setups above 22,975 to participate in continuation plays.
🎯 Weekly Game Plan:
Plan A: Wait for a liquidity sweep below the equal lows, then look for a bullish reaction and structure shift to go long.
Plan B: In the absence of a sweep, only consider longs above 22,975 after confirmation of strength.
📌 This outlook is based on price action, market structure, liquidity zones, and FVG analysis. Not financial advice.

Bitcoin May See Short-Term Pullback After Hitting $108,000📊 Market Overview:
Bitcoin surged to $108,000 amid renewed risk-on sentiment, a softer US dollar, and slightly declining bond yields. However, weekend trading sees lower liquidity, and some profit-taking has emerged. Traders are also cautious ahead of next week’s Fed-related news.
📉 Technical Analysis:
• Key Resistance: $108,500 – $110,000
• Nearest Support: $106,200 – $105,500
• EMA 09 (1H): Price is above EMA 09, indicating bullish momentum remains.
• Candlesticks & Volume: Doji candle and falling volume in 1H → suggests weakening upside momentum and possible retracement.
📌 Outlook:
Bitcoin may face a short-term pullback if it fails to break above $108,500 and no fresh catalysts emerge. Holding above $106,200 would keep the broader bullish structure intact.
💡 Suggested Trade Setup:
🔻 SELL BTC/USD at: 108,200 – 108,500
🎯 TP: 106,800
❌ SL: 109,300
🔺 BUY BTC/USD at: 106,200 – 105,500
🎯 TP: 107,800
❌ SL: 104,800

109159This channel is not providing individualized trading or investment advice, nor is it a banking service, brokerage service, trading service, investment service or money management service


$NSE:JUBLFOOD emitting Multibagger sign to me ! Going to Double
Jubilant FoodWorks continues to lead the QSR sector in India with a dominant Domino’s operation, rapid expansion, tech-savvy strategies, and growing digital/delivery revenue. While inflation and discounting squeeze margins, strategic initiatives in chicken, app-first ordering, and sustainability make it a resilient and forward-looking foodservice giant.
For investors, Jubilant stands strong on growth metrics, though a high valuation necessitates cautious optimism. For employees, it offers significant career momentum in a fast-paced setting, albeit with pressure and potential work-life trade-offs.
Aggressive store expansion: Adding ~50–130 new outlets per quarter, including strong growth in Domino's and initial Popeyes rollout
Digital-first approach: Focus on 20‑minute delivery, app-based orders, loyalty programs, in-house logistics—reducing reliance on third-party platforms
Product innovation: Launching mid-price chicken offerings (e.g., wings), premium pizzas (e.g., Cheese Volcano), responding to Gen‑Z demand
Tech & sustainability: Investments in energy-efficient stores, solar power, e‑bikes fleet, AI-driven supply chain, warehouse & delivery tech

i am bearish for PENGUUSDT for now Key Observations & Analysis
Structure & Trend
You can see a clear downtrend in June.
Price formed an inverted head and shoulders pattern:
Left Shoulder: Early June low.
Head: Deeper low mid-June.
Right Shoulder: Late June higher low.
This is a bullish reversal pattern.
Trendline Breakout: After the right shoulder formed, price broke the diagonal trendline resistance (marked “trendline breakout”)—signaling bullish momentum.
Breakout & Rally
Strong volume increase confirmed the breakout.
Price trended up rapidly after the breakout, forming higher highs and higher lows.
Recent Price Action
The current price is consolidating in a key supply zone (gray shaded area).
Marked order block: a potential supply zone where smart money may sell.
Price has also made a Market Structure Shift (MSS)—suggesting the uptrend could be losing steam.
HTF POI (Higher Timeframe Point of Interest)
The upper gray box labeled HTF POI between ~0.0167–0.0175.
This is likely a major resistance area.
Price is testing this zone repeatedly.
Liquidity & Target
Trend liquidity has been swept, meaning stops above recent highs have likely been taken.
There is a blue shaded box indicating a potential short scenario:
Entry near the order block.
Target near the prior consolidation support around ~0.008–0.009.
This implies a bias toward a corrective move or retracement.
Volume & RSI
Volume spiked during breakout and has since decreased—often a sign of buyer exhaustion.
RSI around ~58—neutral but no overbought signal yet.
✅ Interpretation Summary
Bullish Arguments:
The inverted head and shoulders broke out cleanly.
Strong trend continuation into higher timeframe resistance.
Bearish Arguments:
Price is consolidating under significant resistance (HTF POI).
Order block + liquidity sweep suggest potential distribution.
Market structure shift indicates sellers are stepping in.
The blue target box shows a potential retracement target near 0.008–0.009.
✅ What This Likely Means
Scenario 1 (Continuation):
If price breaks cleanly above 0.0175 with strong volume, continuation higher is likely.
Scenario 2 (Rejection):
If price keeps rejecting this order block, a short-term pullback toward 0.009 becomes probable.
✅ Tip if You’re Trading This
Watch for a clear reaction in the gray order block area.
Confirmation of rejection could trigger shorts.
A strong close above the HTF POI invalidates the bearish scenario.

Gold price is moving sideways on H4 frame, above 3242✍️ NOVA hello everyone, Let's comment on gold price next week from 07/07/2025 - 07/11/2025
⭐️GOLDEN INFORMATION:
Gold prices resumed their upward momentum on Friday and are on track to close the week with gains exceeding 1.50%, supported by a weaker US Dollar amid subdued liquidity following the Independence Day holiday in the United States. A mild uptick in trade tensions also contributed to bullion's strength. At the time of writing, XAU/USD is trading at $3,333, up 0.26%.
President Donald Trump announced that the US would begin sending official letters to trading partners on Friday ahead of the July 9 deadline, outlining new tariff measures ranging between 10% and 70%, set to take effect on August 1. Treasury Secretary Scott Bessent added that a wave of trade agreements is expected before the deadline, estimating that around 100 countries will face a minimum 10% reciprocal tariff. He also hinted at upcoming deal announcements.
⭐️Personal comments NOVA:
Gold price continues to move sideways, accumulating in a large range: 3242 - 3450
🔥 Technically:
Based on the resistance and support areas of the gold price according to the H4 frame, NOVA identifies the important key areas as follows:
Resistance: $3362, $3393, $3446
Support: $3312, $3279, $3241
🔥 NOTE:
Note: Nova wishes traders to manage their capital well
- take the number of lots that match your capital
- Takeprofit equal to 4-6% of capital account
- Stoplose equal to 2-3% of capital account
- The winner is the one who sticks with the market the longest

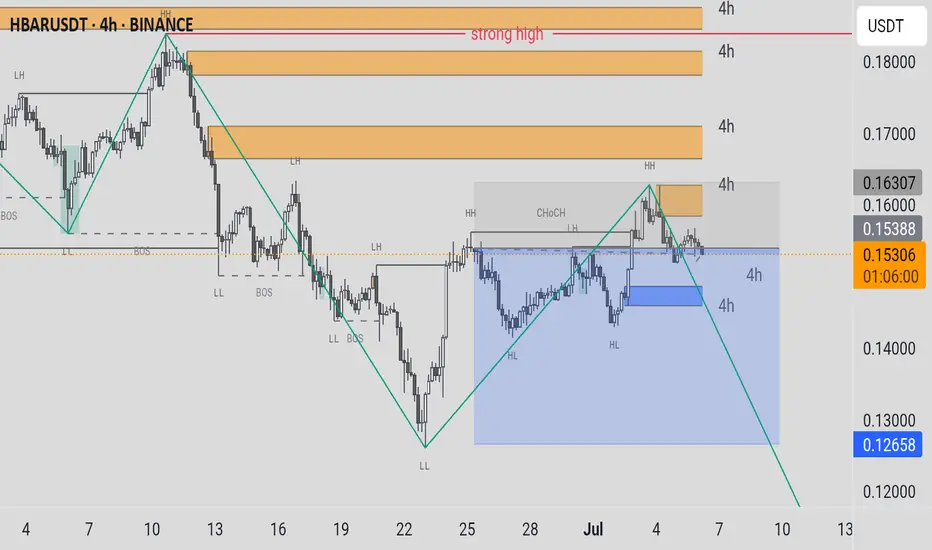
HBARUSDTCryptocurrency Futures Market Disclaimer 🚨🚨🚨
Trading cryptocurrency futures involves high risks and is not suitable for all investors.
Cryptocurrency prices are highly volatile, which can lead to significant gains or losses in a short period.
Before engaging in crypto futures trading, consider your risk tolerance, experience, and financial situation.
Risk of Loss: You may lose more than your initial capital due to the leveraged nature of futures. You are fully responsible for any losses incurred.
Market Volatility: Crypto prices can fluctuate significantly due to factors such as market sentiment, regulations, or unforeseen events.
Leverage Risk: The use of leverage can amplify profits but also increases the risk of total loss.
Regulatory Uncertainty: Regulations related to cryptocurrencies vary by jurisdiction and may change, affecting the value or legality of trading.
Technical Risks: Platform disruptions, hacking, or technical issues may result in losses.
This information is not financial, investment, or trading advice. Consult a professional financial advisor before making decisions. We are not liable for any losses or damages arising from cryptocurrency futures trading.
Note: Ensure compliance with local regulations regarding cryptocurrency trading in your region.
thanks for like and follow @ydnldn to have more information outlook and free signal.
About me :
"I am a passionate swing trader focused on analyzing financial markets to capture profit opportunities from medium-term price movements. With a disciplined approach and in-depth technical analysis, I concentrate on identifying trends, support-resistance levels, and price patterns to make informed trading decisions. I prioritize strict risk management to protect capital while maximizing profit potential. Always learning and adapting to market dynamics, I enjoy the process of refining strategies to achieve consistency in trading."
GBP/USD weekly outlookMy weekly outlook & key levels for GBP/USD. I will look for a confirmation of my strategy once reach one of this levels.

GBP_AUD BEARISH BIAS|SHORT|
✅GBP_AUD is going up to retest
A horizontal resistance of 2.0892
Which makes me locally bearish biased
And I think that we will see a pullback
And a move down from the level
Towards the target below at 2.0805
SHORT🔥
✅Like and subscribe to never miss a new idea!✅
Disclosure: I am part of Trade Nation's Influencer program and receive a monthly fee for using their TradingView charts in my analysis.
