AMZN Gamma Setups + Trade Plan for July 7📡 GEX-Based Option Trading Analysis
Amazon (AMZN) shows bullish option flow into next week. The GEX map highlights the following:
* Highest Net GEX sits at 225, acting as a strong magnetic price level / resistance zone.
* There’s a Call Wall cluster at 225–230, which could cap short-term upside unless we break through with strong momentum.
* IVR: 27.5 — moderately elevated, giving decent premium for calls.
* Calls: 8.8% vs. Puts: neutral – bullish skew with gamma support underneath.
* Support zone: 215–213 (GEX floor + HVL + PUT wall).
* A break above 226 opens doors to a potential squeeze into 230–232.
🟢 Trade Idea for Options:
* Directional Bullish Bias above 223.
* Consider buying July 12th 225C or vertical 223/230C debit spread for a lower risk play.
* Use tight stop if price fades below 219.75.
📈 1-Hour Chart Technical Setup
From the 1H chart:
* AMZN broke structure (BOS) above 223 and reclaimed the trendline.
* Price has broken out of the previous supply zone (highlighted in purple) and is retesting it now.
* 9/21 EMA shows bullish crossover; price holds above trendline with rising volume.
* Strong support confluence around 219–221 from CHoCH, EMA, and structure lows.
* Bias remains bullish continuation as long as price holds 221.60–222.
🧠 Scalping Plan (Intraday):
* Long setup: Look for retest entry at 223.00 or 222.50, stop below 221.50, target 225.60, then 227.50.
* Avoid chasing if price gaps above 226. Wait for retrace back into structure.
* Bearish invalidation only below 219.
🎯 Final Thoughts:
* AMZN is entering a gamma-rich zone. Watch 225 reaction — breakout could spark a run to 230+.
* Options look primed for bullish plays. Chart structure supports a breakout continuation.
* Trade with tight stop-losses, especially ahead of CPI next week.
This analysis is for educational purposes only and does not constitute financial advice. Always manage risk and do your own research.
Beyond Technical Analysis

NVDA GEX Analysis for Options Trading. Jul 7Gamma Exposure (GEX) Insights – July 5, 2025
* 📍Key Gamma Wall (Resistance):
→ 160.98 — Highest positive GEX level (strong call wall / gamma resistance).
→ 162.5 — Next large call wall, acting as a magnet or rejection pivot.
→ 165 / 170 — Thin GEX above = squeeze zone if breakout occurs.
* 🧲 Support Side:
→ 152.5 – 150: HVL + Put Support + GEX pocket.
→ 140: Second PUT wall, deeper support if breakdown worsens.
* 📉 IV Sentiment:
→ IVR: 5.6, IVx avg: 37.9 = Low implied volatility.
→ Current IV crush environment favors debit call spreads or directional long calls with tight risk.
* 📊 Call/Put Flow:
→ Calls: 3.3%, Puts: -0.53%
→ Slight bullish bias but not overcrowded — room for gamma expansion.
🔄 Options Trade Setups Based on GEX
Bullish Gamma Squeeze Setup:
🟢 Trigger: Price breaks and holds above 161.
🧨 Target: 165 → 170 (thin GEX zone could cause sharp move).
🛡️ Strategy: Buy 160C / Sell 165C (debit spread) or long 162.5C with defined stop.
⛔ Stop: If NVDA fails to hold above 158.
Bearish Gamma Rejection Setup:
🔴 Trigger: Rejection at 160.98–162.5 zone with volume fade.
🎯 Target: 156.5 → 152.
🛡️ Strategy: Long 160P / Short 155P (bear put spread) or short 162.5C naked if IV allows.
⛔ Stop: Breakout above 162.5 invalidates this setup.
📈 1-Hour Chart Technical Analysis
Structure & Price Action:
* NVDA is in bullish market structure, forming higher lows with a clean CHoCH → BOS → retest play.
* It reclaimed the 159.20 level and is testing the 160.98–162.5 zone — a key area where momentum traders will engage.
Zones to Watch:
* Support:
→ 156.68 (minor swing support)
→ 153–152 OB zone (valid bullish OB + HVL)
* Resistance:
→ 161–162.5 (GEX resistance + supply)
→ Above 162.5 opens room to 165+
Trend & Volume:
* Strong bullish candle breaking BOS.
* Volume picked up during BOS, but follow-through needs to come with breakout candles or retest hold.
🔍 My Suggestions for Intraday/Swing Traders:
✅ Bullish Setup:
If NVDA holds above 159.20 and reclaims 161, enter on retest of 160.50.
TP1: 162.5
TP2: 165
SL: Below 157.80
❌ Bearish Setup:
If price gets rejected near 162 and breaks below 157.80 → short retracement to 153.
TP1: 156.5
TP2: 152
SL: Above 162.50
My View:
Currently bullish bias but entering a decision zone. Wait for clean breakout with volume, or short rejection if momentum fades. Keep GEX in mind — above 162.5 has little resistance and can rip.
This breakdown is for educational purposes only and not financial advice. Always manage your risk before taking a trade.

EUR_AUD LOCAL CORRECTION|SHORT|
✅EUR_AUD is set to retest a
Strong resistance level above at 1.8020
After trading in a local uptrend for some time
Which makes a bearish pullback a likely scenario
With the target being a local support below at 1.7940
SHORT🔥
✅Like and subscribe to never miss a new idea!✅
Disclosure: I am part of Trade Nation's Influencer program and receive a monthly fee for using their TradingView charts in my analysis.

Gold Holding Strong – A Move to $3356 Could Be NextGold is currently trading at $3337, which is an important support level. Earlier, the price dropped to around $3310, but it has since started to recover from that level. This bounce suggests that buyers are stepping in, and the market is showing some strength.
Based on this recovery and the strong support at $3332.50, I expect the price of gold to move higher, possibly reaching around $3356 in the short term.

LINKUSDT Cryptocurrency Futures Market Disclaimer 🚨🚨🚨
Trading cryptocurrency futures involves high risks and is not suitable for all investors.
Cryptocurrency prices are highly volatile, which can lead to significant gains or losses in a short period.
Before engaging in crypto futures trading, consider your risk tolerance, experience, and financial situation.
Risk of Loss: You may lose more than your initial capital due to the leveraged nature of futures. You are fully responsible for any losses incurred.
Market Volatility: Crypto prices can fluctuate significantly due to factors such as market sentiment, regulations, or unforeseen events.
Leverage Risk: The use of leverage can amplify profits but also increases the risk of total loss.
Regulatory Uncertainty: Regulations related to cryptocurrencies vary by jurisdiction and may change, affecting the value or legality of trading.
Technical Risks: Platform disruptions, hacking, or technical issues may result in losses.
This information is not financial, investment, or trading advice. Consult a professional financial advisor before making decisions. We are not liable for any losses or damages arising from cryptocurrency futures trading.
Note: Ensure compliance with local regulations regarding cryptocurrency trading in your region.
thanks for like and follow @ydnldn to have more information outlook and free signal.
About me :
"I am a passionate swing trader focused on analyzing financial markets to capture profit opportunities from medium-term price movements. With a disciplined approach and in-depth technical analysis, I concentrate on identifying trends, support-resistance levels, and price patterns to make informed trading decisions. I prioritize strict risk management to protect capital while maximizing profit potential. Always learning and adapting to market dynamics, I enjoy the process of refining strategies to achieve consistency in trading."
Cosmos (ATOM) $70 New All-Time High, Market Dynamics & MoreCurrent price for ATOMUSDT matches the low from September 2020. The same range was also active in July of the same year and between December 2019 and February 2020.
From a low point in March 2020 Cosmos (ATOMUSDT) grew 4,122% to peak in September 2021. Giving us a 560 days long bull market.
The double-top in January 2022 extended the bull market to a total of 679 days. Those that didn't sell in September 2021, after a correction, had an additional month to sell at the highest possible.
Back in those days we had a rising bottom after the all-time low. This time around we have a stable (flat) bottom.
The lowest price for Cosmos happened March 2025. A one year long bull market would give us a top around March 2026. If we get 560 days like last time this would give us a top around September 2026. Compare this to September 2021, same month. Things will be pretty interesting that's for sure.
We cannot generalize anymore and each pair/project needs to be considered individually.
For example, Ethereum hit bottom June 2022, here Cosmos hit bottom March 2025, huge difference. Many projects bottomed also mid-2022 but others bottomed around August 2023, others August 2024 and many others just recently, 7-April 2025 and some even last month.
We are entering uncharted territory.
The big projects and the ones with ETFs will have their own charts. Corrections will be minimal and we cannot expect the same highly volatile and crazy dynamics as when Crypto was underground, it is public now and it has all the attention in the world. The altcoins can't crash down too strong when everybody is waiting to buy when prices go low.
The flat bottom in 2024-2025 for Cosmos can tell of two things: 1) There is the possibility of one final flush, lasting only a few hours or days and this would mark the start of the next bullish phase. Or, 2) the next cycle can start uneventfully. Normally there is always a strong shakeout before the change in trend.
A pair can grow for years, as some projects are already doing based on higher lows while others can be doing things differently.
I am just trying to get the point across that each project needs to be considered individually, this is very important for the future because everything is changing now but the effect will be felt only after many months. Even the bear market will spread out; not like before. The bull market is very likely to be extended because the projects move in groups and since the market is so big now it will take time for each group to jump.
Start late, ends late.
This chart allows for a new all-time high. $70 is the standard projection and I should say also the minimum. But this one is tricky because of the chart structure. It can also end with no new all-time high so all will depend on the demand. How strong is the project, the team behind it, how active are the participants, etc.
There will be enough capital for everything to shine but only those with a plan and the right tools will attract our attention. It is a huge game, competition is very strong. Those that neglect their projects are likely to stay behind. Those that are active with a positive mindset and plan, should come to the front.
You know how it is... Regardless of any individual project, Crypto is going up.
Namaste.

ONDOUSDT Cryptocurrency Futures Market Disclaimer 🚨🚨🚨
Trading cryptocurrency futures involves high risks and is not suitable for all investors.
Cryptocurrency prices are highly volatile, which can lead to significant gains or losses in a short period.
Before engaging in crypto futures trading, consider your risk tolerance, experience, and financial situation.
Risk of Loss: You may lose more than your initial capital due to the leveraged nature of futures. You are fully responsible for any losses incurred.
Market Volatility: Crypto prices can fluctuate significantly due to factors such as market sentiment, regulations, or unforeseen events.
Leverage Risk: The use of leverage can amplify profits but also increases the risk of total loss.
Regulatory Uncertainty: Regulations related to cryptocurrencies vary by jurisdiction and may change, affecting the value or legality of trading.
Technical Risks: Platform disruptions, hacking, or technical issues may result in losses.
This information is not financial, investment, or trading advice. Consult a professional financial advisor before making decisions. We are not liable for any losses or damages arising from cryptocurrency futures trading.
Note: Ensure compliance with local regulations regarding cryptocurrency trading in your region.
thanks for like and follow @ydnldn to have more information outlook and free signal.
About me :
"I am a passionate swing trader focused on analyzing financial markets to capture profit opportunities from medium-term price movements. With a disciplined approach and in-depth technical analysis, I concentrate on identifying trends, support-resistance levels, and price patterns to make informed trading decisions. I prioritize strict risk management to protect capital while maximizing profit potential. Always learning and adapting to market dynamics, I enjoy the process of refining strategies to achieve consistency in trading."

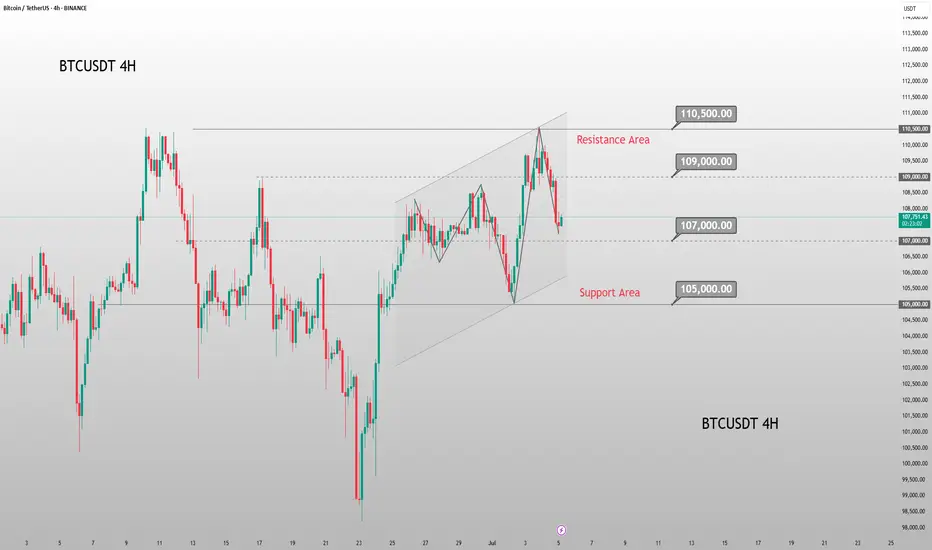
Evening BTC Trend Analysis and Trading SuggestionsLet's review this afternoon's market performance. The BTC price, as we anticipated, rebounded to around 109,000 in the afternoon before plummeting sharply. Living up to "Black Friday", this violent drop was well within our expectations. In the afternoon's live trading, we also reminded everyone that as long as there was a rebound to the upper zone, it was a good opportunity to go short. This drop has created a space of nearly 1,500 points. Currently, the BTC price has pulled back to around 107,800.
From the current 4-hour K-line chart, after a strong upward surge, the market encountered significant resistance near the upper track of the Bollinger Bands. As bullish momentum gradually faded, the price started to come under pressure and decline, suggesting that the short-term upward trend may come to a temporary halt. At present, the market has recorded multiple consecutive candlesticks with large bearish bodies. The price has not only effectively broken below the key support level of the Bollinger Bands' middle track but also caused the Bollinger Bands channel to switch from expanding to narrowing, indicating that market volatility is decreasing. In terms of trading volume, it showed a moderate increase during the price pullback, which further confirms the authenticity of the bearish selling pressure.
BTCUSD
sell@108000-1085000
tp:107000-106000
Investment itself is not the source of risk; it is only when investment behavior escapes rational control that risks lie in wait. In the trading process, always bear in mind that restraining impulsiveness is the primary criterion for success. I share trading signals daily, and all signals have been accurate without error for a full month. Regardless of your past profits or losses, with my assistance, you have the hope to achieve a breakthrough in your investment.
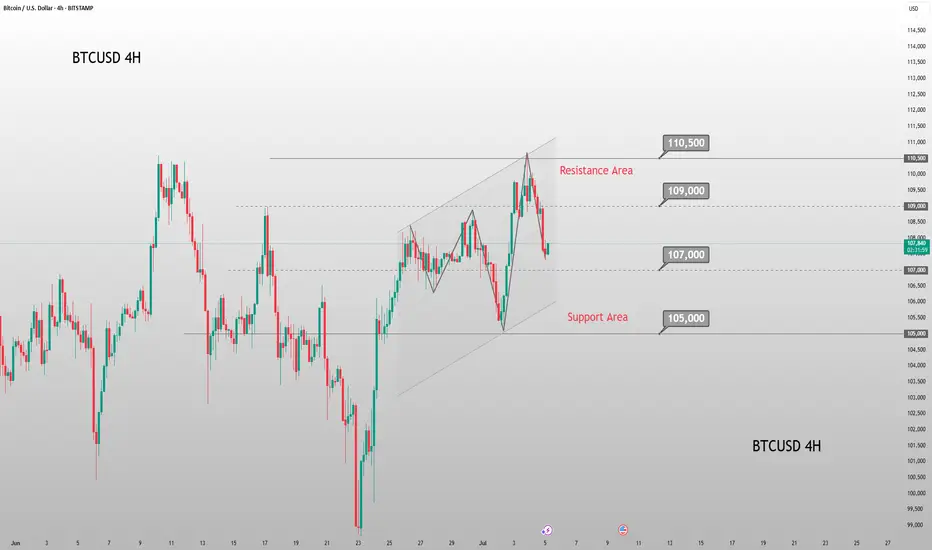
Weekend BTC Trend Analysis and Trading SuggestionsLet's review this afternoon's market performance. The BTC price, as we anticipated, rebounded to around 109,000 in the afternoon before plummeting sharply. Living up to "Black Friday", this violent drop was well within our expectations. In the afternoon's live trading, we also reminded everyone that as long as there was a rebound to the upper zone, it was a good opportunity to go short. This drop has created a space of nearly 1,500 points. Currently, the BTC price has pulled back to around 107,800.
From the current 4-hour K-line chart, after a strong upward surge, the market encountered significant resistance near the upper track of the Bollinger Bands. As bullish momentum gradually faded, the price started to come under pressure and decline, suggesting that the short-term upward trend may come to a temporary halt. At present, the market has recorded multiple consecutive candlesticks with large bearish bodies. The price has not only effectively broken below the key support level of the Bollinger Bands' middle track but also caused the Bollinger Bands channel to switch from expanding to narrowing, indicating that market volatility is decreasing. In terms of trading volume, it showed a moderate increase during the price pullback, which further confirms the authenticity of the bearish selling pressure.
BTCUSD
sell@108000-1085000
tp:107000-106000
Investment itself is not the source of risk; it is only when investment behavior escapes rational control that risks lie in wait. In the trading process, always bear in mind that restraining impulsiveness is the primary criterion for success. I share trading signals daily, and all signals have been accurate without error for a full month. Regardless of your past profits or losses, with my assistance, you have the hope to achieve a breakthrough in your investment.
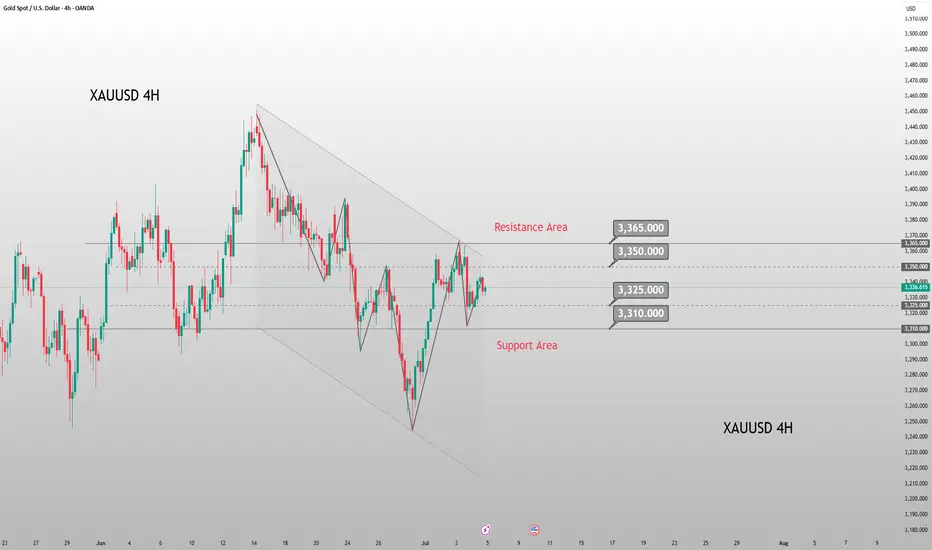
Gold lacks downside momentum: Next week's analysis & adviceGold trading is relatively light today due to the U.S. Independence Day holiday. On the downside, we continue to focus on the short-term support at the 3325 level, while the key resistance above remains in the 3345-3350 range, which was yesterday's breakdown point. The market has closed early today, and price action has been stuck in a range-bound consolidation.
After plunging $40 on the back of bearish non-farm payroll data, gold stabilized and rebounded, recouping nearly half of the losses. This performance confirms that the downside space is limited. Currently, the market has returned to a oscillating upward pattern, and the weekly chart is likely to continue range-bound fluctuations. From a technical perspective, the 3325 level has formed a key support. The secondary retest overnight confirmed the bottom structure, and the gradual lifting of early session lows has also released a bullish signal. Looking ahead to next week, gold is expected to continue its bullish trend. If the 3325 support level below remains unbroken, one can look for opportunities to establish long positions.
XAUUSD
buy@3325-3330
tp:3340-3360-3380
Investment itself is not the source of risk; it is only when investment behavior escapes rational control that risks lie in wait. In the trading process, always bear in mind that restraining impulsiveness is the primary criterion for success. I share trading signals daily, and all signals have been accurate without error for a full month. Regardless of your past profits or losses, with my assistance, you have the hope to achieve a breakthrough in your investment.

Pine Screener - Powerful tool for building programmable screenerHello Everyone,
In this video, we have discussed on how to use pine screener utility of tradingview. We are making use of the indicator Divergence Screener for this demonstration and screen stocks undergoing bullish divergence.
In a nutshell, here are the steps:
🎯 Use Stock Screener to build watchlist of less than 1000 symbols
🎯 Add the indicator you want to use in the pine screener to your favorites.
🎯 Pine screener can be accessed from the tradingview screener menu or you can simply click on the link www.tradingview.com
🎯 Add the watchlist and indicator to the pine screener and adjust the timeframe and indicator settings
🎯 Select the criteria to be scanned and press scan

Inside My Gold Mind: Weekend Trade Log📌 Market Context / Bias
The majority of bullish price action on VELOCITY:GOLD occurred early in the week — specifically between Monday and Tuesday. From midweek through Friday, the market entered a period of consolidation, showing signs of compression.
Interestingly, despite positive economic data that favoured the USD, GOLD remained steady and resilient. This suggests underlying bullish pressure and potential accumulation.
My current bias is bullish going into the new week — with expectations of a price expansion to the upside.
🔍 Higher Timeframe Analysis
Weekly Candle: Shows early bullish expansion followed by consolidation — classic sign of absorption or reaccumulation.
Draw on Liquidity: Equal highs remain above, acting as a magnet for price.
FVGs: Price traded into a daily FVG earlier in the week and closed above it.
Order Block: Price respected a previous Bullish Order Block during Thursday’s retracement, reinforcing possible support.
🧩 Lower Timeframe Confluence
1H–4H: Price is forming relatively equal highs above the current range — potential liquidity targets.
Intraday Structure: No major shift to bearish order flow was confirmed; compression suggests a possible continuation move once expansion begins.
🧠 Fundamental Insight
Despite hawkish or strong USD fundamentals, GOLD held its ground. This divergence often precedes a strong move — likely driven by risk sentiment, upcoming Fed commentary, or global macro drivers.
🧠 Trade Plan Preview
Stay tuned for my daily updates where I’ll share:
My bias for the day
Market structure breakdown
Intraday trade plan (entry, targets, and session model)
⚠️ Reminder:
Trade with due diligence. This is not financial advice. Always align entries with your personal model and preferred session.
Thanks for your support!
If you found this idea helpful or insightful, please drop a like 👍 and leave a comment — I’d love to hear your thoughts! 🚀
Follow me for more daily price action insights and trading strategies on XAUUSD and other key markets.
Let’s grow and trade smarter together! 📈
⚠️ Disclaimer
This content is for educational and informational purposes only and does not constitute financial or investment advice.
All trading involves risk. You are solely responsible for your own decisions, so always conduct proper research and due diligence before taking any trades.
Past performance is not indicative of future results. Trade responsibly.
May your final trades of the week be precise and profitable.

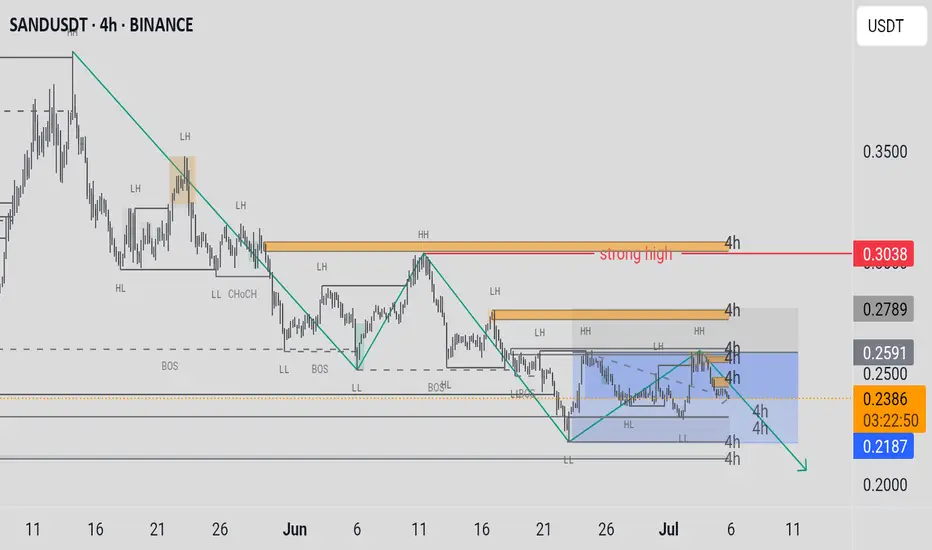
SANDUSDTdowntrend move :
SANDUSDT market structure
for now making correction move, taking inducement before impulsive move.
GLXY Bull flag....ready to goIt looks like GLXY is ready to pop.It looks like a bull flag on weekly time frame, ready to go,short term target $32-34 longer-term new all time high 😀


BCHUSDTBitcoin Cash making correction move, it will going up again?
if break low (strong low) BCHUSDT switch trend 📉

Sonic (SUSDT) Technical Analysis – Key Resistance in Play!🚨 Sonic (SUSDT) Technical Analysis – Key Resistance in Play!
Sonic (SUSDT) is currently struggling to break through the key resistance zone at 0.3512, showing signs of weakness from buyers.
📉 If the downtrend continues, major support levels are clearly highlighted on the chart. Watch closely for 0.1522 and then 0.1292 as critical zones where price could react.
🔥 On the flip side, if Sonic manages to break and hold above 0.3520, we could see a bullish move toward 0.3783 and 0.3968 as the next targets.
🎯 This is a crucial level where the next major move could begin. Stay alert — great opportunities often start with smart analysis.
👉 If you like clean charts, real analysis, and no hype — follow me for daily updates on altcoins like Sonic, ETH, BTC, and more!

BNBBTC (Binance Coin vs Bitcoin) New All-Time High & 2026 BullI've been looking at Binance Coin vs Bitcoin and this chart has some pretty interesting dynamics, quite unique I should say. This can be a great opportunity for what is about to happen.
In the last bull market BNBBTC produced massive growth, the most interesting part is the fact that it continued to grow even during the bear market. Not that it lacked during the bull market and then grew during the bear market, but it grew strongly in early 2021 and continued to grow through 2022 while everything was going down. BNBBTC peaked only in November 2022 when Bitcoin hit bottom.
If we get some similar dynamics in this cycle, we can imagine BNBBTC starting to grow now, together with the rest of the market. When the bull market ends, all-time high, Bitcoin is going to 1M+ etc., then BNBBTC continues growing as the bear market unravels. This is because people tend to use BNB to store value and also because trading, market activity and engagement shoots up after the bullish cycle is over. Everybody, their mothers and cousins become professional traders and gamble everything away. This process can take an entire year... When all the money that was earned through the bull market is lost, then we get the bear market bottom and the cycle repeats.
At this point many people will be selling and giving up, but that would only be the start. November 2022 vs November 2026. Ok... That is too far away, let's focus on this present day.
Binance Coin vs Bitcoin, BNBBTC, produced a major low December 2023 and a higher low February 2025. December 2023 marked the end of the bear market for this pair. February 2025 confirms the bearish wave is over; the downtrend is no more.
We have a transition period, consolidation for more than a year. From the bottom we grow.
I am expecting a new all-time high on this pair and this is an easy guess. The only danger Binance was facing came from the previous administration, before Trump. Now that the Cryptocurrency hating crowd is gone, we can aim to the top and beyond. There is no limit to how far up anything Crypto can go. Truly... This is only the start...
It is still early
Notice how some pairs are really high and very advanced on their bullish cycle. Notice how other pairs are still trading at bottom prices. Pairs like this one can be approached easily, with low risk with 5X focused on the long-term. Very low risk with a high potential for reward... Never chase a rising wave. It is better to look for one that is yet to start.
Imagine if you were surfing. Would you be able to join a wave that is already pretty advanced? It can end your life. But if you glide patiently on your board looking around to catch a newly developing wave... It would be an awesome ride and your enjoyment is secure, guaranteed and safe. Catch the early wave.
There are endless opportunities in this market.
Your continued support is appreciated.
Crypto is the future of finance.
Crypto is the evolution of the Internet.
.....
Oh and by the way, the same dynamic I mentioned here between 2021 and 2022, also happened in 2018-2019. This means that there is high probability that BNBBTC will continue growing beyond the 2025 bull market. It is likely to grow during the bear market as well.
There are always several pairs that are used as a hedge. Finding those ahead of time can make a huge difference on how strong your portfolio remains during the bear market. I will be recommending selling though but not 100%. We will be selling around 60-70% and the rest we keep invested regardless of what happens. We are Crypto, we love Crypto and we support he market.
Namaste.

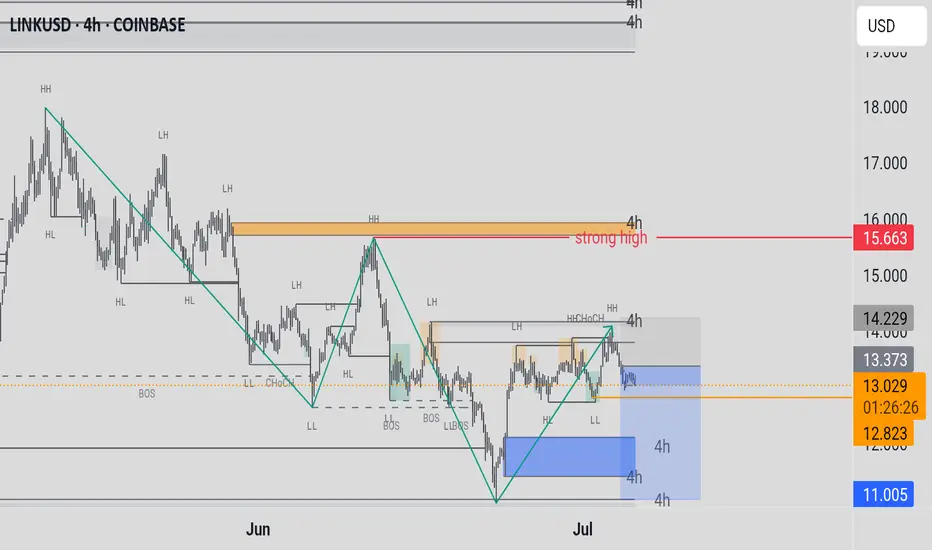
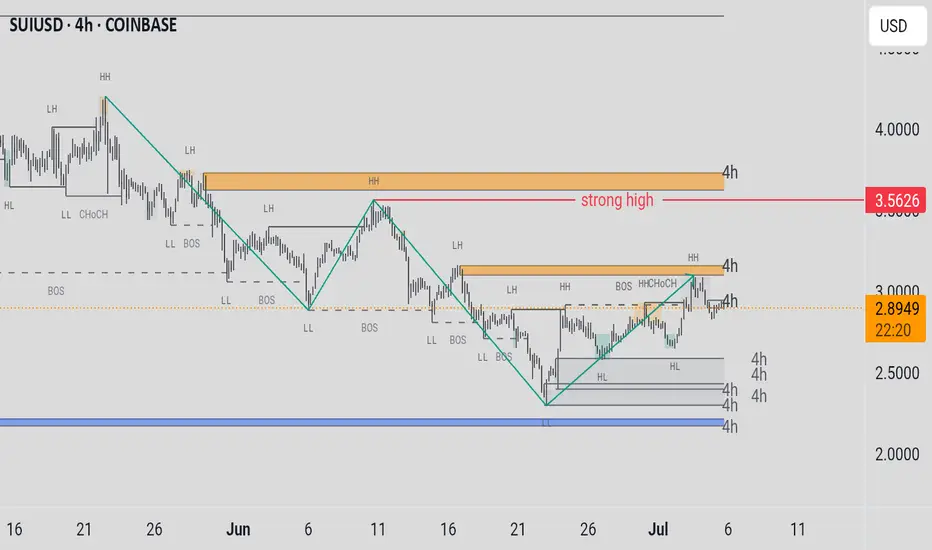
SUIUSDTPrice Levels: The current price is around 2.445 USD. A "strong high" resistance is marked at 3.5626 USD, with a higher high (HH) near 3.8917 USD.Support and Resistance:Support zones include 2.8917 USD, 2.445 USD (HL), and a lower support around 2.500 USD.Resistance is strong near 3.5626 USD, with potential resistance up to 4.000 USD.Trends: The chart shows a downtrend with lower lows (LL) and lower highs (LH) until recently, where a break of structure (BOS) and higher high (HH) suggest a potential reversal or consolidation. The price is currently testing the 2.445 USD support.Patterns: Annotations like "CHOCH" (Change of Character) and "BOS" indicate shifts in market structure, hinting at possible bullish momentum if support holds.
potential to short selling:
BTC - Zoomed Out ScenarioAs predicted DXY has broken down a major monthly bearish trendline - currently finishing a bearish retest before further free fall.
If this plays out we have 2-3 years of a weakening / correcting dollar, and a strengthening investment in assets such as Bitcoin.
This means an extended bull market spanning 2-4 years on Bitcoin and equities.
However - there is a mass amount of liquidity to the uber lows towards 10,000 on BTC.
Market is showing manipulated intention to hit these lows by keeping the price below this bearish cross section - and that’s why bitcoin hasn’t been moving up yet.
This tells me this is more likely than we all think to play out.
I’m trading the following:
Short - 108,200 to 35,000
Long - 35,000 to 80,000
Short - 80,000 to 10,000
Will update accordingly if the plan changes.
Happy trading.

ETH / USDC Liquidity Pool RangeTightening up the range a little. Looking good with horizontal lines setting the new range.

$NSE:NIFTY is Going to Burst Up Side ! SkyRocketing TIme is NearNSE:NIFTY is Going to Burst Up Side ! SkyRocketing TIme is Near
NIFTY 50 BULLISH REVIEW (My View) 💥
📈 Current Bias: BULLISH
✅ Nifty 50 showing strong resilience above key support levels.
✅ The index is holding well above recent consolidation zones and looks ready for further upside.
✅ Momentum indicators (like RSI) are staying in positive territory, showing sustained strength.
✅ Higher highs & higher lows structure intact on daily chart — bulls in control!
🔑 Key Levels:
👉 Immediate support: 23,333 - (watch for buying interest here)
👉 Resistance ahead: 23,850 - 23,900 (break above = fresh rally potential)
🌟 What I’m Watching:
🚀 Breakout above 23,900 could open doors towards 24,200+ levels in the coming sessions.
🚀 Strong sector participation from banks, IT, and autos — a broad-based rally is a positive sign.
🚀 Keep an eye on global cues + FII activity — may add fuel to the trend.
NSE:NIFTY is Going to Burst Up Side ! SkyRocketing TIme is Near
