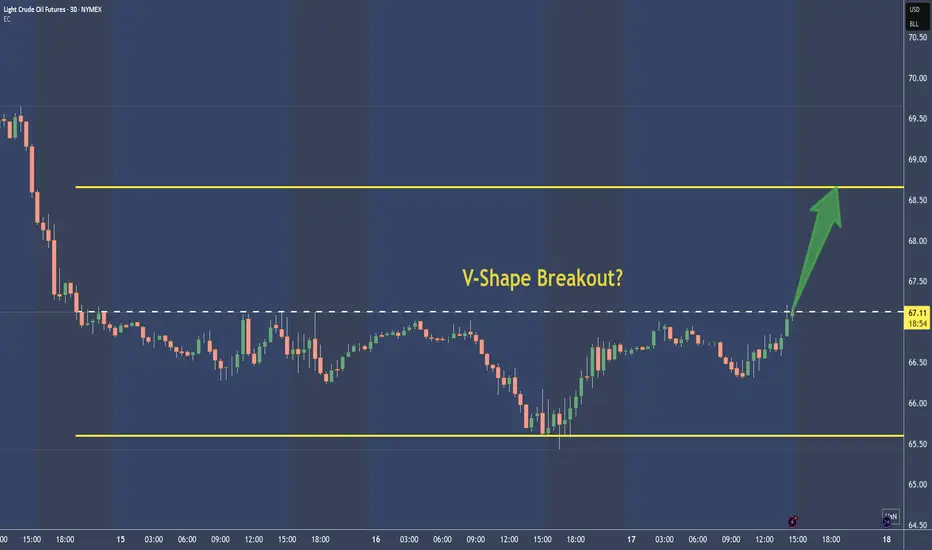
Crude Oil - CL shows a superb V-Shape Long-TradeNot much to say here.
To me it's just a BUY, with the target around the upper yellow line. Stop depends on movement. I add and remove Contracts, until there is a nice ternd or momentum established.
Trade is toast below the V.
Beyond Technical Analysis
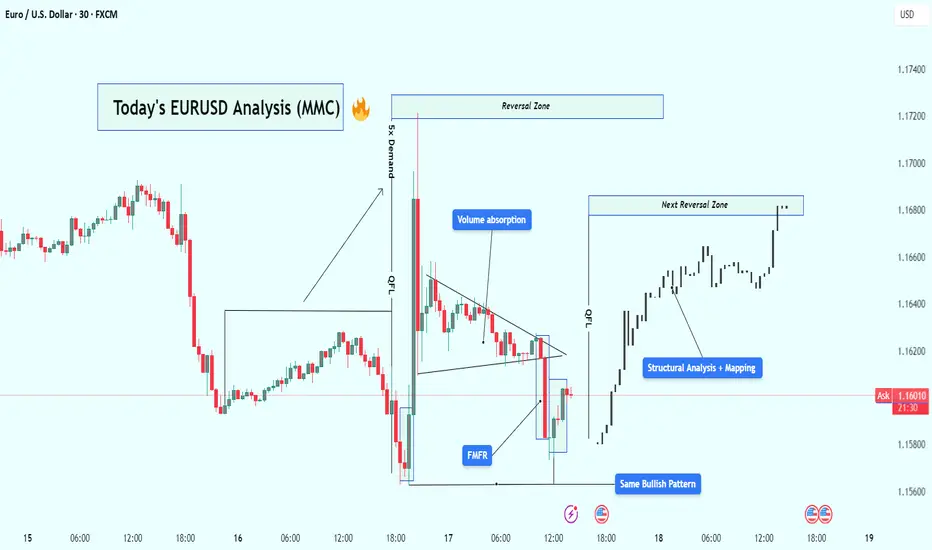
EUR/USD Analysis : Bullish Reversal – Volume Absorption & Target🧠 Market Overview:
EUR/USD has followed a flawless Market Maker Cycle, moving from manipulation to expansion. The chart shows institutional behavior through liquidity grabs, volume absorption, and structural breaks, confirming that big players are in full control.
The current price action signals bullish strength targeting the next high-probability reversal zone, but let’s break this down from the very beginning.
🔍 Key Chart Phases and Insights:
1️⃣ Massive Bearish Impulse – Liquidity Sweep Phase
At first glance, the chart shows an aggressive drop — a strong bearish leg that looks like market weakness.
❗ But in reality, this is the liquidity sweep phase. Here’s what likely happened:
Price ran below key lows
Hit stop losses of early buyers
Created “fake” bearish sentiment
Built sell-side liquidity for institutions to buy from
🔑 This isn’t weakness — it’s a setup.
2️⃣ FMFR (Final Move for Reversal) + Instant Reaction
At the end of that drop, the market printed a sharp bullish engulfing candle from the lows — this is known as the Final Move for Reversal (FMFR).
This marks:
The end of the accumulation phase
Entry of smart money into the market
The beginning of a new bullish cycle
The size and speed of this move indicate high-volume orders were filled — classic sign of institutional presence.
3️⃣ 5x Demand Push – Start of Expansion Phase
After the FMFR, price explodes upward with 5 consecutive bullish candles. This is your expansion phase — the market is moving fast, breaking structure, and flipping direction.
Key takeaways from this leg:
Strong displacement confirms a new trend
High momentum candles reflect institutional interest
Price breaks above previous structure levels
📈 This is no longer random — it’s planned and executed by bigger players.
4️⃣ Volume Absorption in Tight Wedge – Smart Money Re-Accumulation
After the breakout, price doesn’t just continue flying — instead, it compresses in a tight triangle. This is a key phase called volume absorption or re-accumulation.
What’s happening here:
Institutions are absorbing retail orders
Low volume = no resistance = easier breakout
Price is “charging” before the next move
🔋 Think of this like coiling a spring — it’s getting ready to pop again.
5️⃣ Bullish Pattern Repeats – MMC Confirmed
Interestingly, we now see the same bullish pattern forming again on the right side of the chart, similar to the first FMFR.
This is powerful because:
Pattern repetition means consistent order flow
Smart money is using the same blueprint
It gives us confidence to follow the trend
⚠️ When the same bullish setup happens twice — it’s not by chance.
6️⃣ Structural Mapping – Road to Reversal Zone
On the far right, we’ve entered clean bullish structure, making higher highs and higher lows.
We are now targeting:
The next Reversal Zone near 1.16800
This zone could act as resistance or another trap
A strong reaction from this zone can trigger either profit-taking or short-term reversal
Price is currently in the "continuation" part of MMC, heading toward premium levels.
📈 Trading Plan Based on This Setup:
✅ Primary Bullish Plan:
Price respects current structure
Breaks minor highs with strong volume
Entry on retracement to broken structure
Target: 1.16800 reversal zone
⚠️ Alternate Bearish Setup (If Price Rejects Reversal Zone):
Sharp rejection from reversal zone
Break of structure (BOS) on lower timeframe
Entry on lower high retest
Target: Liquidity areas below 1.16200
🧵 Conclusion:
This EUR/USD chart is a blueprint of institutional market flow. From the liquidity sweep, to volume absorption, to repeating bullish patterns, we’re seeing a textbook Market Maker Cycle (MMC) play out.
Here’s what makes this chart powerful:
✔️ Volume confirms structure
✔️ Reversal zones are clearly defined
✔️ Same bullish pattern = smart money roadmap
✔️ Trade setups are clean with defined risk
✅ This is the kind of setup you wait days for — don’t rush, follow structure, and execute with confirmation.
Bitcoin and Upcoming TrendBitcoin’s trend has been growing from strength to strength — and it’s likely to stay that way. Why?
This trend isn’t driven purely by speculation; it’s supported by strong fundamental reasons.
One of the most widely debated topics in finance today is the comparison between Bitcoin and gold. While both are viewed as stores of value, their long-term roles may diverge significantly.
Yet, they’ve been moving in near-perfect synchronization, with potential resistance ahead, but their trend still remain intact — and here’s why.
Mirco Bitcoin Futures and Options
Ticker: MBT
Minimum fluctuation:
$5.00 per bitcoin = $0.50 per contract
Disclaimer:
• What presented here is not a recommendation, please consult your licensed broker.
• Our mission is to create lateral thinking skills for every investor and trader, knowing when to take a calculated risk with market uncertainty and a bolder risk when opportunity arises.
CME Real-time Market Data help identify trading set-ups in real-time and express my market views. If you have futures in your trading portfolio, you can check out on CME Group data plans available that suit your trading needs www.tradingview.com

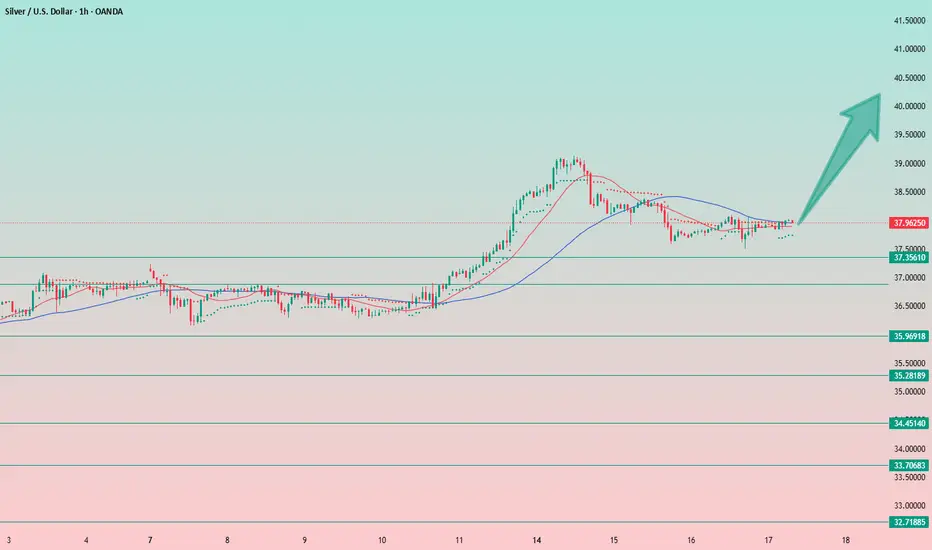
Silver: Bullish Setup from Accumulation ZoneSilver touched its support level at $37.50 and quickly bounced back into the accumulation zone.
From the current levels, I expect an upward breakout. The setup looks very bullish.
I'm going long from the current price of $38. Stop-loss is placed just below the local low at $37.50. A break below $37.50 would signal further downside toward the next strong support around $36.75–$37, where I’d reassess the long opportunity. But honestly, I see this scenario as unlikely.
Targets are all the round numbers: $40, $41, and so on (classic—markets are psychological, and people tend to focus on clean, round numbers). Additional targets include $43.50 and $48.25, which align with levels from 2011–2012.
And look at how harmonious the chart looks.
Volatility is decreasing, the entire structure is stretching out on the hourly timeframe.
We're seeing accumulation followed by an expected breakout, and based on all external factors, an upward move seems likely.
📝Trading Plan
Entry: Entry at current prices and in the 37.75–38.25 range — the long position remains valid.
In fact, the long setup remains valid even at slightly higher levels (but not below), although the stop-loss starts to widen and exceeds 2%. If you're okay with that, then it's still a viable long opportunity.
Stop Loss: Below yesterday's low at $37.50
Target: The first target is $40, and the global target is $ 48.25.
However, it's unlikely we'll reach that level in one move — there will likely be re-entries along the way.
COIN -- Major Trendlines + Bearish Divergence = Breakdown?Hello Traders!
Today I have shared the chart of COINBASE. Of course we cant know for sure what price will do, however you can take clues and combine them to give you a high probability reading of the chart.
Here are the clues:
1) MAJOR TRENDLINE
2) TRENDLINE
3) BEARISH DIVERGENCE
4) BULL FLAG MEASURED MOVE
When we combine these clues, a very bearish picture is painted... This signals to me that there is a high probability price will likely reverse and trade to the downside in the near future.
I hope everyone enjoyed this post and is able to use it as an educational tool.
Thanks everyone and best of luck on your trading journey!

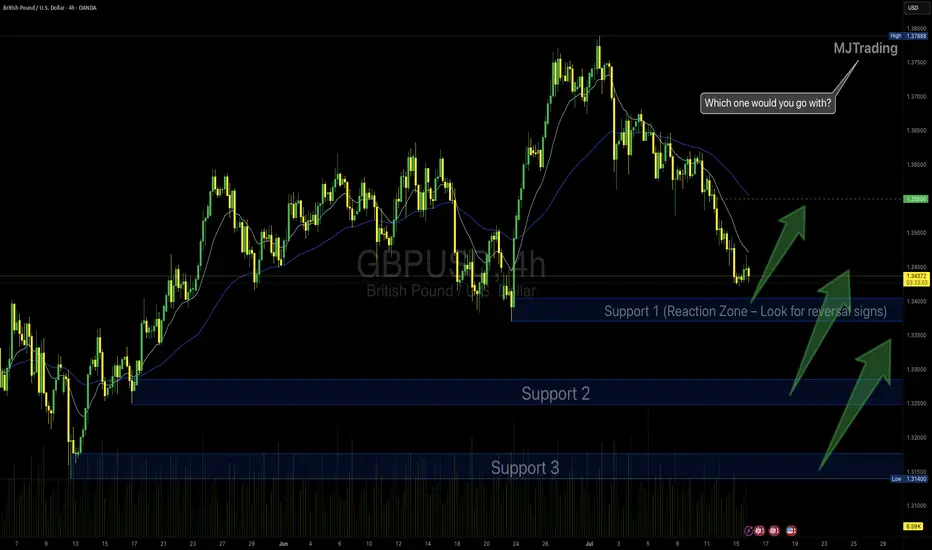
GBPUSD Idea – Demand Zones & Potential Reversal Play🧠 MJTrading:
After a steady downtrend, GBPUSD is now approaching a strong 4H demand zone (Support 1), where we previously saw explosive bullish reactions.
Price is also extended from both EMAs, showing potential for a technical pullback or full reversal.
💡Scenarios to consider:
🔹 If Support 1 holds → we may see a bounce toward 1.3500+
🔹 If broken → Support 2 & 3 offer deeper liquidity and high-probability demand zones
👀 Watch for:
Bullish reversal candles (engulfing / hammer)
Bullish divergence on lower timeframes
Volume spikes on reaction
⚠️ Invalidation:
If Support 3 breaks with strong momentum, we might enter a bearish continuation phase.
#GBPUSD #Forex #ChartDesigner #SmartMoney #PriceAction #MJTrading #ForexSetup #TrendReversal #SupportZones
BTC FORECASTExpected push to the downside(below 114,400 region)
Breakout above current marked high.
Expected ATH(125,000) as target.
Best Regards,
Gideon Stephen (GS)
#bitcoin #crypto
Need a trading strategy to avoid FOMO
Hello, traders.
If you "Follow", you can always get new information quickly.
Have a nice day today.
-------------------------------------
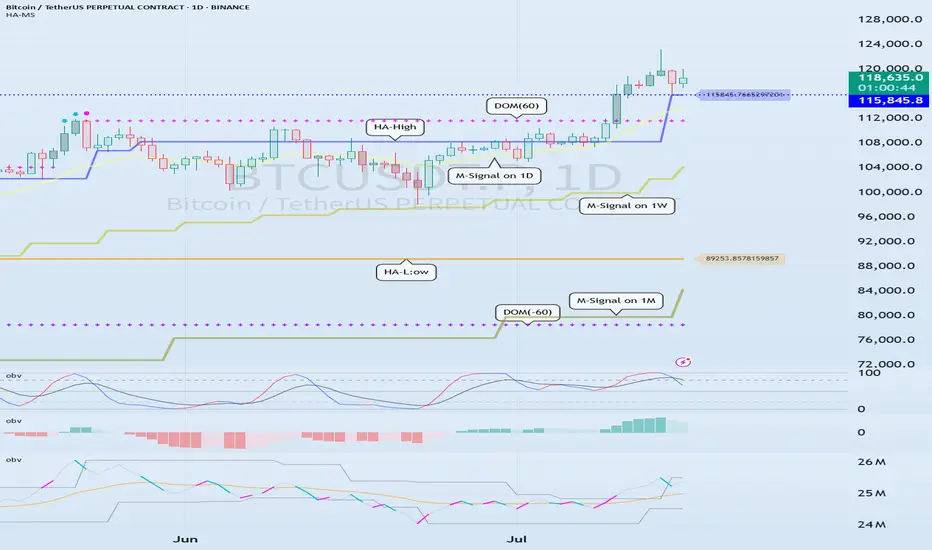
1D chart is the standard chart for all time frame charts.
In other words, if you trade according to the trend of the 1D chart, you can make profits while minimizing losses.
This can also be seen from the fact that most indicators are created based on the 1D chart.
In that sense, the M-Signal indicators of the 1M, 1W, and 1D charts are suitable indicators for confirming trends.
If the price is maintained above the M-Signal indicator of the 1M chart, it is highly likely that the upward trend will continue in the medium to long term, so it is recommended to take note of this advantage especially when trading spot.
The M-Signal indicator on the 1W, 1D chart shows the medium-term and short-term trends.
The M-Signal indicator uses the MACD indicator formula, but it can be seen as a price moving average.
You can trade with just the price moving average, but it is difficult to select support and resistance points, and it is not very useful in actual trading because it cannot cope with volatility.
However, it is a useful indicator when analyzing charts or checking general trends.
Therefore, what we can know with the M-Signal indicator (price moving average) is the interrelationship between the M-Signal indicators.
You can predict the trend by checking how far apart and close the M-Signal indicators are, and then checking the direction.
-
If you have confirmed the trend with the M-Signal indicator, you need support and resistance points for actual trading.
Support and resistance points should be drawn on the 1M, 1W, and 1D charts.
The order of the roles of support and resistance points is 1M > 1W > 1D charts.
However, the strength of the role of support and resistance points can be seen depending on how long the horizontal line is.
Usually, in order to perform the role of support and resistance points, at least 3 candles or more form a horizontal line.
Therefore, caution is required when trading when the number of candles is less than 3.
The indicators created considering this point are the HA-Low and HA-High indicators.
The HA-Low and HA-High indicators are indicators created for trading on the Heikin-Ashi chart and indicate when the Heikin-Ashi candle turns upward or downward.
Therefore, the creation of the HA-Low indicator means that there is a high possibility of an upward turn.
In other words, if it is supported by the HA-Low indicator, it is a time to buy.
However, if it falls from the HA-Low indicator, there is a possibility of a stepwise decline, so you should also consider a countermeasure for this.
The fact that the HA-High indicator was created means that there is a high possibility of a downward turn.
In other words, if there is resistance from the HA-High indicator, it is a time to sell.
However, if it rises from the HA-High indicator, there is a possibility of a stepwise upward turn, so you should also consider a countermeasure for this.
This is where a dilemma arises.
What I mean is that the fact that the HA-High indicator was created means that there is a high possibility of a downward turn, so you know that there is a high possibility of a downward turn, but if it receives support and rises, you think that you can make a large profit through a stepwise upward turn, so you fall into a dilemma.
This is caused by greed that arises from falling into FOMO due to price volatility.
The actual purchase time should have been when it showed support near the HA-Low indicator, but when it showed a downward turn, it ended up suffering a large loss due to the psychology of wanting to buy, which became the trigger for leaving the investment.
Therefore, if you failed to buy at the purchase time, you should also know how to wait until the purchase time comes.
-
It seems that you can trade depending on whether the HA-Low and HA-High indicators are supported, but the task of checking whether it is supported is quite difficult and tiring.
Therefore, to complement the shortcomings of the HA-Low and HA-High indicators, the DOM(60) and DOM(-60) indicators were added.
The DOM(-60) indicator indicates the end of the low point.
Therefore, if it shows support in the DOM(-60) ~ HA-Low section, it is the purchase time.
If it falls below the DOM(-60) indicator, it means that a stepwise downtrend is likely to begin.
The DOM(60) indicator indicates the end of the high point.
Therefore, if it is supported and rises in the HA-High ~ DOM(60) section, it means that a stepwise uptrend is likely to begin.
If it is resisted and falls in the HA-High ~ DOM(60) section, it is likely that a downtrend will begin.
With this, the basic trading strategy is complete.
This is the basic trading strategy of buying when it rises in the DOM(-60) ~ HA-Low section and selling when it falls in the HA-High ~ DOM(60) section.
For this, the trading method must adopt a split trading method.
Although not necessarily, if it falls in the DOM(-60) ~ HA-Low section, it will show a sharp decline, and if it rises in the HA-High ~ DOM(60) section, it will show a sharp rise.
Due to this volatility, psychological turmoil causes people to start trading based on the price, which increases their distrust in the investment market and eventually leads them to leave the investment market.
-
When looking at the movement of the 1D chart, it can be seen that it is not possible to proceed with trading at the moment because it is already showing a stepwise upward trend.
However, since there is a SHORT position in futures trading, trading is possible at any time.
In any case, it is difficult to select a time to buy because the 1D chart shows a stepwise upward trend.
However, looking at the time frame chart below the 1D chart can help you select a time to buy.
The basic trading strategy is always the same.
Buy when it rises in the DOM(-60) ~ HA-Low section and sell when it falls in the HA-High ~ DOM(60) section.
Currently, since the 1D chart is continuing a stepwise upward trend, the main position is to eventually proceed with a long position.
Therefore, if possible, you should focus on finding the right time to buy.
However, if it falls below the HA-High indicator of the 1D chart, the possibility of a downtrend increases, so at that time, you should focus on finding the right time to sell.
In other words, since the HA-High indicator of the current 1D chart is generated at the 115845.8 point, you should think of different response methods depending on whether the price is above or below the 115845.8 point.
Therefore, when trading futures, increase the investment ratio when trading with the main position (a position that matches the trend of the 1D chart), and decrease the investment ratio when trading with the secondary position (a position that is different from the trend of the 1D chart) and respond quickly and quickly.
When trading in the spot market, you have no choice but to trade in the direction of the 1D chart trend, so you should buy and then sell in installments whenever it shows signs of turning downward to secure profits.
In other words, buy near the HA-Low indicator on the 30m chart, and if the price rises and the HA-High indicator is created, sell in installments near that area.
-
You should determine your trading strategy, trading method, and profit realization method by considering these interrelationships, and then trade mechanically accordingly.
If you trade only with fragmentary movements, you will likely end up suffering losses.
This is because you do not cut your losses.
-
Thank you for reading to the end.
I hope you have a successful trade.
--------------------------------------------------
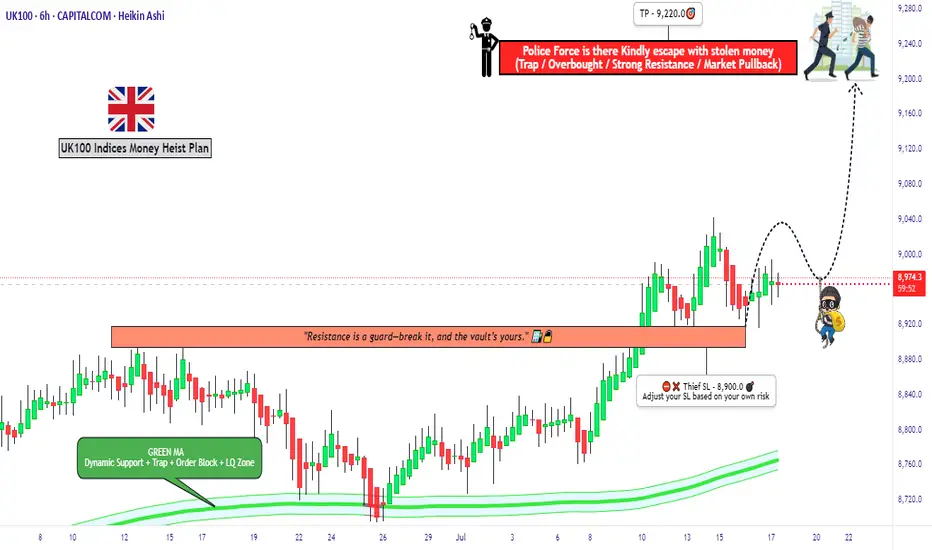
"UK100 Bulls Vault Open! Grab the Loot & Escape Early"🏴☠️💰"UK100 / FTSE100 Market Heist Blueprint" – A Thief Trading Operation for High-Profit Target Extraction 💼📈
🌍 Hola! Hi! Bonjour! Ola! Hallo! Marhaba!
To all the Market Robbers, Smart Thieves, and Strategic Money Makers — welcome to another Thief Trading Heist Plan™.
Ready your gear and charts — the UK100 / FTSE100 index is our next vault.
🔥Heist Objective: Swipe the Bullish Loot Before the Police Trap Hits! 🔥
Based on sharp Thief-style technical and macro-fundamental analysis, the market is showing bullish exhaustion and early signs of trap reversal zones. Our goal is clear: extract max value from the bulls and escape before the heat catches on.
🚨The current price action is nearing a Red Zone — high-risk area filled with potential police traps (supply zones, resistance, and bear setups). Timing and smart entries are key.
🎯 Strategy Overview (Day/Swing Trade)
Entry Plan:
🟢 “The Vault’s Open!” – Start accumulating long positions now or set buy limits near recent 15m/30m swing lows. Layer your entries (DCA method) for better control and efficiency.
Stop Loss (SL):
🔐 SL below recent swing low on 4H timeframe (~8900.0)
Adjust based on your risk appetite, position size, and how many layered orders you've got lined up.
Target Zone (TP):
🏁 Primary Target: 9220.0
Always be ready to exit early if market signals shift. He who escapes lives to rob another day.
🧲 Scalpers Note:
Only operate long within this framework. Big capital players can jump in earlier; others can trail behind with the swing traders. Always use trailing SLs to lock in stolen loot and reduce exposure.
📰 What's Driving the Market?
Current bullish sentiment is backed by:
Fundamental strength
Sentiment & COT reports
Macro data & intermarket correlation
Geopolitical & institutional flow analysis
Stay updated through your reliable sources and plug into key market dynamics and positioning reports.
⚠️ Trading Precaution:
🚫 Avoid new positions during high-impact news
💼 Manage your trades with care
🔁 Use trailing SLs to secure profits during volatility
💥Boost the Robbery – Support the Crew💥
If this heist plan aligns with your mission, smash that Boost button. Support the thief movement, and let’s build a strong trading crew where money is made with precision, strategy, and no mercy. 💰🤑
🔒 Final Notes (Read Before You Rob):
📌 This is a strategic trade setup, not financial advice. Always tailor the plan based on your risk management, capital size, and market conviction.
📌 Markets evolve. Stay alert, adapt fast, and trade like a thief — unseen, smart, and always two steps ahead.
💬Drop your thoughts, results, or setups below — and if you're in, type "HEIST READY" in the comments.
Stay tuned, another plan is on the way... 🏴☠️📊🔥
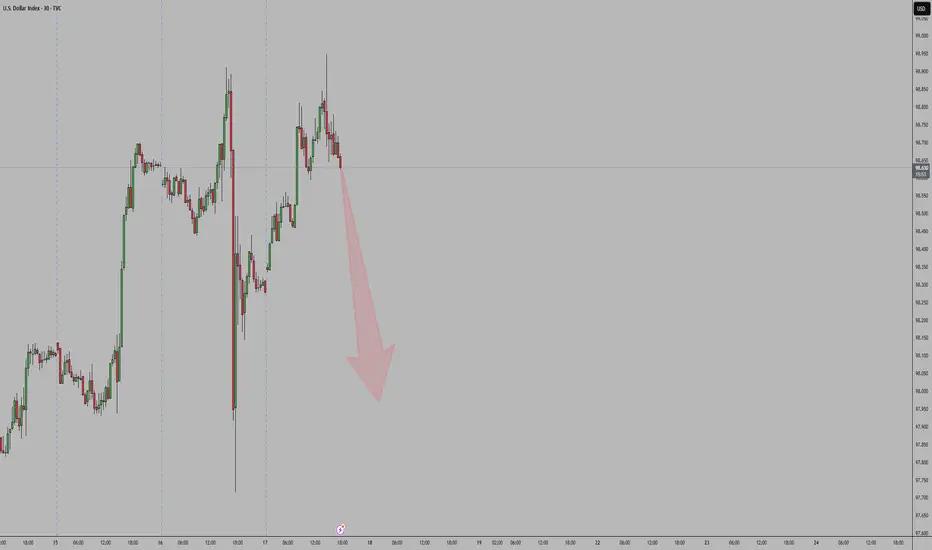
DXYShort-Term Bearish DXY – Key Reasons
1. Rate Cut Expectations
Markets are pricing in at least one Fed rate cut in Q3 2025 due to slowing inflation and weaker consumer data.
Lower interest rates reduce demand for the dollar, pushing DXY lower.
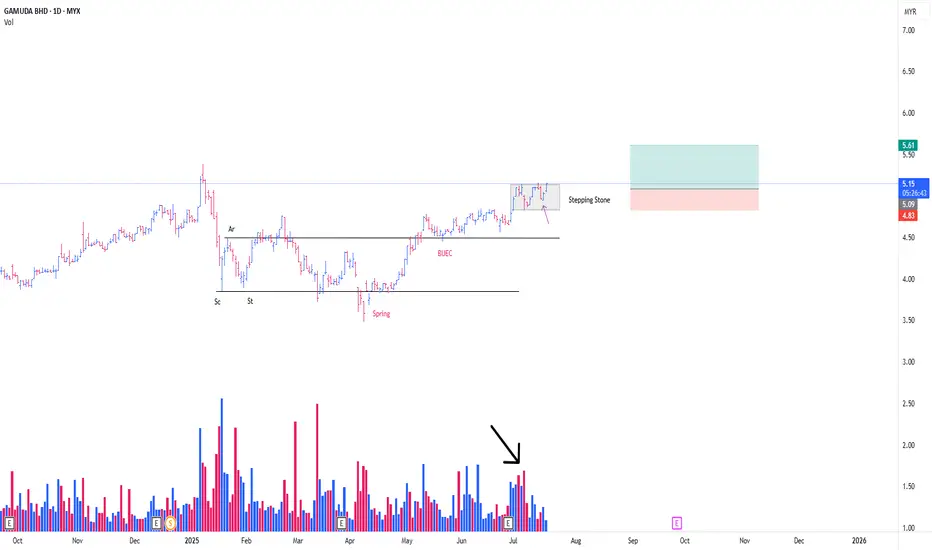
GAMUDA CONT MARKING UP PHASEThis is a continuation from my prev post
**Refer to the link below
This is a play coming from the Stepping Stone (SS)
-SS is a term, in wcykoff methode , particularly describing a momentarily 'pause' in between, consecutive mark up phase.
Absoprtion detected from the on going SS
*Black arrow
with the possibility of Trigger Bar today, in the background of SpringBoard Schematic #2 *Purple arrow
-Position initiated as attached
PureWyckoff

Safe Entry IONQGreen Zone is Safe Entry.
Stop loss below Green Zone (or blue line both are supports with 200MA below too).
Red Zone is Sell.
Note: each line(E.g. blue lines) acts as Strong Support/Resistance.
Note: 1- Potentional of Strong Buying Zone:
We have two scenarios must happen at The Mentioned Zone:
Scenarios One: strong buying volume with reversal Candle.
Scenarios Two: Fake Break-Out of The Buying Zone.
Both indicate buyers stepping in strongly. NEVER Join in unless one showed up.
2- How to Buy Stock (safe way):
On 1H TF when Marubozu/Doji Candle show up which indicate strong buyers stepping-in.
Buy on 0.5 Fibo Level of the Marubozu/Doji Candle, because price will always and always re-test the

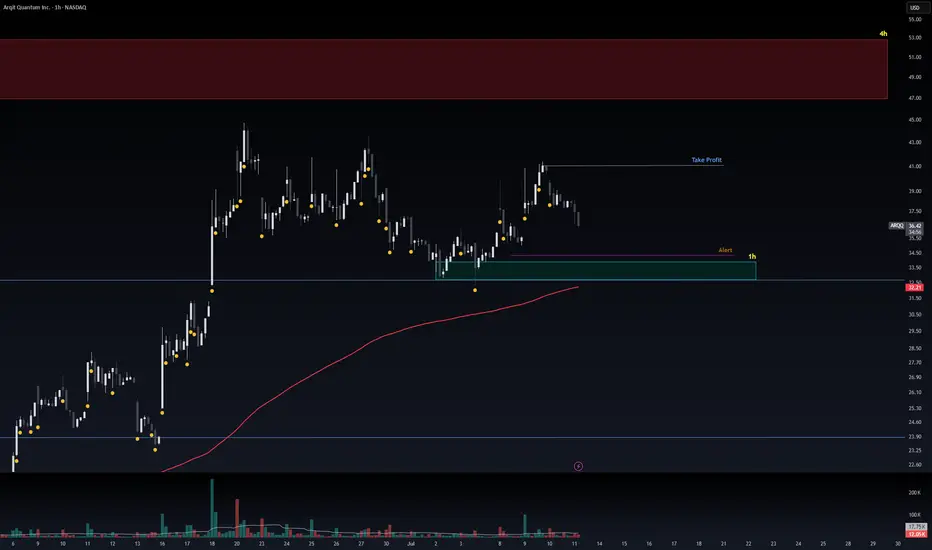
Safe Entry Zone ARQQGreen Zone is Safe Entry.
Stop loss below Green Zone (or blue line both are supports with 200MA below too).
Note: 1- Potentional of Strong Buying Zone:
We have two scenarios must happen at The Mentioned Zone:
Scenarios One: strong buying volume with reversal Candle.
Scenarios Two: Fake Break-Out of The Buying Zone.
Both indicate buyers stepping in strongly. NEVER Join in unless one showed up.
2- How to Buy Stock (safe way):
On 1H TF when Marubozu/Doji Candle show up which indicate strong buyers stepping-in.
Buy on 0.5 Fibo Level of the Marubozu/Doji Candle, because price will always and always re-test the
Crude Oil Setup in ProgressOil is in an uptrend, and I expect it to continue.
At the moment, the stop-loss would be too wide — around 3.5%, which is a bit too much for my portfolio, especially considering I already have a wide stop on palladium.
On the 1-hour chart, I’m watching for a possible entry slightly below the current level. For now, just observing.

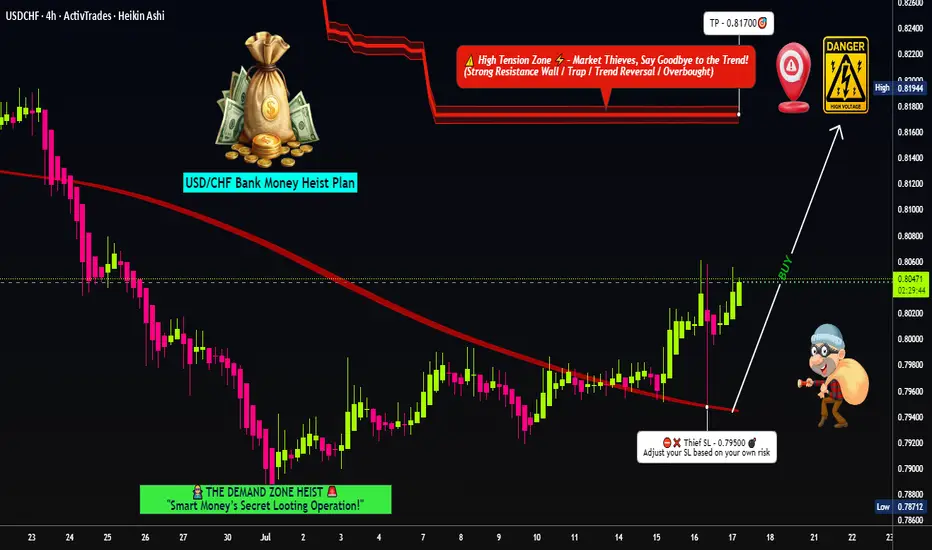
USD/CHF Swissie Heist Plan: Rob the Trend, Ride the Bull!🔐💰 USD/CHF Swissie Forex Heist 💰🔐
“Rob the Trend, Escape the Trap – Thief Style Day/Swing Master Plan”
🌎 Hola! Hello! Ola! Marhaba! Bonjour! Hallo!
Dear Market Looters, Swing Snipers & Scalping Shadows, 🕶️💼💸
Welcome to another elite Thief Trading Operation, targeting the USD/CHF "SWISSIE" vault with precision. Based on sharp technical blueprints & macroeconomic footprints, we're not just trading – we're executing a Forex Bank Heist.
This robbery mission is based on our day/swing Thief strategy – perfect for those who plan, act smart, and love stacking pips like bricks of cash. 💵🧱
💹 Mission Brief (Trade Setup):
🎯 Entry Point – Open the Vault:
Swipe the Bullish Loot!
Price is prepped for an upside raid – jump in at any live price OR set smart Buy Limit orders near the 15m/30m recent pullback zones (last swing low/high).
Use DCA / Layering for better entries, thief-style.
🧠 Thief Logic: Let the market come to you. Pullbacks are entry doors – robbers don’t rush into traps.
🛑 Stop Loss – Exit Strategy If Caught:
📍 Primary SL: Below recent swing low on the 4H chart (around 0.79500)
📍 Adjust based on lot size, risk, and number of stacked entries.
This SL isn’t your leash – it’s your getaway route in case the plan backfires.
🏴☠️ Profit Target – Escape Before the Cops Arrive:
🎯 Target Zone: 0.81700
(Or dip out earlier if the vault cracks fast – Robbers exit before alarms trigger!)
📌 Trailing SL recommended as we climb up the electric red zone.
🔥 Swissie Heist Conditions:
📈 USD/CHF showing upward bias based on:
Momentum shift
Reversal zone bounce
Strong USD sentiment & macro factors
✅ COT positioning
✅ Intermarket correlations
✅ Sentiment & Quant data
➡️ Do your fundamental recon 🔎
⚔️ Scalpers – Here's Your Mini-Mission:
Only play LONGS. No counter-robbing.
💸 Big bags? Enter with aggression.
💼 Small stack? Follow the swing crew.
💾 Always trail your SL – protect the stash.
🚨 News Alert – Avoid Laser Alarms:
🗓️ During high-volatility releases:
⚠️ No new trades
⚠️ Use trailing SLs
⚠️ Watch for spikes & fakeouts – the vault traps amateurs
💣 Community Boost Request:
If this plan helps you loot the market:
💥 Smash that Boost Button 💥
Let’s strengthen the Thief Army 💼
The more we grow, the faster we move, and the deeper we steal. Every like = one more bulletproof trade.
#TradeLikeAThief 🏆🚨💰
📌 Legal Escape Note:
This chart is a strategic overview, not personalized advice.
Always use your judgment, manage risk, and review updated data before executing trades.
📌 Market is dynamic – so keep your eyes sharp, your plan tighter, and your strategy ruthless.
🕶️ Stay dangerous. Stay profitable.
See you soon for the next Forex Vault Hit.
Until then – Lock. Load. Loot.
"FRA40/CAC40 HEIST! Bullish Loot Before Bear Trap – Act Fast!"💰 FRA40/CAC40 "FRANCE40" INDEX HEIST – THIEF TRADING STYLE MASTER PLAN 🏴☠️🚀
🔥 Steal the Market Like a Pro – Bullish Loot & Escape Before the Trap! 🔥
🤑 GREETINGS, FELLOW MONEY MAKERS & MARKET ROBBERS!
🌟 Hi! Hola! Ola! Bonjour! Hallo! Marhaba! 🌟
This is your VIP invite to the ultimate FRA40/CAC40 heist! Based on the 🔥Thief Trading Style🔥, we’re locking in a bullish raid before the bears set their trap. Time to swipe the loot & escape like a pro!
📜 THE HEIST BLUEPRINT – TECHNICAL & FUNDAMENTAL RAID PLAN
🎯 ENTRY POINT: "THE VAULT IS OPEN!"
📈 Long Entry: The market’s handing out free cash—swipe bullish positions at any price!
🔄 Pro Thief Move: Use buy limit orders within 15-30 min timeframe for pullback entries.
🎲 DCA/Layering Strategy: Deploy multiple limit orders to maximize loot & minimize risk.
🛑 STOP LOSS – SAFETY NET FOR THIEVES
SL at Nearest Swing Low (4H TF): 7650.00 (Adjust based on your risk, lot size & entry layers).
⚠️ Warning: Bears are lurking—don’t get caught in their trap!
🏆 TAKE PROFIT – ESCAPE BEFORE THE POLICE ARRIVE!
🎯 Primary Target: 8060.00 (or exit early if the market turns sketchy).
🚨 Danger Zone: Yellow MA Zone (Overbought, Reversal Risk, Bear Trap!)
📡 FUNDAMENTAL BACKUP – WHY THIS HEIST WILL WORK
💰 France40 is riding bullish momentum due to:
Strong Macro Data (Eurozone recovery signals)
Institutional Buying (COT Report Insights)
Geopolitical Calm (For Now… Stay Alert!)
Index-Specific Strength (Tech & Luxury Stocks Leading)
🔗 For full analysis (Fundamentals, COT, Intermarket Trends, Sentiment Score):
👉 Check the Liinkk 🔗! 👈
🚨 TRADING ALERT – NEWS & POSITION MANAGEMENT
📰 High-Impact News = Market Chaos! Protect Your Loot:
❌ Avoid new trades during major news drops.
🔐 Use Trailing Stops to lock profits & dodge sudden reversals.
💥 BOOST THE HEIST – SUPPORT THE MISSION!
🚀 Hit the "Boost" button to strengthen our robbery squad!
💰 More boosts = More profitable raids!
🎉 Let’s dominate the market daily with the Thief Trading Style!
🔐 DISCLAIMER (LEGAL SAFETY NET)
This is NOT financial advice—just a strategic raid plan. Trade at your own risk. Markets change fast; adapt or get caught!
🤑 Stay tuned for the next heist… The vaults won’t rob themselves! 🐱👤💨

gold daily bias today (17th july 2025)Daily remains bullish within a bullish BOS. 4H structure confirms the same — only reacting if price invalidates the bullish setup.
For BUYS (Scenario 1 – Deep Retracement Buy):
1️⃣ Price retests the 3320.651 – 3311.381 zone.
2️⃣ Form a 1/3M bullish CHOCH with a body candle close.
3️⃣ Retest the level and BUY toward 3349.077.
For BUYS (Scenario 2 – Intraday Structure Flip):
1️⃣ Price forms a 15M bullish CHOCH with body candle close.
2️⃣ Retest the 15M BOS using a 2/3M bullish CHOCH.
3️⃣ Confirm the retest and BUY toward 3349.077.
For SELLS (Scenario 3 – BOS Break + Shift):
1️⃣ Break below 3320.651 – 3311.381 with a strong 1H momentum candle.
2️⃣ Pull back to the broken zone.
3️⃣ Form a 1/3M bearish CHOCH after retest and SELL toward 3298.508.

Ethereum Primed for Breakout as Institutional Interest SurgesBlackRock's aggressive ETH accumulation—$276M in February, $98M just this week—signals institutional conviction as Ethereum approaches a breakout towards $3,000. With real-world asset (RWA) tokenization exploding to $21B+ (Ethereum commanding 59% market share) and stablecoin volume hitting record $717B monthly highs, ETH is positioned as the backbone of traditional finance's blockchain migration.
The convergence of institutional buying, technical breakout signals, and Ethereum's dominance in the fastest-growing crypto sectors creates a perfect storm for the next major price surge 🚀
intel.arkm.com

Opening (IRA): IBIT July 25th 48 Short Put... for a .48 credit.
Comments: The highest 30-day IV on my ETF board (aside from USO and UNG). Laddering out, targeting the strike paying around 1% of the strike price in credit.

ETH/BTC TURBO LONGTurbomax gigaslam the fucking BUY button
Elliot Wave 12345
WITHIN 12345 MACRO WAVE
INCREDBILE RedCloud Break
INCREDIBLE GreenCloud Support
FIBS as level targets
DECEMBER 8-16TH WARNING ZONE VIA TIME
BUY BUY BUY BUY BUY BUY BUY

Oh CANDADA!🇨🇦A simple idea, which I will gradually fill with life:
Act 1:
-> the 🇨🇦CAD comes to life.
📊🔮🇺🇲 US retail sales, which will be published today at 2:30 pm, will be higher than expected by the consensus.
Further acts and updates will be follow✅️

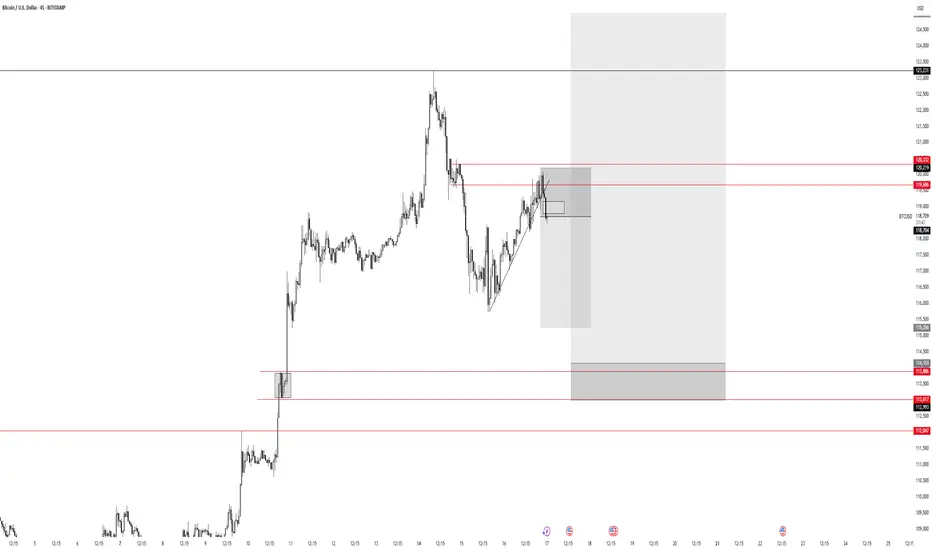
BTC sideways above 115k💎 BTC PLAN UPDATE (July 17)
NOTABLE NEWS ABOUT BTC
Bitcoin Price Forecast: BTC Recovers as Trump Steps In to Revive Crypto Legislation Momentum
Bitcoin (BTC) saw a mild recovery, trading around $119,000 at the time of writing on Wednesday, after falling nearly 2% the previous day. This rebound followed an announcement by U.S. President Donald Trump on Wednesday morning, stating that the GENIUS Act is ready to be passed by the House during the legislative “Crypto Week”, sparking optimism in the crypto market. Furthermore, institutional demand continues to grow, with spot Bitcoin ETFs recording over $400 million in inflows on Tuesday, extending the growth streak since July 2.
TECHNICAL ANALYSIS
🧠 Pattern Overview:
The chart clearly displays an Elliott Wave pattern (1) → (2) → (3) → (4) → (5) along with Fibonacci Retracement and Extension levels, helping to identify potential support and resistance zones.
1. Elliott Waves:
Wave (3) was completed around the $122,144 zone and the market is currently in the corrective wave (4).
Wave (5) is expected to move upward with targets at:
• 1.618 Fibonacci Extension: ~$127,404
• Or further: ~$130,747
2. Support Zone (grey area below):
Located around $115,000 – $116,000, which is:
• The 0.5 – 0.618 retracement of Wave (3)
• Aligned with the EMA200 and dotted black trendline support.
If the price falls into this area, it’s highly likely to bounce back and form Wave (5).
3. Danger Zone if Broken:
If this support fails, price may fall deeper to:
• $113,200 (0.786 retracement),
• Or even lower: $111,600 – $111,800
4. Potential Scenarios:
Two main outcomes:
• Continued Uptrend: Price bounces from the support zone and heads toward $127,000 – $130,000
• Breakdown: If the support breaks, a deeper decline may occur, breaking the wave structure.
Follow the channel for continuous and up-to-date analysis on XAUUSD, CURRENCIES, and BTC.
