Bullish CHF/JPY Heist! Risk vs. Reward Setup💰 SWISS-YEN BANK HEIST! 🚨 CHF/JPY Bullish Raid Plan (Risk & Reward Setup)
🌟 Attention Market Pirates & Profit Raiders! 🌟
"The vault is unlocked—time to loot!"
🔎 THIEF TRADING ANALYSIS (CHF/JPY)
Entry (📈): "The Bullish Loot is LIVE!"
Buy limit orders within 15-30min pullbacks (recent swing lows/highs).
Aggressive? Enter anywhere—heist mode activated!
Stop Loss (🛑): Recent swing low (wick) – adjust based on your risk & lot size!
🎯 Target: 186.300 (High-risk Red Zone – Police Resistance!)
Overbought? Reversal risk? Bears lurking? Yes. But thieves play smart!
🏴☠️ SCALPERS & SWING RAIDERS:
Scalp ONLY Long (Use trailing SL to lock profits).
Low on ammo? Join swing traders for the big heist!
📡 FUNDAMENTAL BACKUP (Why This Heist?)
Bullish momentum in play (check COT, Macro, Sentiment).
News Alert (⚠️): Avoid new trades during high-impact news—trail your SL!
💥 BOOST THE HEIST!
Hit 👍 LIKE & 🔄 SHARE to strengthen our robbery squad!
More heists coming—stay tuned! 🚀
⚠️ DISCLAIMER:
Not financial advice. Risk = Reward. Adjust SL/targets based on your strategy. Market conditions change—adapt or get caught!
Beyond Technical Analysis

NQ Weekly Recap-Projection 13.07.2025NQ Weekly Recap + Outlook
1️⃣ Recap:
NQ made a new All-Time High, but the breakout ended up being a deviation. Price got rejected and started pulling back.
This signals potential weakness and suggests price may want to explore lower levels.
2️⃣ Bearish Scenario:
📍Target: Daily Swing low (Blue line)
📍Deeper target: Weekly Fair Value Gap (Purple zone)
I’ll look for LTF confirmations around these zones to position for potential longs.
3️⃣ Bullish Catalyst Watch:
There’s increasing speculation that Powell may resign this week.
If that happens, we could see:
✅ Strong bullish momentum
✅ Little to no retracement
✅ Immediate push into new ATHs
Weekly Plan Summary:
🔸 Scenario 1 - Pullback Continuation:
Look for reactive long setups at Daily Swing or W FFVG zone.
🔸 Scenario 2 - Powell Resignation:
Expect a breakout move with momentum — potentially no retrace.
Stay nimble. Trade what the chart confirms, not what the news promises.

Flawless ExecutionA picture-perfect trade on CRYPTOCAP:BTC from start to finish. 🎯
The Plan: Wait for the breakout above resistance.
The Result: A powerful move straight through our target zone.
Clean analysis, clean execution, clean profits. On to the next one.
#Bitcoin #Trading #Crypto #TechnicalAnalysis #BTC

XRP/USD: "Bandit’s Breakout" – MA Confirms the Profit Raid!🔥 XRP/USD HEIST ALERT: The Bullish Bank Robbery Plan (MA Breakout Strategy) 🔥
🌟 Attention, Market Pirates & Profit Bandits! 🌟
"The best traders are just thieves with a calculator."
🚨 Mission Brief (XRP/USD):
Based on Thief Trading tactics, we’re plotting a bullish heist on Ripple. High-risk, high-reward—police traps, fakeouts, and overbought zones be damned!
📌 ENTRY ZONE (Breakout or Pullback Heist)
"The heist begins at MA breakout!"
Buy Stop: Above 2.2200 (confirmed candle close).
Buy Limit: Near swing lows (15m/30m pullback).
🚨 Set an ALERT! Don’t miss the breakout.
🛑 STOP LOSS (Escape Route)
"No stop loss till breakout—then hide it like stolen cash!"
Thief SL: Nearest swing low (3H candle wick) ~2.1000.
Rebels adjust at own risk—your funeral, not mine. 😎
🎯 TARGETS (Profit Hideouts)
First Escape: 2.2400 (scalp & run).
Swing Bandits: Ride longer (trail SL advised).
⚡ SCALPERS’ NOTE:
Longs ONLY. Rich? Go all-in. Broke? Join swing heists.
Trailing SL = Your getaway car.
📡 MARKET CONTEXT (Why This Heist?)
Bullish momentum + consolidation breakout play.
Fundamentals? Check COT, on-chain, macro trends (check everything here 👉🔗🔗).
🚨 NEWS WARNING (Avoid Police Raids)
Avoid new trades during high-impact news.
Trailing stops = Your invisible cloak.
💥 BOOST THE HEIST!
"Like & Boost this idea—strengthen our robbery squad! More alerts = more stolen profits. 🚀💰
Next heist coming soon… Stay greedy, thieves. 😈

Looking for catalysts - Gold Outlook July 7 - July 11, 2025All about last week you can find here:
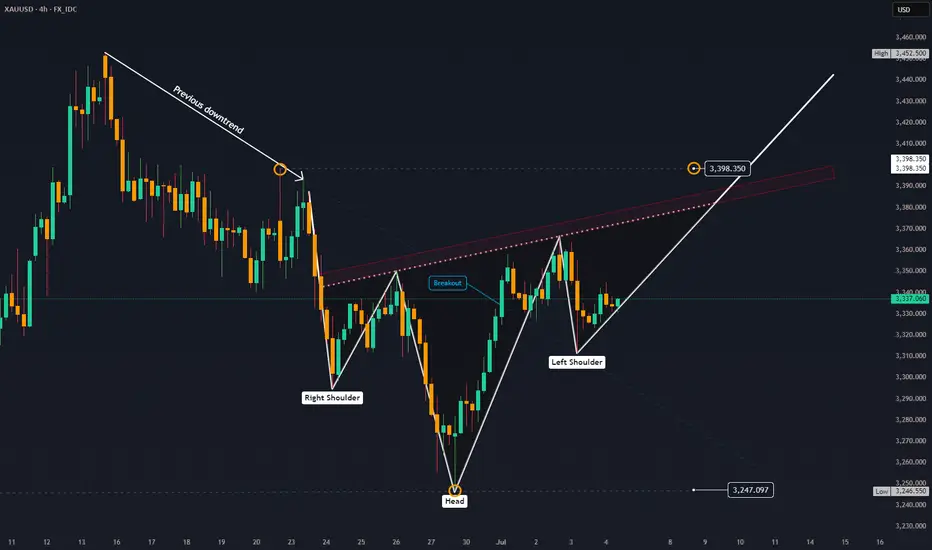
FX_IDC:XAUUSD Gold is currently seeking fresh catalysts this week. 🧐
While the economic calendar appears light for this time of year, a lack of economic data doesn't mean nothing is happening. Geopolitical events, especially tariff wars or other flashpoints, remain significant. Are there increasing signs for peace in the Middle East between Israel and Hamas? 🕊️
This week Gold could take advantage from an exisiting reversal head and shoulders pattern and painting pitchfork in the chart shows possibillities for Upside targeting $3400.
## Geopolitical News Landscape 🌍📰
Israel / Iran ⚔️🛑☢️
After fierce clashes in June, a **ceasefire** began June 24. 🇮🇷 Iran's Supreme Leader reappeared July 6, claiming victory 🎤. Tehran has now **banned IAEA inspectors** ❌🔍. Over 900 Iranians reportedly killed ⚰️.
🔮 Outlook: ⚠️ Nuclear tensions growing, diplomacy frozen 🧊. Regional powers remain on high alert 🚨.
India / Pakistan 🗻🔫🕌
Tense calm in Kashmir 😐. India launched its sacred **Amarnath Yatra** 🕉️ under heavy security 🛡️. Pakistan killed 30 militants near the Afghan border ⚔️, while China 🐉 admitted sharing intel 📡.
🔮 Outlook: Diplomatic track stays open 🕊️, but **border flare-ups** and water disputes 💧 remain volatile 🔥.
Gaza Conflict 💣🏘️🕊️
Israel launched deadly airstrikes ✈️, including one on a beach café ☕🏖️ killing 22. Dozens more died 💔. IDF admitted accidental strikes on aid sites 🚚❌. U.S.-led talks seek a **60-day truce** 🤝.
🔮 Outlook: Ceasefire possible 🛑, but **humanitarian crisis** worsening 🚨🩺. Trust remains fragile 💔.
Russia / Ukraine ⚔️
Zelenskyy 🇺🇦 and Trump 📞 discussed new air defense aid 🎯. Russia answered with **massive drone strikes** on Kyiv 🚁🔥. NATO boosts arms shipments 🔫 and backs Ukraine’s domestic weapons production 🏭.
🔮 Outlook: War grinds on ⚙️. No peace in sight, with **global stakes** rising 📈.
U.S. / China Trade War 💼📦🔥
With new tariffs looming 📆💣, Treasury said “multiple deals” are near 🤝. Trump claimed a **partial deal with China** 🐉, though tariffs remain high 📊.
🔮 Outlook: More piecemeal deals 🍰, but a **full-scale trade reset** looks unlikely before elections 🗳️.
🌍 Global Trade War 📉🚢💸
Trump’s shifting tariffs 🎯 hurt global growth 🌐. Markets hit record highs 📈 but investment chills ❄️. The 💵 dollar had its sharpest 6-month drop 📉 in decades.
🔮 Outlook: Businesses remain cautious ⚠️. **Supply chains** reroute 🔄. No global rebound without clarity 🔍.
Trump vs. Powell 💥🏛️📉
Trump demanded Powell’s resignation ❌📉, accusing him of weak rate policy 📊. Powell held firm 🧊, citing inflation risks 📈. Trump eyes replacements 👀🪑.
🔮 Outlook: Fed independence 🏛️ under fire 🔥. **Rate policy** may get politicized ahead of 2025 elections 🗳️.
📈 U.S. Inflation 🛒💰🧾
Inflation slowed to 0.1% 🐢, but tariffs raised prices on appliances 🔌 (+4.3%) and toys 🧸. Fed projects 3% inflation by year-end 📊.
🔮 Outlook: As **tariffs bite** 🦷, inflation likely to climb 📈. Fed stays cautious 🧐 on cuts.
Technical View 📐📈
Analysis Period: May 25 - June 6, 2025 | Forecast: June 7-11, 2025
1. ICT (Inner Circle Trader) Methodology Analysis 🧠
Market Structure
Higher Timeframe Bias: The chart shows a clear bullish market structure with higher highs and higher lows from the major low around 3,250. 🐂
Current Structure: Price is in a consolidation phase after reaching highs near 3,370, showing potential distribution. ⚖️
Key ICT Concepts Identified:
Fair Value Gap (FVG): Multiple gaps visible during the strong rally from 3,250 to 3,370. 💨
Order Blocks: Significant demand zone around 3,250-3,260 level (major accumulation area). 📦
Liquidity Zones:
Buy-side liquidity above 3,370 (recent highs). 💸
Sell-side liquidity below 3,320 (recent consolidation lows). 📉
Market Maker Models: Classic accumulation-manipulation-distribution pattern visible. 🔄
Session Analysis:
London Session: Shows strong directional moves. 🇬🇧
New York Session: Continuation of trends with increased volatility. 🗽
Asian Session: Consolidation and range-bound behavior. 🌏
2. Gann Analysis 🧙♂️
Gann Angles & Time Cycles:
Primary Trend: 1x1 angle supporting the bullish move from 3,250. ↗️
Resistance Angles: 2x1 and 3x1 angles providing resistance around current levels. 🚧
Time Cycles:
7-day cycle showing completion around June 2-3. 🗓️
14-day cycle suggesting potential reversal window June 7-9. ⏳
Gann Price Levels:
Major Support: 3,250 (1/8 level). 🛡️
Current Resistance: 3,370 (7/8 level). 🛑
Next Target: 3,400 (full octave completion). 🎯
Geometric Relationships:
Price squared relationship suggests 3,380-3,400 as natural resistance. 📐
Time-price balance indicates consolidation period before next major move. 🕰️⚖️
3. Fibonacci Analysis ✨
Retracement Levels (from 3,250 low to 3,370 high):
23.6%: 3,341.6
38.2%: 3,324.2
50.0%: 3,310.0
61.8%: 3,295.8
78.6%: 3,265.6
Extension Levels:
127.2%: 3,402.6
161.8%: 3,444.2
200.0%: 3,490.0
Current Analysis:
Price has respected the 23.6% retracement level multiple times. ✅
Strong support confluence at 38.2% level (3,324). 💪
Extension targets suggest potential move to 3,402-3,444 range. 🚀
4. Institutional Levels Analysis 🏦
Psychological Levels:
3,300: Major round number providing support. 💯
3,350: Mid-level resistance. 📊
3,400: Next major psychological target. 🎯
Institutional Order Flow:
Accumulation Zone: 3,250-3,280 (heavy institutional buying). 💰
Distribution Zone: 3,350-3,370 (profit-taking area). 💸
Breakout Target: 3,400+ (next institutional objective). ⬆️
Volume Analysis:
High volume on the initial move up from 3,250. 📈
Decreasing volume during consolidation (typical distribution pattern). 📉
Volume expansion needed for breakout confirmation. 💥
5. Cycle Timing Analysis ⏰
Short-Term Cycles:
3-day cycle: Currently in compression phase. 🤏
7-day cycle: Completed around June 2-3. ✅
14-day cycle: Due for completion June 7-9. ⏳
Medium-Term Cycles:
Monthly cycle: Bullish momentum phase. ⬆️
Quarterly cycle: In expansion phase. 🌟
Cycle Projection:
Next major cycle turn expected June 7-9. 🔄
Potential for either breakout or correction during this window. 🤞
6. FORECAST: June 7-11, 2025 🔮
Primary Scenario (60% probability): Bullish Breakout 🚀
Target 1: 3,400-3,410
Target 2: 3,440-3,450
Catalyst: Break above 3,370 with volume. 💥
Timeline: June 7-9 initial move, June 10-11 extension.
Secondary Scenario (35% probability): Corrective Pullback ⬇️
Target 1: 3,320-3,325 (38.2% Fibonacci)
Target 2: 3,300-3,310 (psychological support)
Catalyst: Failure to break 3,370 resistance. 🚫
Timeline: June 7-8 decline, June 9-11 consolidation.
Low Probability Scenario (5% probability): Deep Correction 📉
Target: 3,280-3,290 (61.8% Fibonacci)
Catalyst: Major risk-off sentiment. 😱
Timeline: Extended throughout the week.
7. Key Assumptions & Risk Factors 🤔
Bullish Assumptions:
Continued institutional accumulation at current levels. 🏦
Breakout above 3,370 with confirming volume. ⬆️
Favorable macroeconomic backdrop for gold. 🌍
Weakness in USD supporting gold prices. 💵
Geopolitical tensions maintaining safe-haven demand. 🕊️
Bearish Risk Factors:
Profit-taking at psychological 3,400 level. 🤝
Stronger USD due to economic data. 💹
Reduced safe-haven demand. 📉
Technical failure at key resistance levels. 🚧
Central bank policy shifts. 🏛️
8. Trading Recommendations 💡
Entry Strategies:
Bullish Setup: Buy on pullback to 3,340-3,345 with stop below 3,320. 🎯
Breakout Play: Buy break above 3,372 with stop below 3,350. 🚀
Conservative: Wait for retest of 3,324 support area. patiently 🧘
Risk Management:
Position Size: Limit to 2-3% of portfolio per trade. 📏
Stop Loss: Always use stops below key support levels. ⛔
Take Profit: Scale out at Fibonacci extension levels. 💰
Key Levels to Watch:
Immediate Resistance: 3,365-3,370 🛑
Support: 3,340-3,345 🛡️
Breakout Level: 3,372 🚀
Major Support: 3,320-3,325 💪
9. Conclusion ✅
The XAUUSD chart presents a constructive bullish setup with multiple confluences supporting higher prices. The completion of various cycles around June 7-9 suggests a potential catalyst for the next major move. While the primary bias remains bullish targeting 3,400+, traders should remain alert to the possibility of a corrective pullback to test lower support levels. 🧐
The institutional accumulation pattern, combined with favorable Gann angles and Fibonacci projections, supports the bullish thesis. However, proper risk management is essential given the potential for volatility around key psychological levels. ⚠️
Please take the time to let me know what you think about this. 💬
-------------------------------------------------------------------------
This is just my personal market idea and not financial advice! 📢 Trading gold and other financial instruments carries risks – only invest what you can afford to lose. Always do your own analysis, use solid risk management, and trade responsibly.
Good luck and safe trading! 🚀📊
Week of 7/13/25: AUDUSD AnalysisLast week pushed bullish and demand is still in control on all time frames, so we are going to follow bullish order flow.
Looking for bottom liquidity to be taken in the local range before getting in on a long.
Major News:
Tuesday - CPI
Wednesday - PPI
Thursday - Unemployment

"XRP/USD: Bullish Raid Alert! Ride or Escape Fast!"🚨 XRP/USD HEIST ALERT: Bullish Loot Grab Before the Escape! (Thief Trading Style) 🚨
🌟 Greetings, Market Pirates & Profit Raiders! 🌟
(Hola! Oi! Bonjour! Hallo! Marhaba!)
🔥 Thief Trading Strategy Activated! 🔥
Based on ruthless technical + fundamental analysis, here’s how we SWIPE THE LOOT from XRP/USD (Ripple vs. Dollar). Follow the chart’s Long Entry blueprint—our target is the high-risk YELLOW ATR ZONE (overbought, consolidation, potential reversal). Beware of traps! Bears and cops lurk here, but we strike smart.
🏴☠️ ENTRY:
"Vault’s cracked—bullish loot is FREE GAME!"
Buy Limit Orders preferred (15-30 min timeframe near swing lows/highs).
Aggressive? Swipe instantly—just mind the cops (liquidity traps).
🛑 STOP LOSS (Save Your Loot!):
Swing Thieves: 4H recent wick low ($2.1500).
Risk Tactics: Adjust SL based on your trade size, orders, and guts.
🎯 TARGETS:
Main Take: $2.5400 (or escape earlier if momentum fades).
Scalpers: Longs ONLY! Trail your SL—no greedy holds!
💣 KEY DRIVERS (Why This Heist Works):
Bullish momentum brewing (check fundamentals, COT, on-chain data 👉go ahead to klick 🔗).
NEWS ALERT: Avoid fresh trades during high-impact news—protect open positions with trailing stops!
💥 BOOST THIS HEIST!
Hit 👍 LIKE, 🔔 FOLLOW, and 💬 COMMENT to fuel our next robbery plan. Together, we steal the market’s cash—EVERY. SINGLE. DAY.
📢 Final Warning: Markets shift FAST. Stay sharp, adapt, and CASH OUT BEFORE THE COPS ARRIVE.
🤑 Stay tuned—more heists incoming! 🐱👤🚀

BUYTrend Line Break
Previous Day Volume
Rejection Point
Untapped Order Point
London - US Session
High Structure Swing

SHIB Long Entry Heist Plan – Bullish Setup in Trap Zone🦹♂️💸 SHIB INU Market: The Silent Heist Plan Is Live! 🚨💰
Thief Trading Style | Swing & Scalping Blueprint | High-Risk Zone Masterplan
🌍 Hello Global Robbers & Market Raiders! 🤑💥
Welcome to another secret mission straight from the vault of Thief Trading Style. We're eyeing the SHIB INU Crypto Market, and the time has come for a stealthy bullish strike!
🧠 The Blueprint – Operation SHIB-INU Break-In
We’re executing a bullish move towards the Yellow MA Zone, a high-risk territory filled with consolidations, trap setups, and a potential reversal. The battlefield is tight, but the rewards are sweet for those who play it smart. 🎯💸
🔑 ENTRY STRATEGY – “Vault Access Granted” 🚪📈
💥 Entry Type: Buy/swing
💡 Zone: Pullback entries near swing lows (within 15–30m timeframes)
🕵️♂️ Stealth Entry – Wait for candle signals or limit orders near key liquidity zones.
🛡️ STOP LOSS – “Secure the Exit” 🛑🔐
📌 Placed just below recent swing low at 0.00001050 (30m TF)
🎯 SL adapts to your lot size, trade size, and number of entries.
🏴☠️ TARGET – “Escape Before Alarms Go Off” 🎯💨
💰 Target: 0.00001350
⏳ Optional: Trail your SL and exit on signs of exhaustion.
💼 Scalpers’ Side Mission – “Quick Loot Runs” 🧲⚡
Scalp only on the Long side; use trailing SLs and follow the robbers’ path.
Big wallets? Enter now. Small bags? Wait and follow the swing wave. 🕶️🚀
🧠 Strategic View
Market sentiment remains bullish, but the zone is volatile.
Use macro analysis, COT data, on-chain insights, and sentimental clues for confirmation. 🧠📊
⚠️ Important Notice – Market Hazards Ahead 📉📰
🔔 Watch out for major news releases!
✔️ Avoid new trades during high-impact events.
✔️ Use trailing SLs to guard profits.
✔️ Monitor market developments regularly – stay one step ahead.
💖 Support the Mission
If you love this robbery blueprint, 💥Hit the Boost Button💥 and join the Thief Trading crew for more profitable adventures! Every click fuels our next plan. 🏆💪❤️
📢 See You in the Next Raid!
Stay tuned for more high-stakes missions and daily loot setups!
📲 Follow for the next crypto break-in.
🐱👤🚨 Thief Traders never sleep... we scan, we strike, we secure the bag.

PENGU Crypto Futures Trade Plan 2025-07-13PENGU Crypto Analysis Summary (2025-07-13)
Comprehensive Analysis of PENGU Cryptocurrency Trading Models
1. Summary of Each Model's Key Points
Grok/xAI Report:
Technical Indicators: Price above key moving averages indicating a bullish trend. However, the RSI is at 85.84, suggesting overbought conditions, and the price is touching the upper Bollinger Band. Resistance at $0.03 and support at $0.02. Market Sentiment: Bullish sentiment with recent price changes but signaling potential exhaustion. Direction: Moderately Bearish, recommending a short trade at $0.03, stop-loss at $0.031, and take-profit at $0.02.
Claude/Anthropic Report:
Technical Indicators: Similar to the Grok/xAI report, emphasizing the overbought RSI and position at the upper Bollinger Band. The price trend is recognized as unsustainable due to parabolic movement. Market Sentiment: Acknowledges extreme euphoria in recent gains and anticipates a potential correction. Direction: Moderately Bearish, suggesting a short position with entry at $0.03, stop-loss at $0.032, and a take-profit level targeting $0.025.
Gemini/Google Report:
Technical Indicators: Consistent with other reports, highlighting decent bullish momentum yet extremely overbought indicators signify imminent pullback risks. Market Sentiment: Observation of speculative rationales driving prices, highlighting risk factors in liquidity and broader market sentiment. Direction: Moderately Bearish; recommending a short trade with entry price at $0.03, stop-loss at $0.032, and take-profit at $0.025, sharing similar parameters with previous reports.
DeepSeek Report:
Technical Indicators: Emphasizes overbought conditions with a risk of a 20-40% correction. The current price is significantly above key averages, indicating parabolic action. Market Sentiment: Low funding rates indicate lopsided long positioning, foreseeing potential liquidation events. Direction: Strongly Bearish, supporting short position ideas with similar entry, stop-loss, and take-profit recommendations.
Llama/Meta Report:
Technical Indicators: Highlights resistance at the current price point and overbought indications based on RSI and Bollinger Bands metrics. Market Sentiment: Recognizes caution due to lack of news and low funding rates, suggesting potential for a reversal. Direction: Moderately Bearish; recommending a short position with similar parameters to the other reports.
2. Areas of Agreement and Disagreement Between Models
Agreement:
All models identify the price as overbought with an RSI above 85, signaling an imminent potential correction. A collective sentiment of caution prevails, leading to a recommendation for short trades given the exhaustion of the current bullish momentum. They recognize the price level at $0.03 as key resistance, along with suggesting a stop-loss around $0.031 to $0.032 and a take-profit around $0.025.
Disagreement:
The Grok/xAI report emphasizes a “Moderately Bearish” sentiment where others like DeepSeek classified the trend as “Strongly Bearish.” Some reports recommend modest leverage (50x), while others suggest higher leverage (up to 100x).
3. Conclusion
Overall Market Direction Consensus: The consensus among all models is a Moderately to Strongly Bearish outlook for PENGU, backed by overbought technical indicators and recent rapid price increases without fundamental support.
Recommended Trade:
Trade Direction: Short Entry Price/Range: $0.03 Stop Loss Level: $0.0315 (offering a buffer against outlier volatility) Take Profit Level: $0.025 Position Size Recommendation: Based on account size, aiming for a maximum risk of 1% per trade (e.g., 1 contract for a $100 account). Adjust size appropriately for larger accounts. Confidence Level in Recommendation: 0.70 (overall strength of indicators). Key Risks and Considerations: Risks include further bullish momentum despite technical indicators, potential slippage in volatile conditions, and market liquidity constraints. High leverage could amplify losses. Trade Entry Timing: Enter at market open.
TRADE_DETAILS (JSON Format)
{ "instrument": "PENGU", "direction": "short", "entry_price": 0.030, "stop_loss": 0.0315, "take_profit": 0.025, "size": 1, "confidence": 0.70, "entry_timing": "market_open" }
This concise trade plan consolidates insights from various analyses, aligning on key indicators and market sentiment to create a robust trading strategy for PENGU.
📊 TRADE DETAILS 📊 🎯 Instrument: PENGU 📉 Direction: SHORT 💰 Entry Price: 0.03 🛑 Stop Loss: 0.0315 🎯 Take Profit: 0.025 📊 Size: 1 💪 Confidence: 70% ⏰ Entry Timing: market_open
Disclaimer: This newsletter is not trading or investment advice but for general informational purposes only. This newsletter represents my personal opinions based on proprietary research which I am sharing publicly as my personal blog. Futures, stocks, and options trading of any kind involves a lot of risk. No guarantee of any profit whatsoever is made. In fact, you may lose everything you have. So be very careful. I guarantee no profit whatsoever, You assume the entire cost and risk of any trading or investing activities you choose to undertake. You are solely responsible for making your own investment decisions. Owners/authors of this newsletter, its representatives, its principals, its moderators, and its members, are NOT registered as securities broker-dealers or investment advisors either with the U.S. Securities and Exchange Commission, CFTC, or with any other securities/regulatory authority. Consult with a registered investment advisor, broker-dealer, and/or financial advisor. By reading and using this newsletter or any of my publications, you are agreeing to these terms. Any screenshots used here are courtesy of TradingView. I am just an end user with no affiliations with them. Information and quotes shared in this blog can be 100% wrong. Markets are risky and can go to 0 at any time. Furthermore, you will not share or copy any content in this blog as it is the authors' IP. By reading this blog, you accept these terms of conditions and acknowledge I am sharing this blog as my personal trading journal, nothing more.

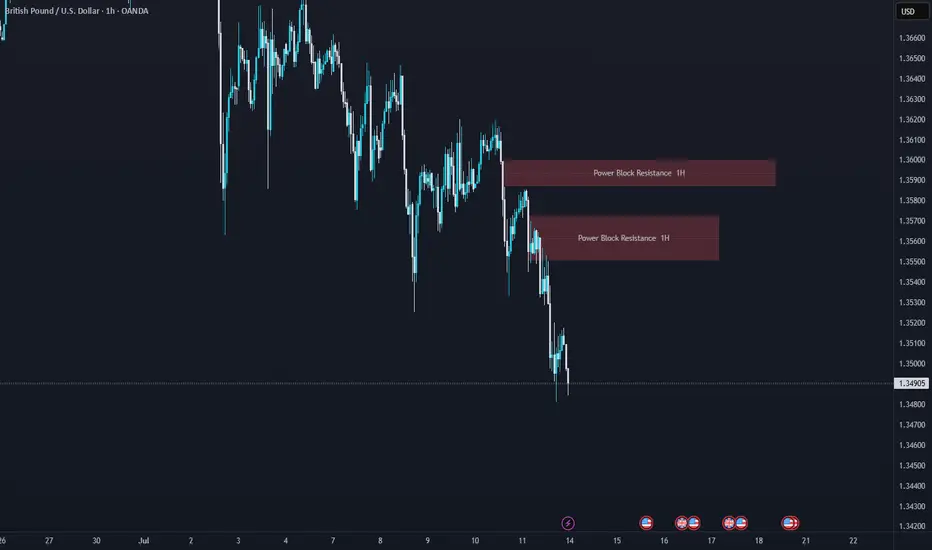
GBP/CAD: Smart Money Heist Strategy – Ready for the Breakout?💼💣 GBP/CAD Forex Bank Heist Plan 🚨 | "Thief Trading Style" 💹💰
🌟 Hi! Hola! Ola! Bonjour! Hallo! Marhaba! 🌟
Welcome to all strategic traders, market tacticians & opportunity seekers! 🧠💸
Here’s our latest Forex blueprint based on the exclusive “Thief Trading Style” – a blend of tactical technicals, smart fundamentals, and stealthy price action moves. We’re preparing for a potential breakout heist on the GBP/CAD a.k.a “The Pound vs Loonie”.
🗺️ Heist Strategy Overview:
The market is forming a bullish setup with signs of consolidation, breakout potential, and trend reversal dynamics. We're eyeing a long entry, but timing is everything. This setup seeks to "enter the vault" just as resistance is breached and ride the move until the ATR High-Risk Zone—where many market players may exit.
🎯 Entry Plan:
📈 Primary Trigger Zone: Watch for a break and close above 1.87000.
🛎️ Set an alert! You’ll want to be ready when the opportunity knocks.
📍Entry Tips:
Place Buy Stop orders above the moving average or
Use Buy Limit entries on pullbacks near recent 15/30min swing lows.
(Perfect for both scalpers and swing traders!)
🛑 Stop Loss Placement:
Thief Trading Style uses a flexible SL system:
Recommended SL at the nearest 4H swing low (~1.85700)
Adjust SL based on your lot size, risk appetite & number of orders
🎤 Reminder: Set SL after breakout confirmation for buy-stop entries. No fixed rule—adapt to your style but manage risk wisely.
🎯 Target Zone:
🎯 Primary TP: 1.89000
🏃♂️ Or exit earlier if price enters a high-risk reversal area
🧲 Scalpers: Stick to long-side trades only and protect your profits with a trailing SL.
🔍 Why GBP/CAD? (Fundamental Notes):
Current momentum is bullish, supported by:
📊 Quant & Sentiment Analysis
📰 Macro Fundamentals & COT Data
📈 Intermarket Trends & Technical Scoring
Get the full data klick it 🔗
⚠️ Caution During News:
To avoid volatility spikes:
Refrain from entering new positions during high-impact news
Use trailing SLs to protect running profits
❤️ Show Support & Stay Tuned:
Smash the 🔥Boost Button🔥 if you love this kind of analysis!
Support the strategy, strengthen our community, and let’s continue this journey of smart, stylish trading.
Stay tuned for the next “heist plan” update—trade smart, stay alert, and manage your risk like a pro. 🏆📈🤝

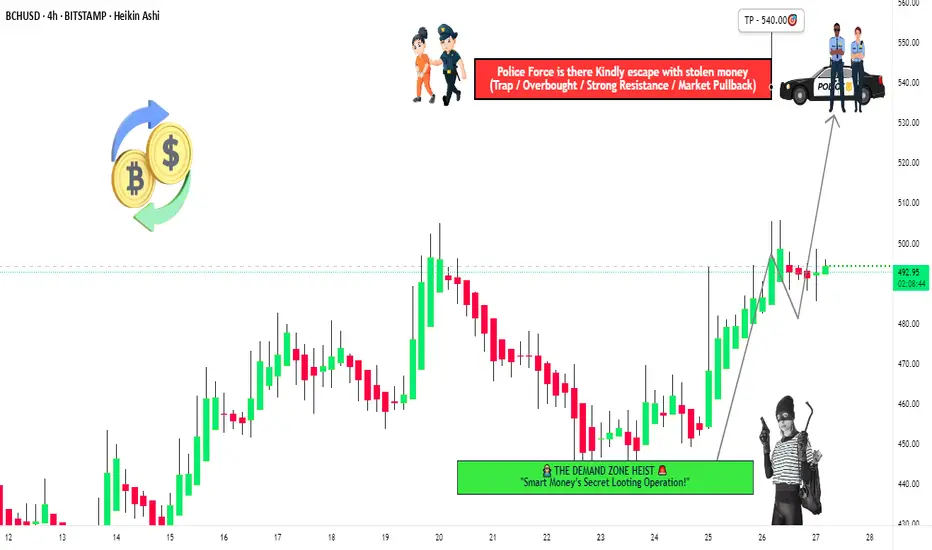
"BCH/USD Heist Mode: Enter Long, Exit Before Bears Strike!🚨 BCH/USD HEIST ALERT: Bullish Loot & Escape Plan! (Thief Trading Style) 🚨
🌟 Greetings, Market Bandits & Profit Pirates! 🌟
(Hola! Oi! Bonjour! Hallo! Marhaba!)
🔥 Mission Briefing:
Based on Thief Trading tactics (TA + FA), we’re plotting a bullish heist on BCH/USD. Time to swipe the loot & escape before the cops (bears) show up!
🔓 ENTRY: "The Vault is Open!"
📈 Buy Zone: Retest of recent low/high (15-30min timeframe).
💡 Pro Tip: Use limit orders for precision—don’t chase!
🛑 STOP LOSS: Live to Steal Another Day
📍 Thief SL: Recent swing low (~440.00 on 4H TF).
⚠️ Adjust based on your risk, lot size, & multi-order strategy.
🎯 TARGET: 540.00 (or Bail Early!)
🏴☠️ Escape before the red zone (overbought, reversal risk, bear traps!).
💰 "Take profit & treat yourself—you earned it!"
📢 WHY THIS HEIST? (Bullish Catalysts)
✅ Fundamentals: Strong macro + sentiment.
✅ Technicals: Pullback entry + bullish structure.
✅ Intermarket trends: Crypto momentum favors bulls.
(For full intel—COT reports, on-chain data, sentiment—check 👉🔗🔗!)
🚨 NEWS ALERT: Avoid the Police (Volatility Traps!)
🔹 Avoid new trades during high-impact news.
🔹 Trailing stops to lock profits & dodge reversals.
💥 BOOST THIS HEIST! (Let’s Get Rich Together!)
👍 Smash that "Like" & "Boost" button to fuel our next robbery!
🚀 Follow for daily heist plans—easy profits await!
See you at the next heist, bandits! 🤑💎
Forex Bank Job: CAD/JPY Profit Extraction Strategy🏦 "Operation Loonie Lift-Off" – CAD/JPY Forex Heist Blueprint! 💰💣
🌟Hi! Hola! Ola! Bonjour! Hallo! Marhaba!🌟
To all fellow Market Bandits & Profit Seekers, 🕶️💸💼
We’ve scoped out our next target – the CAD/JPY vault – and the blueprint is ready. This isn’t just a trade... it's a full-blown Forex infiltration mission based on undercover technical and fundamental recon 🔎📊.
🎯 The Mission Plan:
📍Entry Point – The Vault's Backdoor
💥 Strike at Pullback Zones 1 & 2
→ Use 15–30 min timeframe to ambush at recent lows or swings.
The best loot lies in waiting – buy limits only!
🛡️Stop Loss – Escape Routes
Set SL like a pro thief:
Pullback 1 ➤ 104.800
Pullback 2 ➤ 105.600
Base it on your crew’s bankroll and lot size. Always prep a clean getaway.
🏁Target – Secure the Goods
Primary loot zone: 106.000
(Or vanish before heat arrives 🚓💨)
⚔️ Scalpers’ Special Ops:
Only operate long side. Big wallets = quick hits. Small stacks? Join the swing squad and trail your SL like a shadow 🕶️🔐.
🔥Why This Hit?
CAD/JPY is in bullish mood driven by:
COT shifts 📈
Sentiment setups 🧠
Macro flow + cross-asset whispers 🔄
🚨 But remember: market conditions flip like fake IDs. Stay alert.
🧠 Final Tips from HQ:
🔕 Avoid new ops during major news drops
💣 Use trailing SLs to lock profits before the sirens go off
💖 Smash that 💥BOOST💥 to fund the next big mission
💼 From the Black Market Desks of the Thief Trading Syndicate™
This ain't your grandpa's trade plan — it's a strategic smash-and-grab with style and smarts. 📡🔐
💬 Drop a comment, hit the like, and recruit more to the crew.
📍See you in the next chart heist. Keep it stealthy, sharp, and profitable. 🤑🚀👊

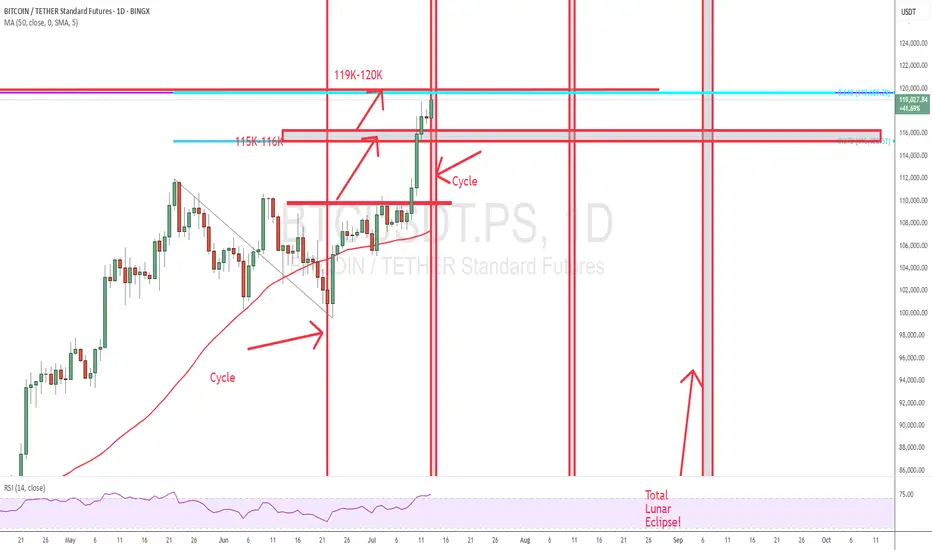
BTC updateFinally, BTC got to my price.
It came exactly to the price and Time (Cycle). Let's see if we clear that.
Good Luck
short recovery, trend line✍️ NOVA hello everyone, Let's comment on gold price next week from 07/14/2025 - 07/18/2025
⭐️GOLDEN INFORMATION:
Gold prices surged nearly 1% on Friday as market sentiment soured in response to US President Donald Trump’s controversial trade policies targeting Canada, while hinting at broader tariffs on other nations and copper. At the time of writing, XAU/USD is trading at $3,354, rebounding from intraday lows of $3,322.
On Thursday, Trump announced a 35% tariff on Canadian imports, though goods complying with the 2020 USMCA trade agreement remain exempt. He also signaled intentions to expand tariffs across most trading partners, proposing blanket rates ranging from 15% to 20%.
With a light US economic calendar, attention turned to Fed commentary. Chicago Fed President Austan Goolsbee pushed back on calls for rate cuts aimed at reducing government borrowing costs, stressing the central bank’s focus remains firmly on employment and price stability.
⭐️Personal comments NOVA:
growth according to the trend, maintaining the accumulation price zone above 3300
🔥 Technically:
Based on the resistance and support areas of the gold price according to the H4 frame, NOVA identifies the important key areas as follows:
Resistance: $3392, $3447
Support: $3330, $3308, $3246
🔥 NOTE:
Note: Nova wishes traders to manage their capital well
- take the number of lots that match your capital
- Takeprofit equal to 4-6% of capital account
- Stoplose equal to 2-3% of capital account
- The winner is the one who sticks with the market the longest

D1, chart analysis.
Gold is currently ranging within a horizontal consolidation zone.
The price is oscillating between the support at ~$3,172–$3,344 and resistance at ~$3,415–$3,500.
A pullback zone is identified near $3,344–$3,346, aligning with prior minor structure and the Fibonacci 0.618 level.
These levels suggest the retracement may be over, and price could be prepping for a new push.

XAU/EUR Bear Raid – High-Risk, High-Reward Short!🔥 XAU/EUR GOLD HEIST – BEARISH BREAKOUT ALERT! 🚨💰
🌟 Greetings, Market Pirates & Profit Raiders! 🌟
(Hola! Oi! Bonjour! Hallo! Marhaba!)
🤑 TRADE IDEA: XAU/EUR (Gold vs. Euro) – BEARISH SWING PLAY
Based on the 🔥Thief Trading Style🔥, we’re plotting a strategic heist on Gold! Our analysis signals a short entry with high-risk, high-reward potential. The market is oversold, consolidating, and primed for a reversal trap—bullish traders are about to get ambushed!
🎯 TRADE SETUP (SWING/DAY TRADE)
📉 ENTRY:
"The Heist Begins!" Wait for Neutral Zone breakout near 2800.00 (Bearish confirmation).
Pro Tip: Place sell-stop orders above neutral OR sell-limit near swing highs/lows (15-30 min timeframe).
📌 Set an ALERT! Don’t miss the breakout moment.
🛑 STOP LOSS:
"Stop right there, cowboy! 🤠"
If using a sell-stop, set SL only after breakout (don’t get faked out!).
Thief SL Zone: 2870.00 (4H swing high).
⚠️ Adjust based on your risk & lot size! (Your money, your rules—but trade smart!).
🎯 TARGET:
2720.00 (or escape early if momentum fades).
🚨 CRITICAL ALERTS:
📰 News = Volatility! Avoid new trades during major releases.
🔒 Lock profits with trailing stops—don’t let winners turn to losers!
📉 Market Context: Bearish trend fueled by .
💥 BOOST THIS HEIST! 👊
🔥 Like & Boost to fuel our next Thief Trading raid!
🚀 More profitable setups coming—stay tuned!
(Disclaimer: Trade at your own risk. This is not financial advice.)

GBPAUD Pre-Market Analysis📉 GBPAUD Pre-Market Analysis – Weekly Outlook
Date: July 13, 2025
Session: Pre-London Open
Analyst: Papalui | Sub Saharan Technicals
🕵️♂️ Macro Outlook
The British Pound / Australian Dollar (GBPAUD) is currently showing signs of trend exhaustion after reaching major highs around the 2.14932 zone (Marked MHH – Most Recent Higher High). A strong bearish reaction is emerging from this area, suggesting potential for long-term downside retracement or even a reversal.
🔍 Technical Structure Breakdown (1W)
MHH (Major Higher High): 2.14932
WHH (Weekly Higher High): 2.06088
Current Price: 2.05049
Fib 50% Level: Aligned around recent resistance and acting as a pivot zone.
BOS (Break of Structure): Occurred in early 2022, later invalidated by strong bullish rally.
MLL (Major Lower Low Target Zone): Projected zone around 1.59109 - 1.57752
📉 Bearish Scenario: Reversal Play
🔽 Bias: Bearish Reversal
Context: Price has formed a new high but is rejecting near the 50% Fibonacci retracement and supply zone.
Plan: Watch for lower timeframe confirmations (e.g., D1 or H4 structure breaks) below 2.04859 to initiate short positions.
Target Zones:
TP1: 1.86584
TP2: 1.81327
TP3: 1.59109 – aligning with weekly demand and structural lows
🔧 Invalidation: A sustained weekly close above 2.14932 would invalidate this bearish scenario and signal bullish continuation.
🔁 Trade Management Zones
Zone Type Action
2.06088 - 2.14932 Supply/Resistance Monitor for rejections or confirmations of reversal
1.86584 - 1.81327 Intermediate Support Partial TP or structure reassessment
1.59109 Major Demand Full TP / Trend reversal opportunity
🧠 Sentiment & Strategy
This pair has rallied over the past year, but the bearish impulse from the recent high suggests large players may be unloading positions. With key Fibonacci confluence and price action showing weakness, the current zone is a strong sell interest region. Traders should:
Stay alert for weekly or daily lower lows
Use smaller timeframes to refine entries
Avoid premature entries before price confirms lower timeframe structure breaks
📌 Summary
Bias Key Resistance POI Bearish Target
Bearish 2.14932 2.04859 1.59109
Risk Disclosure:
All trading involves risk. This analysis is for educational purposes only and should not be taken as financial advice. Always manage risk appropriately.

GBPUSD Bearish Signal | Technical + Custom AlgoSmart Trend Signal | Technical Analysis + Custom Algorithm
This signal is the result of a combination of classic technical trend analysis and a proprietary software I personally developed.
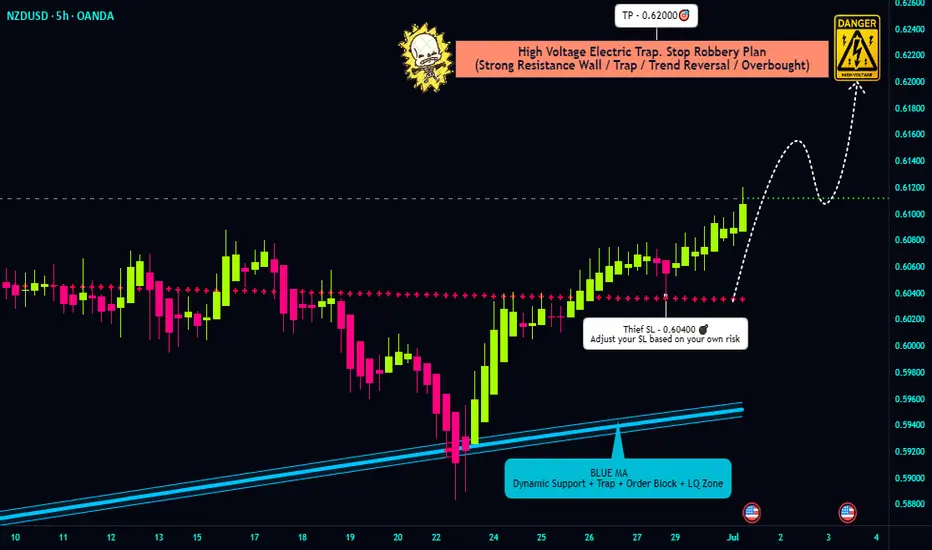
"NZD/USD Bullish Heist! Steal Pips Before the Reversal Trap! 🏴☠️ NZD/USD Kiwi Heist Masterplan – Steal the Bull Run! 💰
🌟 Hola, Money Makers & Market Marauders! 🌟
Welcome to the Thief Trading Style raid on the NZD/USD "The Kiwi" Forex vault. Follow the blueprint sketched in the chart for a bold long takeover — escape the high‑risk Yellow MA Zone before guards tighten!
🎯 Heist Blueprint
1. Entry 🚀
"The vault swings wide—yank that Bull loot at any price!"
Drop your buy-limit orders within the next 15–30 min (or at the latest swing low/high). Don’t sleep—set chart alerts for the perfect breach.
2. Stop‑Loss 🛑
Thief-style SL lurks at the nearest 5h swing‑low wick (≈ 0.60400) for intra‑day.
Adjust your SL based on your risk appetite, position size, and combo of orders.
3. Target 🎯
Aim to escape by 0.62000, or bail early for safety.
4. Scalpers’ Edge 🔍
Only rob on the long side. Big bankroll? Go all‑in. Prefer safety? Slide into the swing crew with a trailing SL to lock in your spoils.
🔍 Market Intel
Why the Kiwi Loot is Ripe:
Bullish momentum marches on, fueled by macroeconomic clues, COT data, sentiment shifts, inter-market moves — all pointing upward.
📚 For Full Recon:
Dive into the fundamental, macro, COT, quant, sentiment & intermarket intel — plus trend targets and scorecards. Check the data here 👉🔗🔗
⚠️ Caution Zone
News Watch & Position Safety:
Major news = guarded vault. Don't open new trades during release windows.
If you're in already, use trailing stops to shield your haul and lock in gains.
💪 Support the Crew
Smash that “Boost” to fuel our team and keep the raid running smooth. With Thief Trading Style, every day’s a payday.
🗓️ Stay tuned for the next Kiwi Heist – we’re just getting started. Happy robbing, legends! 🐱👤💥
XAUUSD Analysis : Bullish Move Toward Key Resistance + Target🟩 Overview:
Gold is currently showing a clear bullish breakout on the 2-hour timeframe. The market structure has shifted from a downtrend into a bullish phase, with price now approaching a critical Reversal Zone. Let’s break down the key levels, structure shifts, and potential trade opportunities.
🔍 1. Structure Shift – Trendline Break & BOS Signals:
The price previously followed a Blue Ray Descending Trendline, which acted as dynamic resistance and guided the bearish trend.
As highlighted, “Blue Ray Always Continue Trend” – but in this case, we’ve seen a clean Break of Structure (BOS) that invalidated the bearish setup.
A Minor BOS occurred first, which hinted at weakening selling pressure.
Later, a Major BOS confirmed the bullish transition as the price broke above a key resistance level with strong momentum.
This transition was supported by consistent higher lows and a breakout above the descending resistance trendline — a classic reversal signal.
🟩 2. Demand Zone Reaction – Major Support Held Firm:
The Major Support Zone between $3,280 – $3,300 provided a strong base for buyers.
Multiple wick rejections and bullish engulfing patterns near this zone indicated aggressive buyer interest.
This support has now become the foundation for the recent bullish rally.
🎯 3. Next Target & Reversal Zone:
The current price is hovering around $3,358, showing strong bullish momentum.
The next major resistance area is marked between $3,380 – $3,400, identified as the Next Target + Reversal Zone.
This zone is critical — it aligns with a historical supply area and the previous market swing highs.
Traders should be cautious here, as price may react sharply. Reversal patterns (like bearish engulfing, pin bars, or double tops) could signal a potential retracement.
⚠️ 4. Trade Plan:
🟢 Bullish Bias (Short-Term):
If you entered from the support or trendline breakout, continue to hold long positions until price nears the reversal zone.
Trail stop-loss under the most recent higher low to secure profits.
🔴 Bearish Scenario (Near-Term Reversal Play):
Watch for bearish rejection patterns in the $3,380 – $3,400 zone.
If confirmation appears, potential short setups could offer a retracement back to $3,330 – $3,320.
📌 Key Levels Summary:
Major Support Zone: $3,280 – $3,300 ✅
Next Target + Reversal Zone: $3,380 – $3,400 ⚠️
Current Price: $3,358
Major BOS Level: Confirmed
Trendline: Broken with strong bullish pressure
🧠 Final Thoughts:
Gold has officially shifted gears. The bullish breakout is in motion, and the trendline break + BOS combo supports further upside — at least until the reversal zone is tested. However, this is also where the market could exhaust, making it crucial to monitor price action closely.
Stay patient, wait for confirmation, and let the levels guide your next move.


GOLD TRADING IDEA FOR 14-18 JULY 2025The price of Gold currently at the H4 liquidity control area at 3376. It's seem like there candlestick H4 rejection at that area but still not valid for market structure shift direction.
If the candlestick breakout above at H4 liquidity control ,I will looking opportunity for long position with target at next H4 liquidity control at 3390 or extension target at 3410.
short term SELL
Price retracement before the price going up.
If small timeframe show market structure shift or develop bearish engulfing pattern at H1 0r m30 below 3376 . The target will be h4 liquidity control at 3354 or 3320 depend on how price act at that area.
