BTC crash to 50kLooks like the top is in!
This should propagate into a nice bear run.
Crypto community got BTC to 100,000$
That’s the PUMP
Then the ETF opens the flood gates for corrupt / corporate money supply… that’s the DUMP signal!
Take their money and run!
Where to? Maybe the park… I’m gonna run my DOGE!
Beyond Technical Analysis


GBP_CHF SWING LONG|
✅GBP_CHF is set to retest a
Strong support level below at 1.0650
After trading in a strong downtrend for some time
Which makes a bullish rebound a likely scenario
With the target being a local resistance above at 1.0750
LONG🚀
✅Like and subscribe to never miss a new idea!✅
Disclosure: I am part of Trade Nation's Influencer program and receive a monthly fee for using their TradingView charts in my analysis.

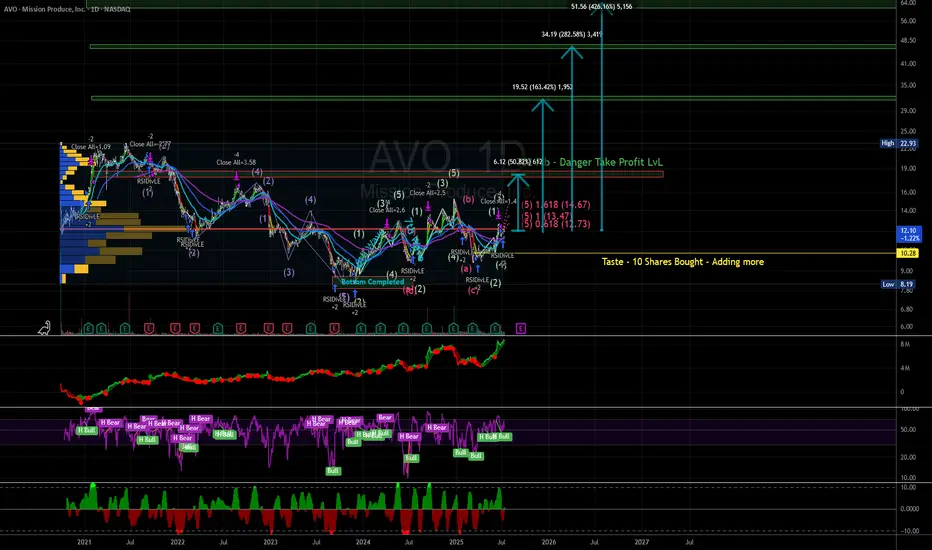
Not too bullish, but one to watch for break outThis trade is still in the consolidation phase, but has a potential break out with volume. Wanting to see price get above $13, before adding more to this position.
For the time being, watch and look for volume and consolidation.
BUYTrend Line Break
Previous Day Volume
Rejection Point
Untapped Order Point
Asian Session
High Structure Swing
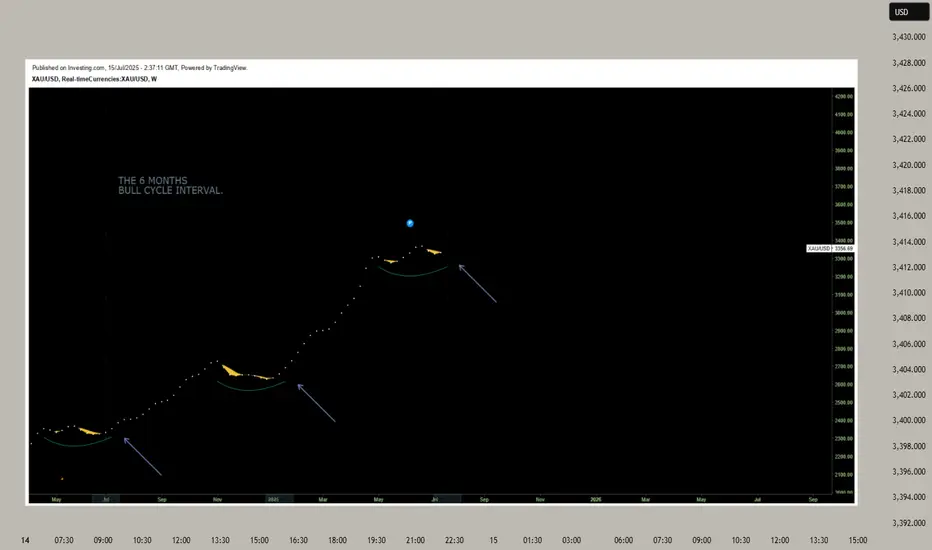
GOLD has entered a NEW BULL CYCLE this month! GET LOADED now!GOLD, has been on a consistent ascend since 2k levels hitting a series of ATH taps week after week.
As with any parabolic event -- a trim down is warranted.
After hitting its ATH zone at 3500, gold significantly corrected back to 38.2 fib levels at 3100 area. 38.2 fib levels has been acting as a strong support for GOLD for quite a bit and as expected buyers has started to converge and positioned themselves back again for that upside continuation -- long term.
After hitting this fib key level gold has been making consistent higher lows on the daily conveying clear intentions on its directional narrative -- to go NORTH.
As of this present, July 2025, GOLD has seen renewed elevation in momentum metrics signifying definitive blueprint towards its next upside move.
Based on our diagram above. WE have now entered a new bull cycle that only transpires every 6 months. The last cycles happened on July 2024, January 2025, then presently July 2025 which is in progress. This is very special as we dont get to see this bullish setup on a regular basis.
Ideal seeding zone is at the current range of 3300-3350.
Mid-Long Term Target at 3400
TAYOR.
Trade safely. Market is Market.
Not financial advice.
RGTI Heading to $17+ Good evening trading family
So currently due to price action it appears we are on our way to 17 dollar target however we expect a little bit of a correction at the 15 range.
However worst scenario if we go below 11 dollars be prepared for a sinker down to 8.
Trade Smarter Live Better
Kris/ Mindbloome Exchange

Bitcoin Cycle PredictionThis "Bitcoin Cycle Prediction" chart utilizes a long-term logarithmic view of BTC/USD price action on a weekly timeframe (1W) via Kraken exchange data, highlighting the cyclical nature of Bitcoin's market behavior across past, present, and projected future cycles.
Key features include:
Parabolic Growth Curves: Three completed macro cycles and a fourth projected cycle are visualized with rounded cup-like formations, indicating historical accumulation phases followed by exponential bull runs.
Fibonacci Retracement & Extension Levels: Each major bull run is annotated with Fibonacci retracement and extension zones, helping identify historical resistance and support levels, as well as potential future price targets. Extensions like 1.618, 2.618, and 3.0 are used to forecast upper bounds.
RSI (Relative Strength Index) : Positioned at the bottom, the RSI gives insight into historical overbought and oversold conditions, aligning well with the cycle peaks and troughs.
MACD (Moving Average Convergence Divergence): MACD crossovers and histogram movements reinforce the timing of bullish and bearish phases within each cycle.
Cycle Timing Marker: The vertical green line marks a projected inflection point around January 2026, suggesting the anticipated peak of the next bull cycle based on previous timing patterns.
Price Targets: Based on previous Fibonacci multiples, projected price targets for the upcoming cycle could reach extensions between $195,000 and $665,000+, if historical behavior repeats.
This chart is a speculative but historically informed visualization designed for educational and analytical purposes, offering long-term investors and cycle theorists a structured look at Bitcoin's repeating macro trends.

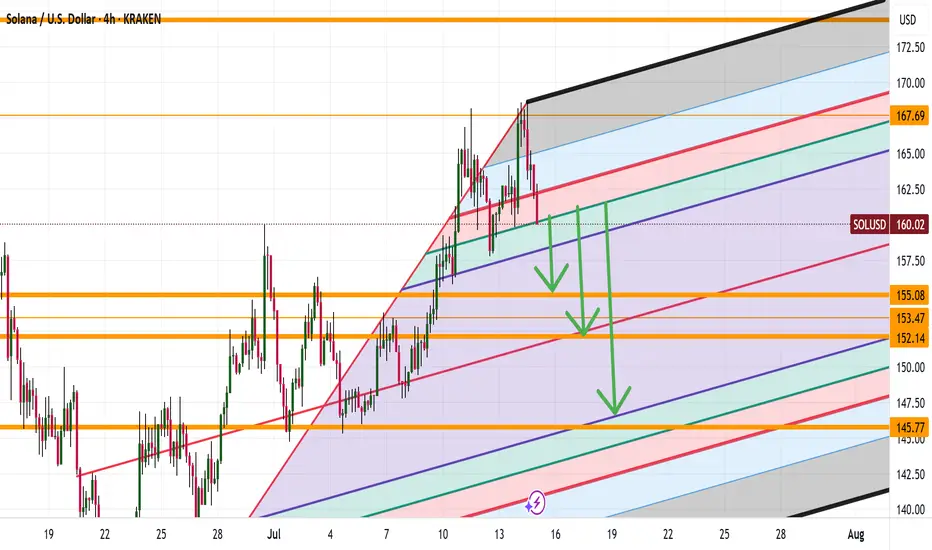
SOL DOWN TO 146 ? Is this possible? Good evening trading family
Based on what we are seeing here is a typical correcting of any good bull mark needed to sustain our movement upwards. Currently we have spotted 3 levels down to the 146 marker with a these of a bullish move upwards if they hold.
Happy trading folks
Kris/ Mindbloome Exchange
CITYSTAR | AUDUSD ; SELL ANALYSE AUDUSD New Forecast👨💻👨💻
This is my personal trade and not in anyway a mandatory setup.
Note:
Follow proper risk management rules. Never risk more then 2% of your total capital. Money management is the key of success in this business...... Set your own SL & TP.
Please support this idea with a Like and COMMENT if you find it useful click "follow" on our profile if you will like these type of trading ideas delivered straight to your email in the future.
Thanks for your continued support!! lemme know your thoughts in the comment sec..

AUD_CAD RISKY LONG|
✅AUD_CAD is trading in an
Uptrend and the pair made
A nice pullback and retested
The falling support so we are
Locally bullish biased and
We will be expecting a
Local bullish rebound
LONG🚀
✅Like and subscribe to never miss a new idea!✅
Disclosure: I am part of Trade Nation's Influencer program and receive a monthly fee for using their TradingView charts in my analysis.

Revisiting Tether Dominance (USDT.D) -- ATH then Crash by Aug?Here's a study worth revisiting I created months ago, showing the inverse relationshop between Tether Dominance (USDT.D) and stablecoins vs Total Market Cap and Bitcoin.
This trendline has held since 2018 and when USDT.D touches it, markets are usually at or near All Time Highs -- But have always corrected off of these levels, as shown in the video.
Let me know your thoughts.
Please like, comment and share.
More links in bio.

Gold – M15 Downtrend in Play | July 15 Analysis🔻 Gold (XAUUSD) – July 15 Analysis | Bearish Bias Until Proven Otherwise
The market has entered a pullback phase on H4, and we’re expecting a potential retest of the 3320 Order Block before any continuation of the broader uptrend resumes.
🔍 M15 Market Structure:
✅ ChoCH followed by BoS confirms a downtrend on M15
🎯 Current short-term objective: Retest of H4 OB (3320)
📍 Price Action Context:
Price is now revisiting the same M15 POI where yesterday’s short setup originated.
Last session, this POI was respected, but instead of creating a new Lower Low, price is trading inside the same zone again.
This signals indecision — so we let price reveal its intent
🧭 Trade Planning Scenarios:
Scenario 1 – Bearish Continuation:
→ If the POI is respected again with clear M1 confirmation ( Micro-ChoCH + BoS ), we will plan for a short setup toward 3320
Scenario 2 – POI Breaks:
→ If price breaks above this POI zone, the next key level to observe is the 3355–3359 supply zone
→ We’ll reassess from there based on new confirmation
📌 Bias for Today:
🔻 Bearish bias remains intact as long as M15 structure does not shift back to bullish.
All setups must align with structure — we are short-biased only until the market proves otherwise
📖 Structure before emotion. Let the market invite you — not the other way around.
📘 Shared by @ChartIsMirror

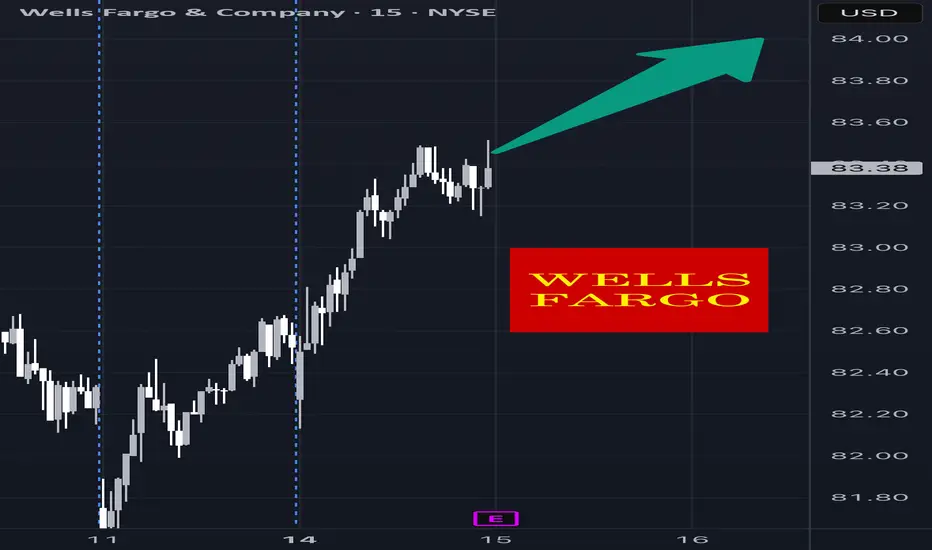
WFC Earnings Setup – 07/14/2025 $86C | Exp. July 18 | Betting on
📈 WFC Earnings Setup – 07/14/2025
$86C | Exp. July 18 | Betting on a Bank Bounce
⸻
🔥 EARNINGS HEAT CHECK
💼 WFC reports BMO (07/15)
📊 Historical move avg: ~3–5%
📍 Current price: $82.53
📈 Above 20D/50D MAs → trend intact
⚠️ RSI = 78.07 = overbought 🚨
💥 Expected move: $2.89
⸻
🧠 SENTIMENT SNAPSHOT
🔄 Call OI stacked at $86
🔻 Put OI focused at $81
⚖️ Balanced flow → slight bullish tilt
🧾 IV is elevated, so IV crush is coming
⸻
🏦 SECTOR SUPPORT
• Financials showing strength 📈
• No major institutional bias
• VIX @ 16.40 → macro calm = earnings-friendly
⸻
🎯 Trade Plan – IV Exploitation Setup
{
"ticker": "WFC",
"type": "CALL",
"strike": 86,
"exp": "2025-07-18",
"entry": 0.81,
"target": 1.62,
"stop": 0.40,
"size": 1,
"confidence": "70%",
"entry_timing": "pre-earnings close"
}
🔹 Call Entry: $0.81
🎯 Profit Target: $1.62 (+100%)
🛑 Stop: $0.40 (-50%)
📅 Expiry: 07/18/25
📆 Earnings Date: 07/14 (BMO)
📈 Expected Move: ~$2.89
🧠 Confidence: 70%
⸻
⚠️ Key Risks
• IV crush = quick decay if WFC doesn’t move
• Guidance could swing the stock either direction fast
• Overbought = short-term pullback risk even on good earnings
✅ Why $86C?
• Just outside expected move
• High OI = liquidity
• Reasonable premium = good risk/reward
⸻
📣 Model Consensus:
“Moderately Bullish” — strong setup but keep it tight around earnings!
Tag your favorite bank stock trader 🏦👇
Who’s playing WFC earnings this quarter?
#WFC #EarningsPlay #OptionsTrading #CallOption #BankingStocks #IVCrush #RiskReward #AITrading #
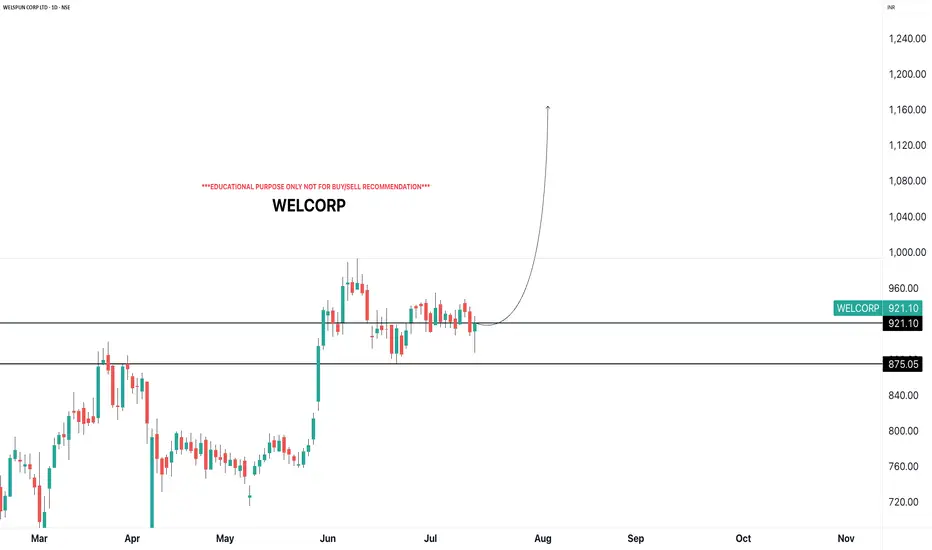
WELCORPi Observed these Levels based on Price Action and Demand & Supply which is my own Concept "PENDAM CONCEPTS"... Please don't take any trades based on this chart/post... Because this chart is for educational purpose only not for Buy or Sell Recommendation... Thank Q
Daily Analysis- XAUUSD (Tuesday, 15th July 2024)Bias: Bearish
USD News(Red Folder):
-CPI m/m
Notes:
- Price closed strong bearish
- Looking for price to retest daily structure
- Potential SELL if there's
confirmation on lower timeframe
- Pivot point: 3380
Disclaimer:
This analysis is from a personal point of view, always conduct on your own research before making any trading decisions as the analysis do not guarantee complete accuracy.

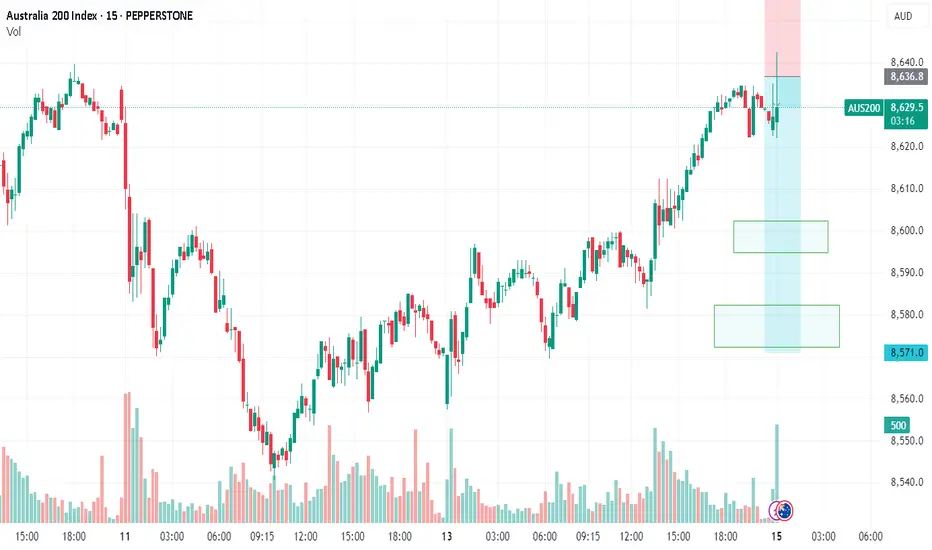
AUS200/ASX200 - OPPORTUNITY KNOCKING OUR DOORTeam, time to SHORT the hell out of AUS200 at 8632 to 8645 ranges
Taking 50-60% target at 8606-8592
ensure bring stop loss to BE once it hit our first target
then second target at 8585-8572
LET'S GO AND KILL THEM.
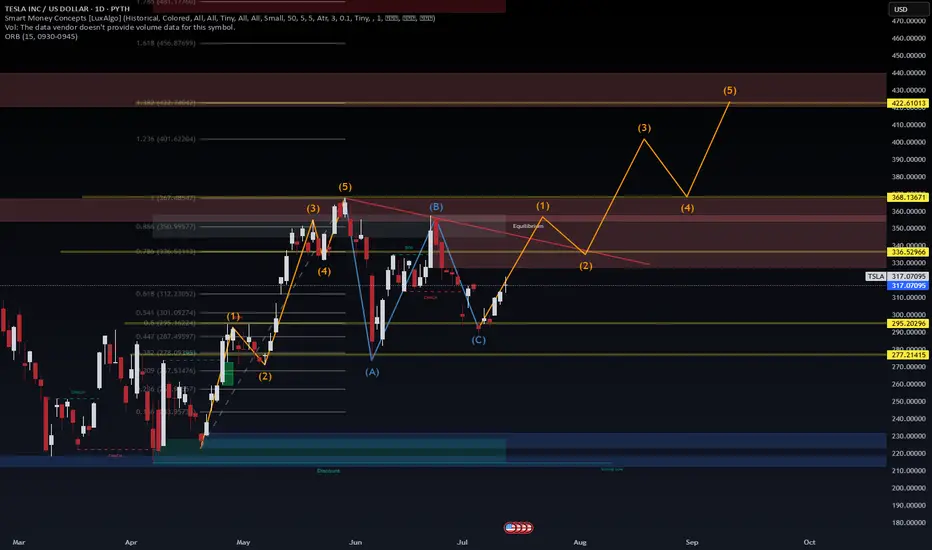
TSLA – Macro Roadmap + VolanX Forecast Confluence📈 TSLA – Macro Roadmap + VolanX Forecast Confluence
Tesla continues to obey our Smart Money Concepts (SMC) + Elliott Wave roadmap, with price rebounding from the (C) correction zone. VolanX DSS and QuanT v3.0 both signal a medium-confidence bullish bias short-term, aligning with our wave count for a new 5-wave structure targeting the $420 zone.
🔍 Technical Outlook (WaverVanir DSS)
📊 Price held above 295.20 demand zone (discount reentry)
⚡️ ABC correction complete, BOS confirmed
🟧 Impulse wave 1 forming above 312–317 key liquidity
🎯 Mid-term targets: 336 > 368 > 422.6
🧠 VolanX QuanT Neural Forecast
1D Forecast: ▲ +1.9% (Medium Confidence)
1W Forecast: ▼ –1.5% (Medium Confidence)
7D Model: Volatility expected, but higher lows forming
Risk: -2.9% short-term drop possible (flagged, high risk zone)
🧩 Confluence
WaverVanir DSS confirms institutional accumulation
VolanX AI models forecast near-term upside but warn of shakeouts
Primary path favors breakout above 336.52 before higher timeframe wave 3 expansion
🚨 Risk Layer
Tight invalidation below 295.20
Optimal scaling opportunity if retrace to 312–316 zone holds
—
🔁 Strategic Play:
Buy retracements into the 312–316 range
Risk below 295.20
Target zone: $368 – $422+
—
📡 Powered by VolanX DSS and WaverVanir Institutional Macro AI
📌 Disclaimer: For educational purposes only. Not financial advice.
#TSLA #WaverVanir #VolanX #NeuralForecast #SmartMoneyConcepts #OptionsFlow #AITrading #WaveTheory #QuantFinance #InstitutionalStrategy #ElonMoves #NASDAQ #TradingView
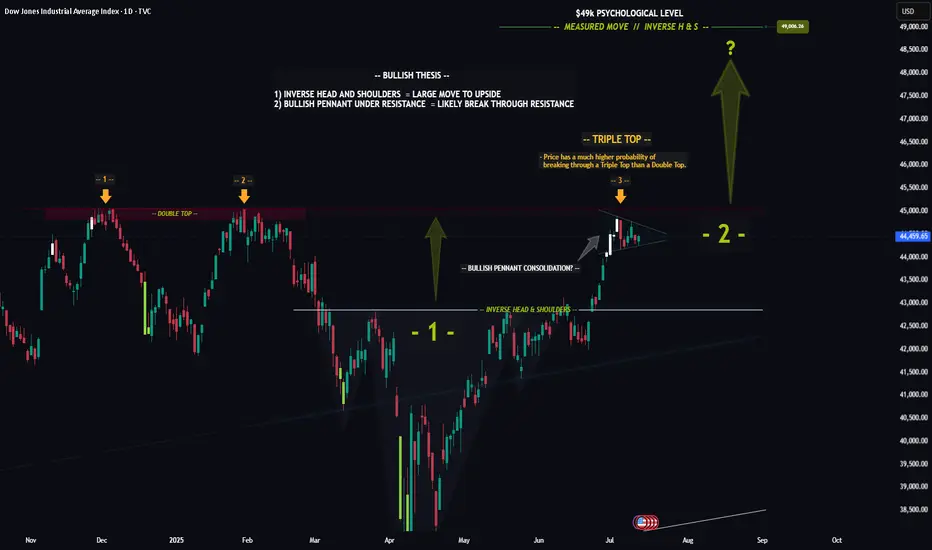
DOW (DJI) -- Preparing For The Next Big Move?Hello Traders!
The chart of the DOW is really quite incredible... Recently price formed a textbook Inverse Head & Shoulders pattern, which led to a nice nearly to the all time high. Furthermore price looks to be consolidating in a Bullish Pennant just below the all time high resistance level.
The reason the Pennant below resistance is so significant is because this signals that investors are likely preparing to drive price higher to new highs. Think about it like a fighter resting before the next big fight.
Triple Top: In addition to the pennant price has now hit this resistance level for the 3rd time. The more times price hits a level typically the weaker it gets. After the 3rd hit the chance of a breakout increases dramatically.
In Summary: The "Triple Top" in conjunction with the "Bullish Pennant" means that there is undoubtedly a very high probability that price will breakout and make new all time highs.
This post is primarily meant to be educational vs a trade idea. Its charts like this that invigorate my technical analysis side and I hope it does for you as well.
Best of luck on your trading journey!
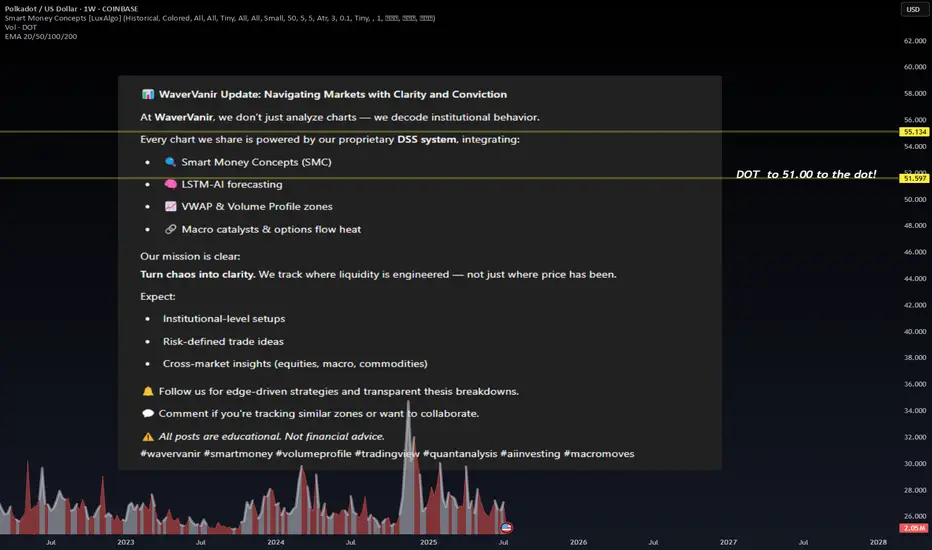
WaverVanir Update: Navigating Markets with Clarity and Convictio📊 WaverVanir Update: Navigating Markets with Clarity and Conviction
At WaverVanir, we don’t just analyze charts — we decode institutional behavior.
Every chart we share is powered by our proprietary DSS system, integrating:
🔍 Smart Money Concepts (SMC)
🧠 LSTM-AI forecasting
📈 VWAP & Volume Profile zones
🔗 Macro catalysts & options flow heat
Our mission is clear:
Turn chaos into clarity. We track where liquidity is engineered — not just where price has been.
Expect:
Institutional-level setups
Risk-defined trade ideas
Cross-market insights (equities, macro, commodities)
🔔 Follow us for edge-driven strategies and transparent thesis breakdowns.
💬 Comment if you're tracking similar zones or want to collaborate.
⚠️ All posts are educational. Not financial advice.
#wavervanir #smartmoney #volumeprofile #tradingview #quantanalysis #aiinvesting #macromoves
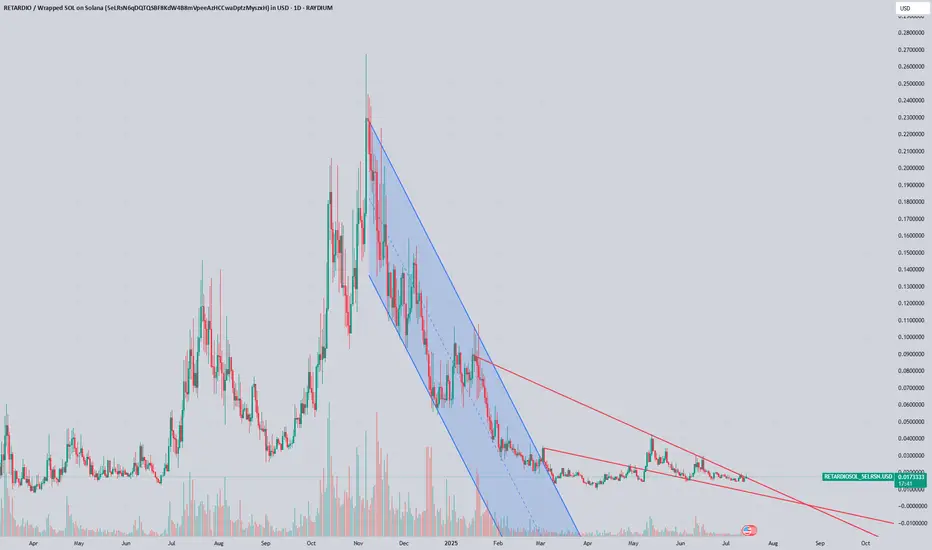
$Retardio LongI have added to my Retardio long. The entire crypto memespace is well... you get it.
No other token comes close to defining the entire space. I'll be holding this one for a long time just because of the lolz. Not advice. This is retardio.
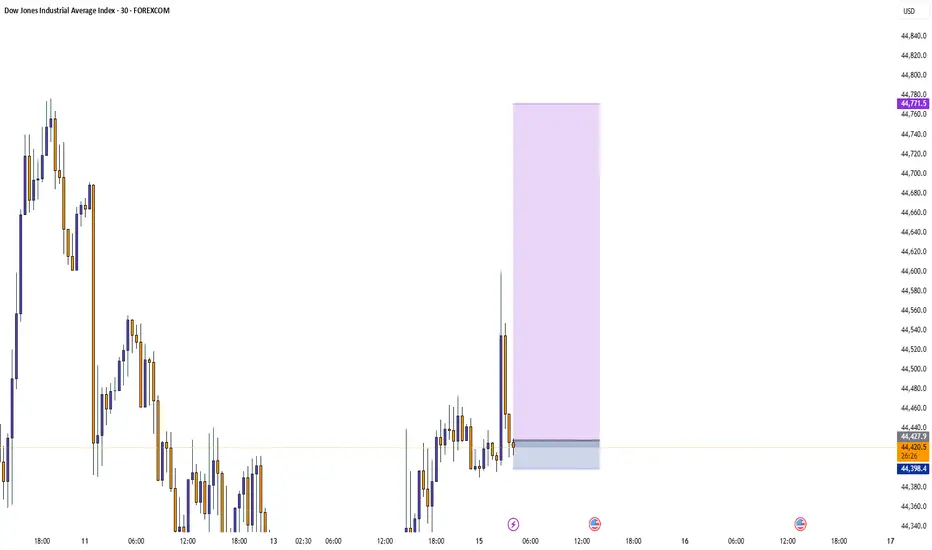
MYM-FUTURES-US30- Retracement & ContinuationBias changed from July 13, 2025 to Bullish for a quick scalp. Tomorrow expecting some retracement and a possible move higher. Overall, Bais hasn't changed. Looking for a short into weekly FVG.

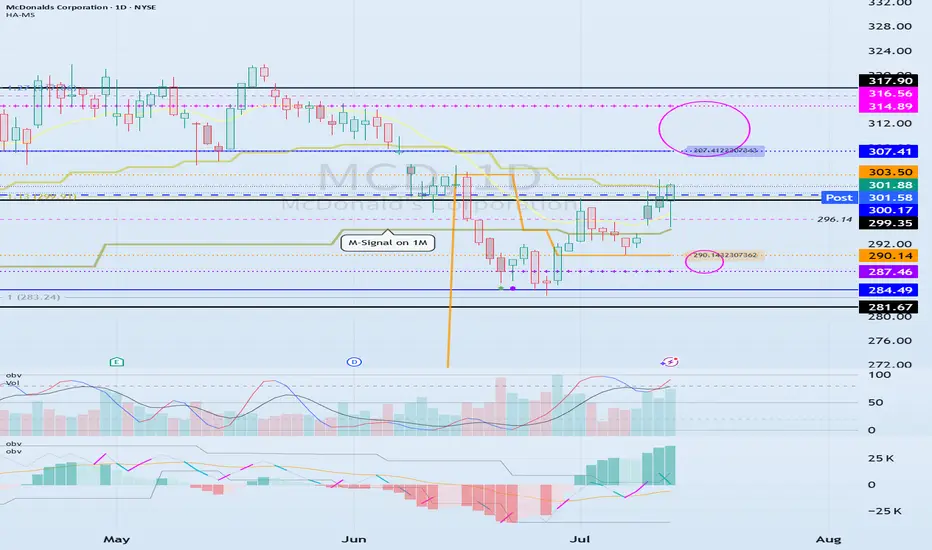
The key is whether it can be supported and rise near 300.17
Hello, traders.
If you "Follow", you can always get new information quickly.
Have a nice day today.
-------------------------------------
(MCD 1D chart)
Before following the basic trading strategy, the first thing to check is whether the current price is above or below the M-Signal indicator on the 1M chart.
If the price is below the M-Signal indicator on the 1M chart, there is a possibility that it will turn into a medium- to long-term downtrend.
Therefore, if possible, it is recommended to trade stocks whose prices are above the M-Signal indicator on the 1M chart.
If the price is below the M-Signal indicator on the 1M chart, you should respond quickly and briefly using the short-term trading (day trading) method.
-
The support and resistance zones can be seen as the 287.46-290.14 zone and the 307.41-314.89 zone.
The 287.46-290.14 zone is the DOM(-60) ~ HA-Low zone, and the 307.41-314.89 zone is the HA-High ~ DOM(60) zone.
These two zones are likely to form a trend depending on how they break through, so they can be seen as support and resistance zones.
-
The 300.17-316.56 zone is the HA-High ~ DOM(60) zone on the 1W chart.
Therefore, we need to check whether it can receive support and rise in the 300.17-316.56 zone.
Therefore, if it falls near the 307.41-314.89 range, you should check for support near 300.17.
-
If it rises above the HA-High ~ DOM(60) range, it is likely to show a step-up trend, and if it falls in the DOM(-60) ~ HA-Low range, it is likely to show a step-down trend.
-
Thank you for reading to the end.
I hope you have a successful transaction.
--------------------------------------------------