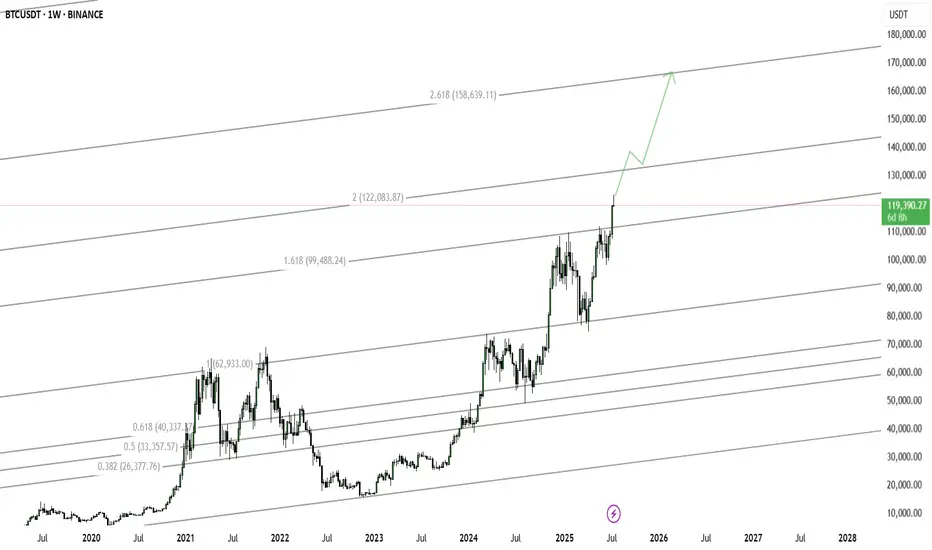
7 year gold bull run after ETF $GLD launches in 2004This begs the question, how many multi year bull run will bitcoin go for considering NASDAQ:IBIT is the most successful ETF of all time and that bitcoin is scarce.
Beyond Technical Analysis


BTC — Long from Support Box (#4h) | BULLISH1. Buy: Limit order 115.5k–116.6k
2. Alert: If close < 113k, scenario invalid
3. Target: 125k


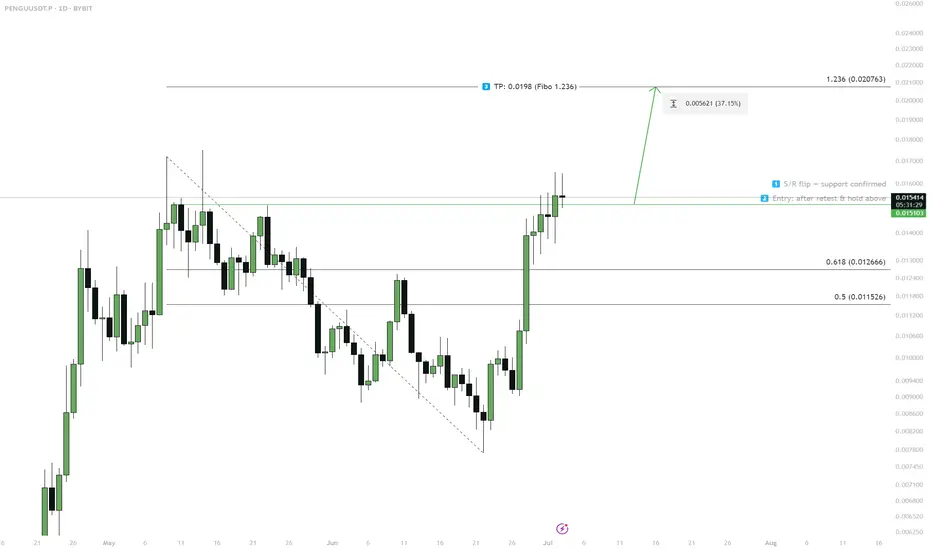
PENGU — S/R Flip & Breakout Scenario1. S/R flip at 0.0151 — wait for retest
2. Enter on successful hold above 0.0151
3. Target: 0.0198 (Fibo 1.236)
4. If fails to hold above 0.0151 — scenario invalid
US OILUS OIL is reaching towards important zone which can give us a good move to the upside after it sweeps OLD LOW

Hedge funds buy in is in playBesides hedge funds, options market is ringing bullish. Any supporting data anyone would like to share?
www.tradingview.com
EUR/USD 4H POSSIBLE TRIGGERChart is setup and ready to take the trade at the top of the hour. Looks to me like the EUR/USD is heading down.

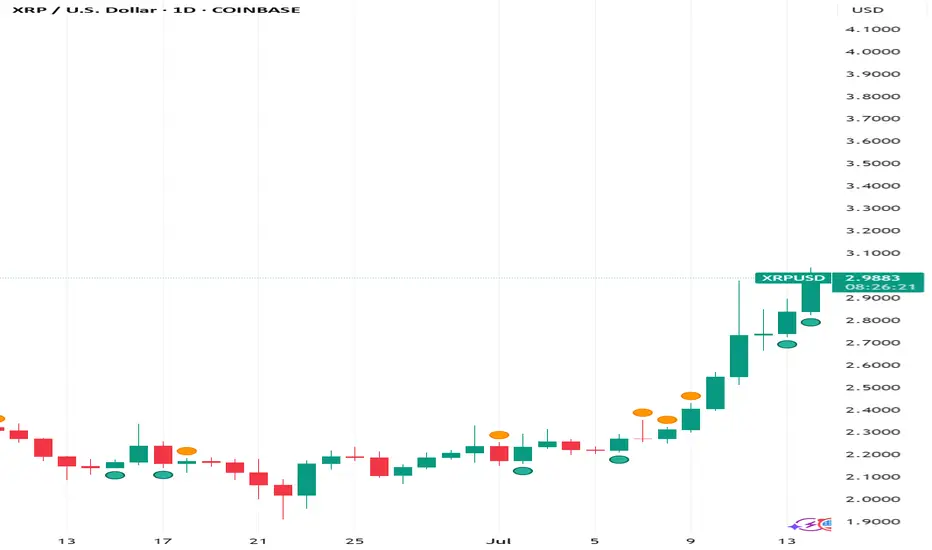
Ripple and XRP 2025-2026 Outlook: Institutional Adoption, ETF M While most investors rely on chart patterns and historical indicators to guide their decisions, the real edge lies in forward-looking analysis. While trading patterns provide valuable insight for short-term volatility-based investing, understanding roadmaps and projected outcomes paints a far clearer picture of an asset's long-term potential—and helps investors anticipate when price changes are likely to occur. In the world of crypto—where social sentiment can be engineered and narratives drive short-term price swings—it's critical to focus on roadmaps, regulatory movements, and institutional integration.
Utility-based crypto like XRP gains value not just from speculation, but from the outcomes it delivers: seamless cross-border payments, compliance infrastructure, and financial interoperability. This article explores what's already unfolding and what's expected to reshape the XRP landscape through the end of 2025 and into early 2026.
This is not financial advise, just my viewpoint... While some of these events may not happen, they are speculated as ongoing with completion dates stated.
Conservative Price Range Estimate: $6.00 by January 2026 ( My personal view, could be more, could be less.. do your own research)
July 2025: Regulatory Foundation and Institutional Signaling
ProShares XRP Futures ETF Launch (July 18): While a futures ETF doesn’t create real XRP demand, it establishes institutional access and boosts trading legitimacy. XRP saw a 5% short-term lift on the news.
Ripple Applies for a National Bank Charter (July 2): Ripple seeks a U.S. national trust bank license and Federal Reserve master account, aiming to custody RLUSD reserves directly and offer banking services. This move would make Ripple the first crypto-native bank regulated at the federal level.
BNY Mellon Partners on RLUSD Custody: The stablecoin RLUSD will be backed by assets held with BNY Mellon, significantly enhancing institutional trust.
Congressional Crypto Week (July 14-18): Multiple pro-crypto bills including the GENIUS Act and CLARITY Act are set for vote. If passed, they will clarify stablecoin frameworks and digital asset classifications.
July set the tone for XRP’s transition into institutional finance. With the launch of a ProShares XRP futures ETF, investor interest saw a legitimate on-ramp into regulated markets. Ripple’s application for a national bank charter and its RLUSD custody deal with BNY Mellon signal a serious bid for integration with the U.S. financial system. Meanwhile, Congressional attention to crypto regulation during “Crypto Week” builds the political and legal scaffolding Ripple needs to operate as a licensed banking entity.
August 2025: Finalizing Frameworks
OCC Public Comments Close (Aug 1): Comment period on Ripple’s bank charter ends, allowing regulatory evaluation to begin.
SEC ETF Template Finalization Expected: New rules and disclosures for spot crypto ETFs could be released, paving the way for streamlined XRP spot ETF approvals.
Progress on Crypto Legislation: The GENIUS and CLARITY Acts may pass both chambers, offering Ripple and XRP a compliant and recognized framework under U.S. law.
In August, the public commentary on Ripple’s bank application closes, beginning a phase of federal evaluation. The SEC is expected to clarify spot ETF guidelines this month, which would streamline XRP ETF approvals. Combined with likely legislative wins in Congress, August is expected to deliver the regulatory clarity Ripple needs to unlock deeper capital flows and onboarding from cautious institutions.
September 2025: Institutional Inroads
Franklin Templeton XRP Spot ETF Approval: With public comments completed in July, the SEC is expected to rule on Franklin’s ETF by late September. Approval would create true XRP demand from asset managers.
Ripple Bank Charter Decision Expected: Based on standard OCC timelines, a decision could land in September, granting Ripple official trust bank status.
Bank Adoption of RippleNet: New U.S.-based banks are expected to onboard RippleNet and RLUSD, pending charter clarity.
September may mark one of XRP’s most pivotal months. The expected approval of the Franklin Templeton spot XRP ETF introduces real XRP demand from traditional financial platforms. Ripple’s bank charter decision is anticipated, which, if approved, formalizes Ripple as a regulated trust bank. Institutions watching from the sidelines could begin onboarding RippleNet and adopting RLUSD as a digital settlement instrument.
October 2025: Full Financial Integration
Federal Reserve Master Account Approval: If the bank charter is approved, Ripple may gain direct Fed access, reducing friction in cross-border liquidity operations.
Hidden Road Acquisition Finalized: Ripple’s $1.25B purchase of the prime-brokerage platform expands XRP Ledger's reach into institutional DeFi.
Crypto Regulatory Acts Signed Into Law: Expected signing of the GENIUS and CLARITY Acts into federal law establishes Ripple and RLUSD as compliant players.
October represents a leap from planning to execution. If Ripple secures a Federal Reserve master account, it gains direct access to U.S. payment rails—dramatically reducing cross-border friction. The finalization of Ripple’s acquisition of Hidden Road builds new institutional bridges to DeFi. With the GENIUS and CLARITY Acts likely signed into law, Ripple’s operations become formally protected under U.S. legislation.
November 2025: Global Payment Infrastructure Alignment
SWIFT ISO 20022 Final Cutover (Nov 22): RippleNet becomes a competitive ISO-native alternative as legacy systems complete their migration.
Banking Partnerships Expand: With charter and Fed access, expect Ripple to announce new integrations across both U.S. and global banks.
November marks the global synchronization point. SWIFT’s ISO 20022 cutover transitions legacy finance into the same language RippleNet already speaks. This timing could prompt a new wave of partnerships from U.S. and international banks looking for compliant, faster alternatives. The technical alignment removes a final excuse for not adopting Ripple’s infrastructure.
December 2025: Stablecoin Acceleration
RLUSD Volumes Surge: With the infrastructure in place, stablecoin transactions over XRPL and Ethereum are expected to see significant enterprise use.
New Spot ETF Filings: Firms like Bitwise, 21Shares, and WisdomTree may file or receive approvals, expanding XRP's ETF market share.
Year-End Analyst Price Targets Raised: Institutional research desks may revise XRP targets upward, citing infrastructure, compliance, and volume data.
With legal clarity and infrastructure live, RLUSD adoption is expected to surge in December. Stablecoin flows through Ethereum and XRPL should grow significantly, showcasing XRP’s value in facilitating enterprise-grade financial transactions. Analysts are expected to raise XRP price targets based on these integrations and actual volume, setting up a strong year-end momentum.
January 2026: DeFi and XRP Ledger Scaling
Hidden Road Tooling Goes Live: DeFi integrations through institutional APIs create new XRP use cases.
RippleNet Usage Reporting: Post-charter metrics likely show increasing XRP volumes in institutional corridors.
New U.S. Legislative Proposals: Follow-on legislation could further streamline crypto regulation, with bipartisan support likely to continue.
January begins with tangible growth. Ripple’s DeFi strategy via Hidden Road goes live, giving institutions plug-and-play access to XRP-based liquidity protocols. Early usage metrics post-charter will offer proof of adoption. With bipartisan momentum behind crypto legislation still building, 2026 could see an even deeper alignment of XRP within regulated finance.
Strategic Outlook
The convergence of banking infrastructure, spot ETF exposure, and regulatory clarity may push XRP into a sustained growth arc. If Ripple secures its charter and Fed access while ETFs go live, XRP could see institutional capital inflows, utility-driven velocity, and price discovery not seen since its early 2018 surge.
Estimated Price Range (Base Model): $5.00 to $6.50 by January 2026
Key Watchpoints:
OCC and Federal Reserve decisions
Spot ETF trading volumes
RLUSD transaction data
Adoption by banks and brokers
XRP's next chapter is not just about price—it's about becoming a foundational asset for regulated global finance.
Skeptic | GBP/USD Update: Triggers Fired Up!Hey everyone, it’s Skeptic! ;) yesterday, the support at 1.35672 saw a fake breakout and snapped back into the 4-hour box we’ve been tracking. But bearish momentum is still strong, so here’s the play:
✔️ If you opened a short already , With the fake breakout signaling potential momentum shift, consider taking profits or closing if price consolidates above 1.36089. Why? The fakeout increases the chance of a momentum change.
✨ For new short positions , the 1.35672 break remains a valid trigger. If it breaks again, it could kickstart a major bearish leg, targeting lower supports at 1.35000 and 1.34227 —both strong reaction zones.
📊 The HWC is uptrend, so shorts need extra caution—reduce risk or take profits early.
📉 For longs , wait for a break and consolidation above 1.36406 . This level saw a strong rejection, signaling it’s a key resistance the market respects. A break here, liquidating short positions (which means buying), could spark a solid uptrend leg with great R/R potential.
🔔 Confirmation : Use RSI entering oversold for shorts or overbought for longs. The HWC uptrend means shorts carry higher risk, so tighten your risk management—stick to 1%–2% risk per trade.
🔼 Key Takeaway: Short at 1.35672 if it breaks again, long at 1.36406 with confirmation. Stay sharp for momentum shifts and keep stops tight. I’ll update if the market structure flips!
💬 Let’s Talk!
Which GBP/USD trigger are you locked on? Hit the comments, and let’s crush it together! 😊 If this update lit your fire, smash that boost—it fuels my mission! :)))

Trading Game of the Day 14-JULY-2025Trading plan
1-bias
2-narrative
3-context
4-entry
5-risk management
iFVG and FVG is the cornerstone of my trade today
iFVG is a failed FVG
BB is failed OB

AUDCAD Wk Top Down Bullish Price Action Analysis 1.The weekly price is reaching a premium zone, suggesting a potential reversal or reaction area.
2. Daily BOS + Tap into Daily imbalance FVG.
3. HR is still in a bullish sentiment
4. Waiting for 15 minutes for displacement or BOS
5. Tap into 15 minutes of FVG.
5: Pending price action...

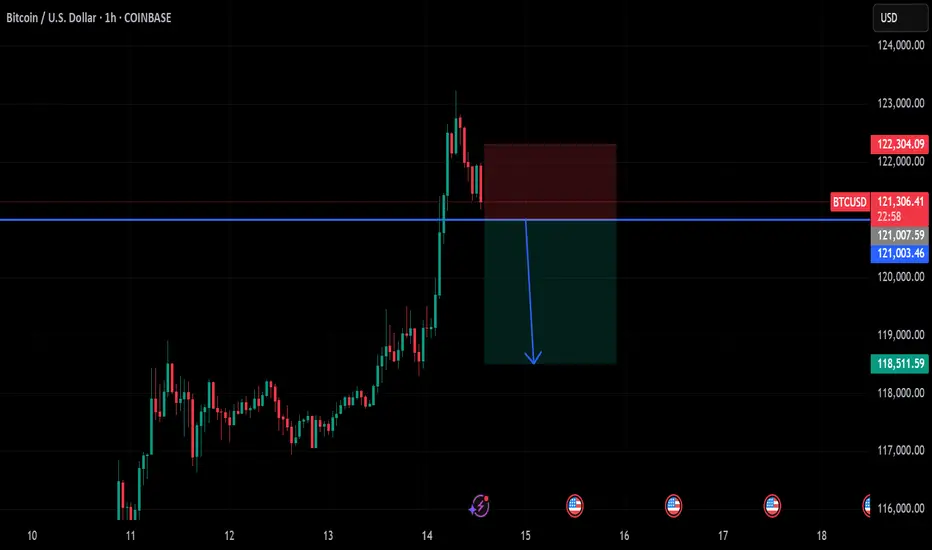
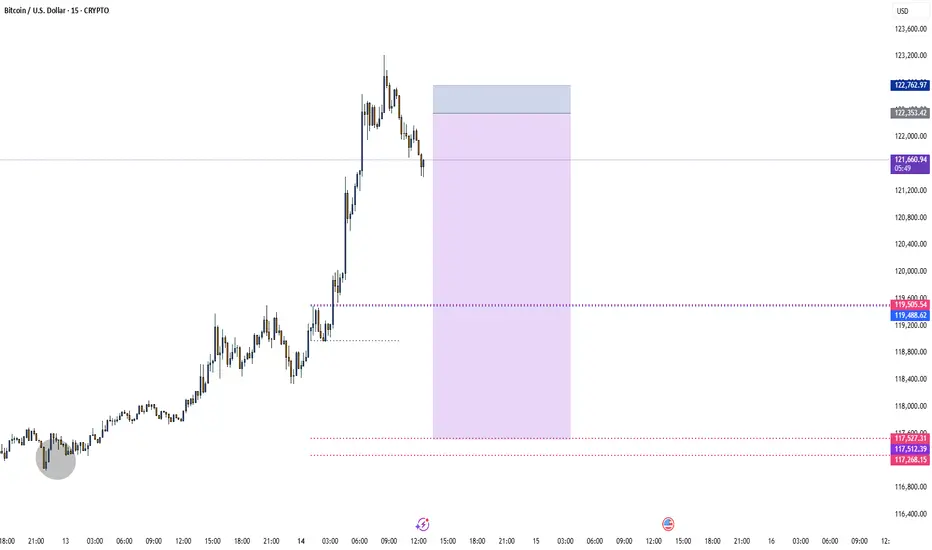
btc on sell below 121k#BTCUSD price now on reverse, expected entry below 121k on H1 closure.
Target 118500, Stop loss 122300. First short TP at 120500 for possible reverse on buy.
Bullish can take place if the H1 doesn't close below the sell entry, any breakout above 123k again will reach 125k.
Live Setup for ES NY am session (14 July, 2025)MY bias: I expect price to make move lower at NY am session and target 6,259 price level.

XAU/USD Weekly Update — July 14, 2025⌛Timeframe:
.
📆 Date: July 14, 2025
.
🎯 Weekly Bias: Mildly Bullish — elevated risk, cautious momentum
🔎 Market Overview:
🛡️ Safe‑haven demand surging:
Renewed 30% tariffs on EU, Mexico, Canada have pushed investors into gold, lifting prices to a 3-week high.
📉 Weak USD & inflation hedge:
A softer U.S. dollar, under pressure from dovish Fed speculation, continues to support gold. A predicted September rate cut further boosts gold’s appeal.
🏦 Central bank accumulation:
Q1 2025 saw record demand from central banks (≈244 tonnes), with many reallocating reserves toward gold for geopolitical and de-dollarization reasons.
📈 YTD performance standout:
Gold is up ~27% this year, leading other assets. Bullish technical indicators like tightening Bollinger Bands and sustained MACD support continuation.
🌀 Market Sentiment:
🔽 Exchange reserves continue dropping:
Indicative of increased HODLing and lower upcoming sell pressure.
🧠 Sentiment firmly bullish:
Analysts highlight risk‑off bias; gold remains favored amid trade tensions.
🤝 ETF inflows & institutional buying:
Strong flows through gold ETFs and central bank buying reflect ongoing structural support.
🔧 Technical Analysis:
📊 Weekly Movement: +1.9% weekly gain, now at $3,367.
✅ Key Levels:
🔻 Resistance: $3,374 → $3,400
🔺 Support: $3,350 → $3,331
🟢 Signals: Mild bearish RSI divergence hints at short-term pause
🟢 Weekly Bias: Mildly Bullish — momentum favored, but caution amid technical divergence.
.
.
.
⚠️ Risk Reminder: For educational purposes only — not financial advice. Utilize prudent risk management.
👍 If this update helps, hit like, comment your view, and follow for timely XAUUSD alerts!

XAUUSD Bullish Signal | Technical + Custom AlgoSmart Trend Signal | Technical Analysis + Custom Algorithm
This signal is the result of a combination of classic technical trend analysis and a proprietary software I personally developed.

XAUUSD Golds Back To 3374Hello Traders! Quick read on Gold.. We are back down to the low of the day and looking for an upwards move for the rest of today and tomorrow.
A nice batch of demand that has not been tested yet and looking for the buyers to load back their positions.
Long Position
TP: 3374
1-2 Day Trade

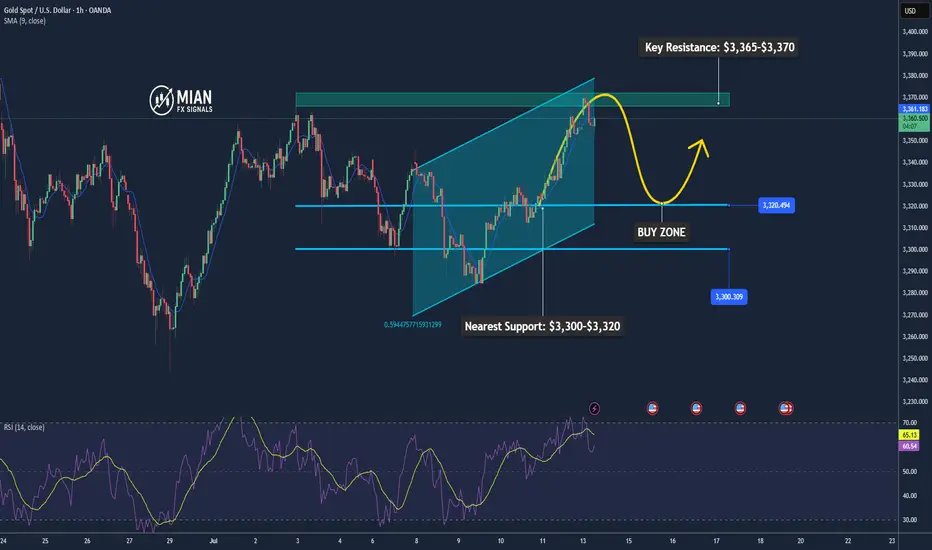
Gold May Temporarily Correct Under Resistance Pressure📊 Market Overview:
• Gold reached resistance around $3,365–$3,370/oz before showing signs of cooling due to mild profit-taking.
• Ongoing trade tensions and geopolitical risks — such as President Trump’s tariff plan — continue to support safe-haven demand, driving gold close to a three-week high.
• Strong central bank purchases reinforce the long-term bullish outlook.
📉 Technical Analysis:
• Key Resistance: $3,365–$3,370
• Nearest Support: $3,300–$3,320
• EMA 09: Price is currently below the EMA 09, suggesting a potential short-term pullback. (Price is still above the EMA50, supporting the recent uptrend.)
• Candlestick patterns / Volume / Momentum:
o RSI near 57 – neutral but slightly declining.
o MACD and ADX remain bullish, indicating underlying strength but with possible short-term consolidation ahead.
📌 Outlook:
Gold may experience a short-term pullback if it fails to break through the $3,365–$3,370 zone and geopolitical tensions ease.
However, the medium-to-long-term trend remains bullish, especially as central banks continue to accumulate gold and global risks persist.
💡 Suggested Trading Strategy:
SELL XAU/USD: $3,363–$3,366
🎯 Take Profit: 40/80/200 pips
❌ Stop Loss: $3,369
BUY XAU/USD : $3,317–$3,320
🎯 Take Profit: 40/80/200 pips
❌ Stop Loss: $3,214
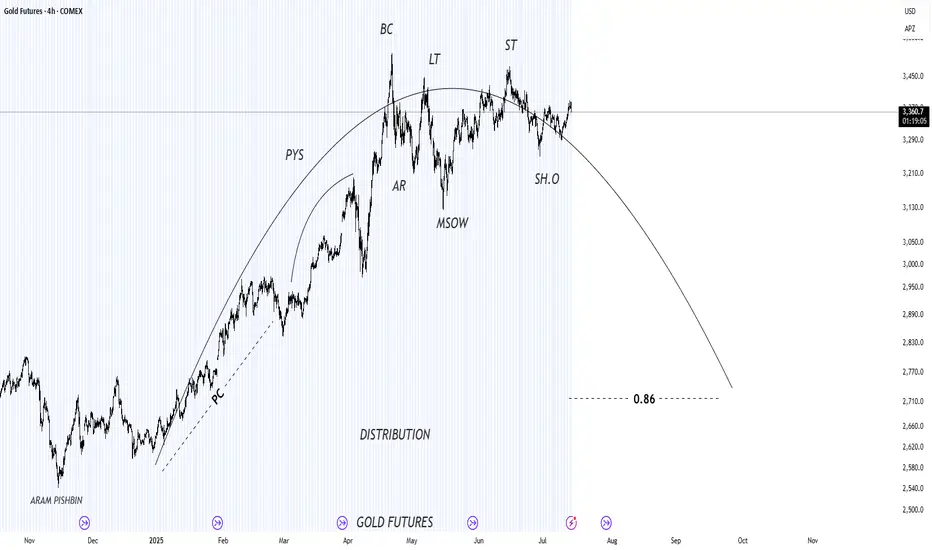
xauusdtCOINBASE:GOLQ2025
Gold analysis on the 4-hour time frame in the Wyckoff style, which is in a changing trend, thanks to the esteemed professor, Mr. Ramtia Siddiqui
DXY Weekly Update — July 14, 2025⌛ Timeframe:
.
📆 Analysis Date: July 14, 2025
.
🎯 Weekly Bias: Bearish-to-Neutral (Potential for retracement or reversal)
🔎 Market Overview:
⬇️ Persistent USD Weakness:
DXY has dropped nearly 10% YTD, marking the steepest half-year decline since 1986.
📉 Rate Cut Expectations:
Markets are pricing in a potential 75bps rate cut by the Fed in H2 2025, pushing yields and the dollar lower.
📦 Trade War Fears:
Renewed tariff risks (targeting EU, Japan, Mexico, South Korea) aren't boosting demand for USD — a signal of lost safe-haven appeal.
⚖️ Central Bank Diversification:
Global reserve managers are rotating into gold and away from USD, weakening long-term structural demand.
🌀 Sentiment & Risk Appetite:
💸 Liquidity Demand is Soft:
DXY is retesting a 4H fair value gap (97.10–97.30), suggesting potential short-term consolidation or correction.
🌍 Risk-On Mood Returns:
According to Goldman Sachs, the USD is trading more like a "risk asset" than a haven, aligning with rising equity appetite.
📉 Technical Landscape:
🟠 4H Structure:
If DXY breaks below 97.00, next support lies at 96.37, followed by 95.50–96.00.
Consolidation expected if price remains within the FVG.
🔻 Key Resistance:
97.70–98.20 zone. A break above this area could change the tone to bullish.
📌 Summary:
🔷 Fundamentals show long-term dollar weakening (rates, trade tension, reserve shifts)
🔷 Sentiment aligns with risk-on appetite and reduced USD demand
🔷 Technicals at critical level; break below 97.00 opens room for correction, break above 97.70 shifts bias bullish
.
.
.
.
🟠 Bias: Bearish to Neutral
Watch Levels: 97.00 support, 97.70–98.20 resistance
⚠️ Note: This analysis is for educational purposes only and is not financial advice. Always apply risk management.
✅ If you like this analysis, don't forget to like 👍, follow 🧠, and share your thoughts below 💬!

SellTrend Line Break
Previous Day Volume
Rejection Point
Untapped Order Point
London Session
High Structure Swing
S&P500 Slips Ahead of CPI & Earnings SeasonEquities began the week under pressure, with the S&P 500 dropping 0.5%, slipping below the 6,230-resistance area. Although the Fed minutes released last week indicate that most members are open to cutting rates this year, inflation data and second-quarter earnings could change that trajectory.
Upcoming Events to Watch:
• CPI Release (Tuesday 14:30 SAST): A cooler-than-expected print would support a breakout in risk assets. A hot reading could shift expectations toward policy tightening, weighing on equities.
• Q2 Earnings Season: Major banks including JPMorgan Chase, Wells Fargo, and Citigroup will report this week. Strong earnings may cushion the market, while any weakness could exacerbate volatility.
S&P500 Technical View:
• Immediate Resistance: 6,230
• Potential Upside: A cooler CPI could see the index rally toward 6,290.
• Support Levels: Should inflation surprise to the upside, the index may slide to 6,190, or even 6,150 in extended selling.
