GBP/AUD - Bearish Flag (10.07.2025)The GBP/AUD Pair on the M30 timeframe presents a Potential Selling Opportunity due to a recent Formation of a Bearish Flag Pattern. This suggests a shift in momentum towards the downside in the coming hours.
Possible Short Trade:
Entry: Consider Entering A Short Position around Trendline Of The Pattern.
Target Levels:
1st Support – 2.0671
2nd Support – 2.0607
🎁 Please hit the like button and
🎁 Leave a comment to support for My Post !
Your likes and comments are incredibly motivating and will encourage me to share more analysis with you.
Best Regards, KABHI_TA_TRADING
Thank you.
Disclosure: I am part of Trade Nation's Influencer program and receive a monthly fee for using their TradingView charts in my analysis.
Beyondtechnicalanalysis

Analyzing the Market with Fundamental and Technical AnalysisAnalyzing the Market with Fundamental and Technical Analysis
In addition to technical analysis, it's important to consider fundamental factors that could influence the market. News releases, economic reports, and central bank decisions can significantly impact price movements.
Fundamental Analysis:
Keep an eye on major economic indicators like NFP, CPI, and interest rate decisions. These factors can drive the market and change its trend direction.
Technical Analysis:
Use tools like EMA, Fibonacci, and Price Action to confirm the trend and identify entry points.
For daily updates and comprehensive market analysis, join my MMFLowTrading TradingView channel, where I combine both technical and fundamental analysis to give you the most accurate insights.
Conclusion:
Identifying market trends in one day doesn’t have to be complicated. By using the right tools like EMA, Fibonacci, and Price Action on TradingView, you can make better trading decisions every day. To take your trading to the next level, join my MMFLowTrading TradingView channel for daily updates, real-time trend analysis, and expert trading signals.
Ready to start trading with precision? Join my MMFLowTrading TradingView channel today for daily market insights and trading setups. Stay updated with real-time analysis, get actionable trading signals, and take your trading skills to the next level. Follow me now on TradingView!
GBP/USD - Bearish Channel (07.07.2025)The GBP/USD Pair on the M30 timeframe presents a Potential Selling Opportunity due to a recent Formation of a Bearish Channel Pattern. This suggests a shift in momentum towards the downside in the coming hours.
Possible Short Trade:
Entry: Consider Entering A Short Position around Trendline Of The Pattern.
Target Levels:
1st Support – 1.3545
2nd Support – 1.3485
🎁 Please hit the like button and
🎁 Leave a comment to support for My Post !
Your likes and comments are incredibly motivating and will encourage me to share more analysis with you.
Best Regards, KABHI_TA_TRADING
Thank you.
Disclosure: I am part of Trade Nation's Influencer program and receive a monthly fee for using their TradingView charts in my analysis.

GBP/CHF - Channel Breakout (02.07.2025)The GBP/CHF pair on the M30 timeframe presents a Potential Buying Opportunity due to a recent Formation of a Breakout Pattern. This suggests a shift in momentum towards the upside and a higher likelihood of further advances in the coming hours.
Possible Long Trade:
Entry: Consider Entering A Long Position around Trendline Of The Pattern.
Target Levels:
1st Resistance – 1.0956
2nd Resistance – 1.0996
🎁 Please hit the like button and
🎁 Leave a comment to support for My Post !
Your likes and comments are incredibly motivating and will encourage me to share more analysis with you.
Best Regards, KABHI_TA_TRADING
Thank you.
Disclosure: I am part of Trade Nation's Influencer program and receive a monthly fee for using their TradingView charts in my analysis.

The Power of Setting SL and TP: Secret to Mastering Your TradeThe Power of Setting SL and TP: The Secret to Mastering Your Trade
Hey there, traders! 👋 Let’s talk about something that can make a world of difference in your trading journey – Stop Loss (SL) and Take Profit (TP). These simple tools may look basic, but they are essential for every trader to stay consistent and profitable in the long run.
In today’s post, we’ll dive into the importance of setting SL and TP for each trade and how these two tools can change your trading game. Whether you’re new to trading or have been in the game for a while, understanding and applying SL and TP correctly is key to building a solid and profitable trading strategy. Let’s get started!
1. What Exactly Are SL and TP?
Stop Loss (SL):
A Stop Loss is the level where you decide to cut your losses if the market moves against your trade. It's your safety net, ensuring that your losses stay manageable. For example, if you’re trading XAU/USD at $1800 and don’t want to lose more than $50, you’d set your SL at $1750.
Take Profit (TP):
Take Profit is the level at which you’ll close your trade once the price reaches your desired profit. This helps you lock in profits automatically, without the temptation to stay in the market too long. For example, if you think gold will rise to $1850, you’d set your TP at that level to secure the profit.
2. Why Are SL and TP Crucial?
A. Eliminating Emotion from Your Trades
One of the hardest challenges in trading is keeping emotions out of the equation. Fear and greed can cause you to hold onto losing positions for too long or exit too soon. SL and TP automate your exits, allowing you to trade with a clear plan and reduce emotional decision-making.
B. Managing Risk Like a Pro
Risk management is the backbone of any successful trading strategy. SL limits your losses by setting a predefined level where your trade will automatically close. Without SLs, you could risk losing more than you intended, which can damage your trading account.
C. Securing Consistent Profits
TP helps you to capture profits at the right time. Without it, you might let your profits slip away as the market moves against you. A TP ensures you don’t miss out on locking in gains when the market reaches your target.
D. Building Consistency
By setting SL and TP, you create a consistent and structured approach to your trading. If you trade with a 1:2 risk-to-reward ratio, where you risk $1 to make $2, you can build long-term profitability, even if you lose some trades along the way. Consistency is the key to success in trading.
3. How to Set SL and TP Like a Pro
A. Start with Proper Analysis
Before entering any trade, always analyze the market context. Use technical analysis (like support and resistance levels, Fibonacci, and trendlines) to place your SL and TP at logical levels. For example, set your SL slightly below support for a buy trade, or slightly above resistance for a sell trade.
B. Risk-to-Reward Ratio
A good rule of thumb is to have a 1:2 risk-to-reward ratio. This means if you risk $50 on a trade, you aim to make at least $100. This allows you to lose half of your trades but still come out ahead in the long run. Always set your TP in relation to your risk tolerance.
C. Use Indicators to Help
Use indicators like EMA, RSI, Fibonacci retracements, and pivot points to determine the best levels for your SL and TP. For example, if you see a strong bullish trend and are entering a buy position, placing your TP near the next Fibonacci extension level is a great strategy.
D. Keep Volatility in Mind
Market volatility plays a big role in where you place your SL and TP. In highly volatile markets, tight SL might get hit too early. Adjust your SL to reflect the market’s movement. Similarly, your TP should be flexible enough to account for volatility.
4. Benefits of Setting SL and TP
A. Reducing Emotional Trading
Emotional trading is the quickest way to lose money. SL and TP take emotion out of the equation, making trading more objective and disciplined. You know exactly when you’re getting in, and when to get out – no guessing!
B. Avoiding Overtrading
Without clear SL and TP levels, you might overtrade, holding positions for too long or exiting too early. This lack of structure leads to emotional decisions and bad habits. Having SL and TP in place ensures that you trade only when it makes sense.
C. Gaining Confidence
By setting clear SL and TP levels, you gain confidence in your trading strategy. You know that your risk is limited and your profits are protected. This allows you to trade with a calm mindset, focusing on quality trades instead of rushing into everything.
5. Conclusion
Setting SL and TP is one of the most important skills for any trader, whether you're new to the market or experienced. They help you manage risk, capture profits, and build a disciplined approach to trading. By incorporating SL and TP into your trading plan, you can protect your capital, lock in profits, and ensure consistent growth in your trading journey.
So remember, Plan your trade and trade your plan – and always set your SL and TP before entering any trade.
Happy Trading! Stay disciplined, stay profitable! 💰🚀

USD/JPY Bearish Flag (30.06.2025)The USD/JPY Pair on the M30 timeframe presents a Potential Selling Opportunity due to a recent Formation of a Bearish Flag Breakout Pattern. This suggests a shift in momentum towards the downside in the coming hours.
Possible Short Trade:
Entry: Consider Entering A Short Position around Trendline Of The Pattern.
Target Levels:
1st Support – 143.40
2nd Support – 142.86
🎁 Please hit the like button and
🎁 Leave a comment to support for My Post !
Your likes and comments are incredibly motivating and will encourage me to share more analysis with you.
Best Regards, KABHI_TA_TRADING
Thank you.
Disclosure: I am part of Trade Nation's Influencer program and receive a monthly fee for using their TradingView charts in my analysis.

GBP/CAD - Breakout (27.06.2025)The GBP/CAD pair on the M30 timeframe presents a Potential Buying Opportunity due to a recent Formation of a Breakout Pattern. This suggests a shift in momentum towards the upside and a higher likelihood of further advances in the coming hours.
Possible Long Trade:
Entry: Consider Entering A Long Position around Trendline Of The Pattern.
Target Levels:
1st Resistance – 1..8857
2nd Resistance – 1.8909
🎁 Please hit the like button and
🎁 Leave a comment to support for My Post !
Your likes and comments are incredibly motivating and will encourage me to share more analysis with you.
Best Regards, KABHI_TA_TRADING
Thank you.
Disclosure: I am part of Trade Nation's Influencer program and receive a monthly fee for using their TradingView charts in my analysis.

XAU/USD - Channel Breakout (26.06.2025)The XAU/USD pair on the M30 timeframe presents a Potential Buying Opportunity due to a recent Formation of a Channel Breakout Pattern. This suggests a shift in momentum towards the upside and a higher likelihood of further advances in the coming hours.
Possible Long Trade:
Entry: Consider Entering A Long Position around Trendline Of The Pattern.
Target Levels:
1st Resistance – 3385
2nd Resistance – 3410
🎁 Please hit the like button and
🎁 Leave a comment to support for My Post !
Your likes and comments are incredibly motivating and will encourage me to share more analysis with you.
Best Regards, KABHI_TA_TRADING
Thank you.
Disclosure: I am part of Trade Nation's Influencer program and receive a monthly fee for using their TradingView charts in my analysis.

GBP/JPY Bullish Flag (25.06.2025) The GBP/JPY pair on the M30 timeframe presents a Potential Buying Opportunity due to a recent Formation of a Bullish Flag Pattern. This suggests a shift in momentum towards the upside and a higher likelihood of further advances in the coming hours.
Possible Long Trade:
Entry: Consider Entering A Long Position around Trendline Of The Pattern.
Target Levels:
1st Resistance – 198.46
2nd Resistance – 199.00
🎁 Please hit the like button and
🎁 Leave a comment to support for My Post !
Your likes and comments are incredibly motivating and will encourage me to share more analysis with you.
Best Regards, KABHI_TA_TRADING
Thank you.
Disclosure: I am part of Trade Nation's Influencer program and receive a monthly fee for using their TradingView charts in my analysis.

GBP/JPY Triangle Breakout (25.06.2025)The GBP/JPY Pair on the M30 timeframe presents a Potential Selling Opportunity due to a recent Formation of a Triangle Breakout Pattern. This suggests a shift in momentum towards the downside in the coming hours.
Possible Short Trade:
Entry: Consider Entering A Short Position around Trendline Of The Pattern.
Target Levels:
1st Support – 195.96
2nd Support – 195.37
🎁 Please hit the like button and
🎁 Leave a comment to support for My Post !
Your likes and comments are incredibly motivating and will encourage me to share more analysis with you.
Best Regards, KABHI_TA_TRADING
Thank you.
Disclosure: I am part of Trade Nation's Influencer program and receive a monthly fee for using their TradingView charts in my analysis.

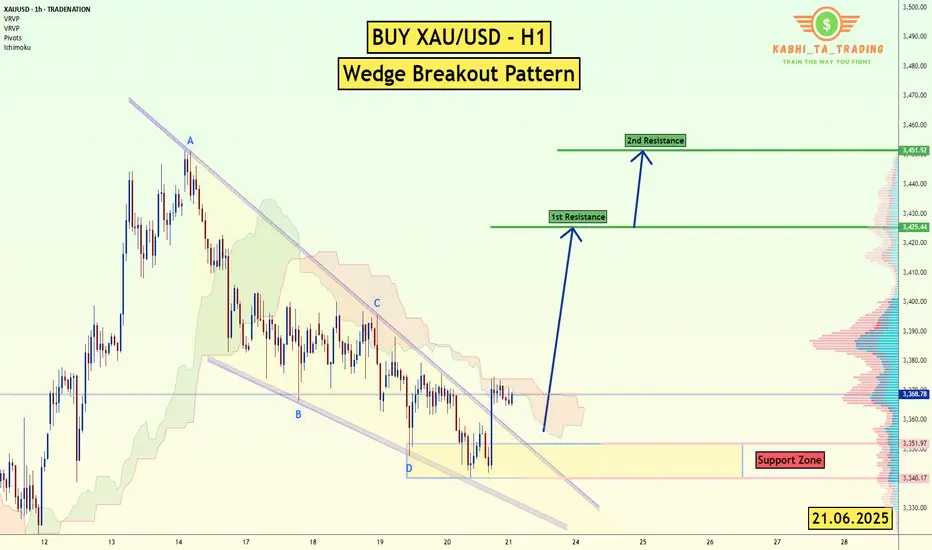
XAU/USD (Gold) - H1 - Wedge Breakout (21.06.2025)The XAU/USD pair on the H1 timeframe presents a Potential Buying Opportunity due to a recent Formation of a Wedge Breakout Pattern. This suggests a shift in momentum towards the upside and a higher likelihood of further advances in the coming Days.
Possible Long Trade:
Entry: Consider Entering A Long Position around Trendline Of The Pattern.
Target Levels:
1st Resistance – 3425
2nd Resistance – 3451
🎁 Please hit the like button and
🎁 Leave a comment to support for My Post !
Your likes and comments are incredibly motivating and will encourage me to share more analysis with you.
Best Regards, KABHI_TA_TRADING
Thank you.
Disclosure: I am part of Trade Nation's Influencer program and receive a monthly fee for using their TradingView charts in my analysis.
NZD/JPY - Triangle Breakout (23.06.2025)The NZD/JPY Pair on the H1 timeframe presents a Potential Selling Opportunity due to a recent Formation of a Triangle Breakout Pattern. This suggests a shift in momentum towards the downside in the coming hours.
Possible Short Trade:
Entry: Consider Entering A Short Position around Trendline Of The Pattern.
Target Levels:
1st Support – 86.35
2nd Support – 86.00
🎁 Please hit the like button and
🎁 Leave a comment to support for My Post !
Your likes and comments are incredibly motivating and will encourage me to share more analysis with you.
Best Regards, KABHI_TA_TRADING
Thank you.
Disclosure: I am part of Trade Nation's Influencer program and receive a monthly fee for using their TradingView charts in my analysis.

EUR/USD - H4 - Triangle Formation (31.05.2025)The EUR/USD pair on the H4 timeframe presents a recent Formation of a Triangle Pattern.
1. Wait for Breakout with Good Volume
2. Conformation in short Timeframe Must
🎁 Please hit the like button and
🎁 Leave a comment to support for My Post !
Fundamental Updates :
Dollar mixed on tariff uncertainty, U.S. President Donald Trump to battle a U.S. trade court ruling that blocked most of his proposed tariffs.
Your likes and comments are incredibly motivating and will encourage me to share more analysis with you.
Best Regards, KABHI_TA_TRADING
Thank you.
Disclosure: I am part of Trade Nation's Influencer program and receive a monthly fee for using their TradingView charts in my analysis.

GBP/USD - For FOMC & Fed Interest RateThe GBP/USD pair on the M30 timeframe presents a Potential Buying Opportunity due to a recent Formation of a Channel Pattern. This suggests a shift in momentum towards the upside and a higher likelihood of further advances in the coming hours.
Possible Long Trade:
Entry: Consider Entering A Long Position around Trendline Of The Pattern.
Target Levels:
1st Resistance – 1.3567
2nd Resistance – 1.3682
🎁 Please hit the like button and
🎁 Leave a comment to support for My Post !
Your likes and comments are incredibly motivating and will encourage me to share more analysis with you.
Best Regards, KABHI_TA_TRADING
Thank you.
Disclosure: I am part of Trade Nation's Influencer program and receive a monthly fee for using their TradingView charts in my analysis.

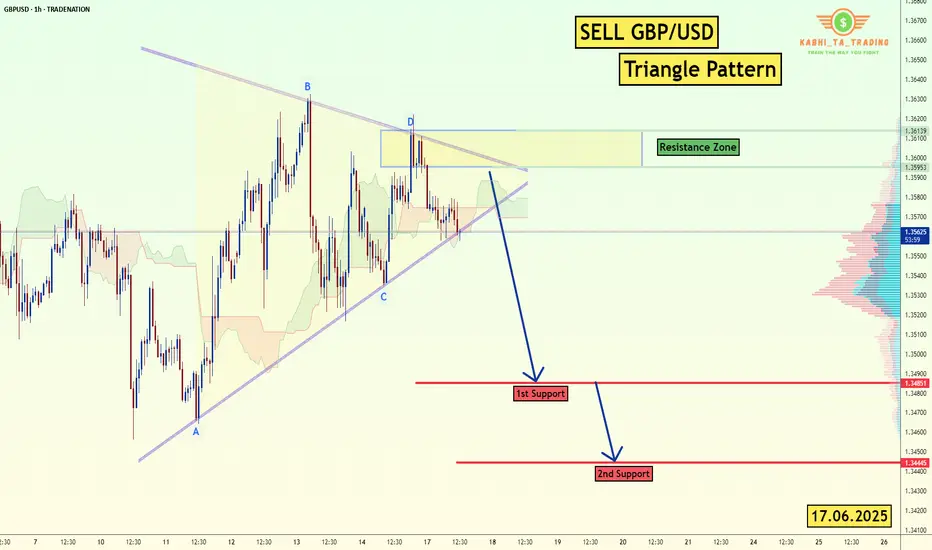
GBP/USD - H1-Triangle Breakout (17.06.2025)The GBP/USD Pair on the H1 timeframe presents a Potential Selling Opportunity due to a recent Formation of a Triangle Breakout Pattern. This suggests a shift in momentum towards the downside in the coming hours.
Possible Short Trade:
Entry: Consider Entering A Short Position around Trendline Of The Pattern.
Target Levels:
1st Support – 1.3485
2nd Support – 1.3444
🎁 Please hit the like button and
🎁 Leave a comment to support for My Post !
Your likes and comments are incredibly motivating and will encourage me to share more analysis with you.
Best Regards, KABHI_TA_TRADING
Thank you.
Disclosure: I am part of Trade Nation's Influencer program and receive a monthly fee for using their TradingView charts in my analysis.
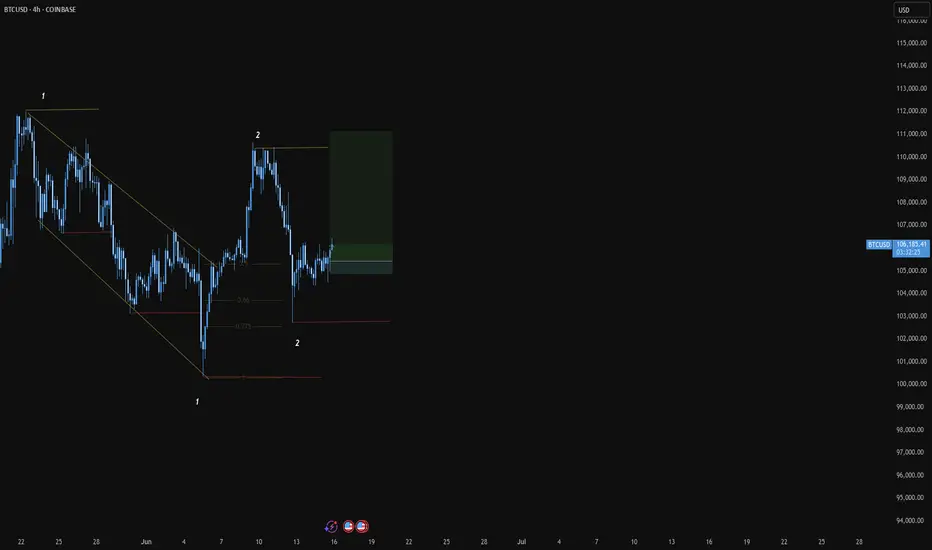
BTC/USD BUYS Expecting buying pressure around this area to form a 3rd possible HH to the 2nd but LH to the 1st high. Retracement filled my areas and had decent buying pressure. Current SL is set to BE due to not being able to view this trade play out fully. Nice bear channel Bull BO to retracement buys for an attempt to HH.
GBP/JPY - Triangle Breakout (12.06.2025)The GBP/JPY Pair on the M30 timeframe presents a Potential Selling Opportunity due to a recent Formation of a Triangle Breakout Pattern. This suggests a shift in momentum towards the downside in the coming hours.
Possible Short Trade:
Entry: Consider Entering A Short Position around Trendline Of The Pattern.
Target Levels:
1st Support – 194.34
2nd Support – 193.76
🎁 Please hit the like button and
🎁 Leave a comment to support for My Post !
Your likes and comments are incredibly motivating and will encourage me to share more analysis with you.
Best Regards, KABHI_TA_TRADING
Thank you.
Disclosure: I am part of Trade Nation's Influencer program and receive a monthly fee for using their TradingView charts in my analysis.

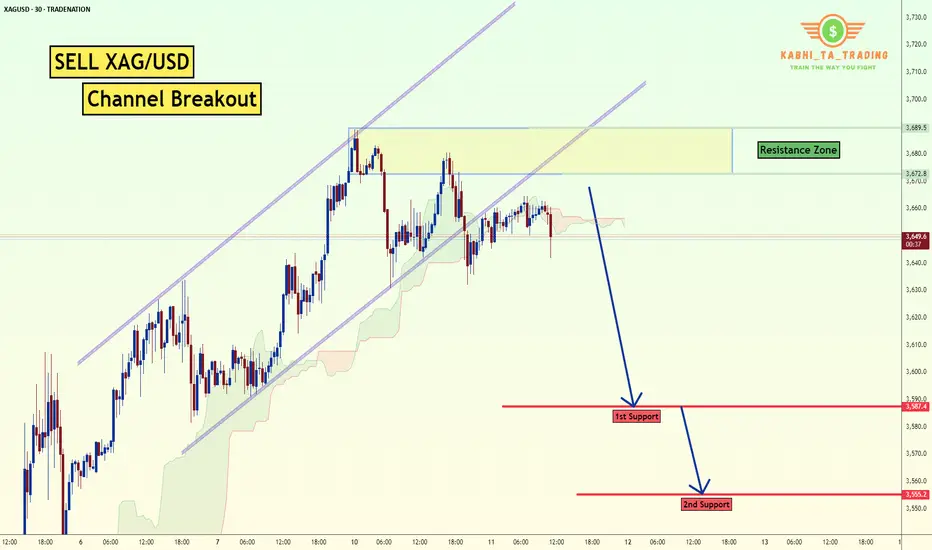
XAG/USD - Channel Breakout (11.06.2025) The XAG/USD Pair on the M30 timeframe presents a Potential Selling Opportunity due to a recent Formation of a CHannel Breakout Pattern. This suggests a shift in momentum towards the downside in the coming hours.
Possible Short Trade:
Entry: Consider Entering A Short Position around Trendline Of The Pattern.
Target Levels:
1st Support – 3587
2nd Support – 3555
🎁 Please hit the like button and
🎁 Leave a comment to support for My Post !
Your likes and comments are incredibly motivating and will encourage me to share more analysis with you.
Best Regards, KABHI_TA_TRADING
Thank you.
Disclosure: I am part of Trade Nation's Influencer program and receive a monthly fee for using their TradingView charts in my analysis.
USD/CAD - Channel Breakout (10.06.2025)The USD/CAD pair on the M30 timeframe presents a Potential Buying Opportunity due to a recent Formation of a Channel Breakout Pattern. This suggests a shift in momentum towards the upside and a higher likelihood of further advances in the coming hours.
Possible Long Trade:
Entry: Consider Entering A Long Position around Trendline Of The Pattern.
Target Levels:
1st Resistance – 1.3757
2nd Resistance – 1.3792
🎁 Please hit the like button and
🎁 Leave a comment to support for My Post !
Your likes and comments are incredibly motivating and will encourage me to share more analysis with you.
Best Regards, KABHI_TA_TRADING
Thank you.
Disclosure: I am part of Trade Nation's Influencer program and receive a monthly fee for using their TradingView charts in my analysis.

USD/JPY - Triangle Breakout (06.06.2025)The USD/JPY pair on the M30 timeframe presents a Potential Buying Opportunity due to a recent Formation of a Triangle Pattern. This suggests a shift in momentum towards the upside and a higher likelihood of further advances in the coming hours.
Possible Long Trade:
Entry: Consider Entering A Long Position around Trendline Of The Pattern.
Target Levels:
1st Resistance – 144.94
2nd Resistance – 145.52
🎁 Please hit the like button and
🎁 Leave a comment to support for My Post !
Your likes and comments are incredibly motivating and will encourage me to share more analysis with you.
Best Regards, KABHI_TA_TRADING
Thank you.
Disclosure: I am part of Trade Nation's Influencer program and receive a monthly fee for using their TradingView charts in my analysis.

USD/CHF - Triangle Breakout (06.06.2025)The USD/CHF pair on the M30 timeframe presents a Potential Buying Opportunity due to a recent Formation of a Triangle Pattern. This suggests a shift in momentum towards the upside and a higher likelihood of further advances in the coming hours.
Possible Long Trade:
Entry: Consider Entering A Long Position around Trendline Of The Pattern.
Target Levels:
1st Resistance – 0.8263
2nd Resistance – 0.8227
🎁 Please hit the like button and
🎁 Leave a comment to support for My Post !
Your likes and comments are incredibly motivating and will encourage me to share more analysis with you.
Best Regards, KABHI_TA_TRADING
Thank you.
Disclosure: I am part of Trade Nation's Influencer program and receive a monthly fee for using their TradingView charts in my analysis.

USD/CAD - Bearish Flag (04.06.2025)The USD/CAD Pair on the M30 timeframe presents a Potential Selling Opportunity due to a recent Formation of a Bearish Flag Pattern. This suggests a shift in momentum towards the downside in the coming hours.
Possible Short Trade:
Entry: Consider Entering A Short Position around Trendline Of The Pattern.
Target Levels:
1st Support – 1.3645
2nd Support – 1.3605
🎁 Please hit the like button and
🎁 Leave a comment to support for My Post !
Your likes and comments are incredibly motivating and will encourage me to share more analysis with you.
Best Regards, KABHI_TA_TRADING
Thank you.
Disclosure: I am part of Trade Nation's Influencer program and receive a monthly fee for using their TradingView charts in my analysis.

Bitcoin's Roadmap: Price Structure, Fair Value & Market RhythmSince bottoming on November 21, 2022, Bitcoin has embarked on a remarkable bull run, rising +623.5% over 927 days and reaching a new all-time high (ATH) of ~112K.
When compared to the previous bull cycle, spanning 1061 days and producing a +2086% gain, this current rally shows signs of diminishing returns, a typical behaviour of maturing markets. Traders now face a critical question: has Bitcoin peaked for this cycle, or is another surge toward ~120K+ possible?
Historical Echoes: Elliott Wave Comparison
The 2018–2021 bull market formed a five-wave Elliott structure. That cycle ended with a -77.5% correction. The current cycle similarly traces out a completed five-wave advance from the $15.5K low, suggesting we may now be in a corrective phase.
Current hypothesis: Bitcoin is in Wave B of an ABC correction, with Wave C potentially targeting $64K–$70K.
Harmonic Confirmation: Cypher Sigma Pattern
A refined harmonic formation, I call it the Cypher Sigma Harmonic Pattern (CSHP) and it has proven highly effective in volatile assets like Bitcoin. It differs from the classic Cypher by:
BC projection: 1.07–1.136 of XA (vs. 1.272–1.414)
CD retracement: 0.786–0.886 of XC
BD extension: 1.272–1.618 of BC (not present in traditional Cypher but often targets 1.272-2.0)
In 2022, this pattern predicted the bottom near $16K. Currently, another Cypher Sigma is potentially forming, pointing to a possible correction to ~$64K. This target aligns with historical level (the 2021 ATH zone) and represents a possible -40% pullback.
Multi-Layered Technical Confluence
Pitchfork Resistance: Bitcoin rejected the upper resistance (Fib 1.0–1.136 zone)
Pitchfork Golden Pocket Support: ~$64K matches the golden pocket and high-liquidity area
Fibonacci Circles: Rejection precisely at the 1.618–1.65 circle arc (~$112K)
Speed Fan 0.618: Key structural support intersects projected retracement zone
Previous 2021 ATH
Together, these tools strongly support the hypothesis of a macro top forming.
Fair Value Trend Model (FVTM) – New Indicator
As part of ongoing research into Bitcoin’s long-term valuation, I developed the Fair Value Trend Model—a logarithmic regression-based indicator tailored for Bitcoin. Here is an example on the monthly timeframe.
Key Features:
Computes a log-log regression: ln(Price) vs ln(Days since inception)
Yields a power-law growth curve: F(t) = C · ^b
Includes dynamic channel bands at user-defined percentage offsets
Projects the trend forward in time with linear extrapolation
I have just freshly published this indicator for free on TradingView. Visit my profile, add it to your chart, and explore how Bitcoin consistently revisits its fair value in bear markets before launching new macro waves.
Use Cases:
Identify overextensions above the fair value channel
Spot mean-reversion setups near the lower channel band
Gauge long-term trend continuation via slope and forecast
The indicator is best used on daily, weekly and monthly charts, and it supports both all-time and rolling-window modes.
Educational Insight:
The Fair Value Trend Model isn’t just a tool! It's a lens to view the long-term rhythm of the Bitcoin market. By understanding where the fair value lies, you gain the clarity to separate short-term volatility from long-term opportunity.
Every great trader starts with a desire to understand. If you're learning, experimenting, and observing patiently—you’re on the right path. Let this model be your guide through the noise. Trust the math, respect the cycles, and never stop refining your edge.
Study day and swing trading, improve your technical and psychological skills, and wait patiently for high-probability trade setups, whether short-, medium-, or long-term. Being patient is key.
Psychological Insight: Mastery Over Impulse
The greatest returns favour the patient. Traders who ignored the noise in 2022 and accumulated around $16K were rewarded exponentially. As Bitcoin potentially enters a correction, the same principle applies: monitor, learn, and prepare—not panic.
Top-tier traders execute based on structure, not emotion. This cycle will reward those who:
-> Study multi-timeframe confluences
Outlook: Bearish Retracement, Bullish Opportunity
While a push to $120K+ is possible, the confluence of Elliott Wave, harmonic patterns, and macro tools suggest a potential 40% retracement into ~$64K by end of 2025/early 2026. This aligns with historical patterns and may offer a great buying opportunity.
This cycle isn’t about catching the exact top—it’s about navigating it intelligently. Use tools that reflect structural value, not just reactive price action. Combine the Fair Value Trend Model with other tools to gain clarity. Most importantly: remain curious, remain disciplined.
Happy trading.
Thanks for reading =) stay sharp, stay patient, and keep evolving 🚀
_________________________________
If you found this helpful, leave a like and comment below! Got requests for the next technical analysis? Let me know.
