GBPAUD / 1H / BULLHey There;
My GBPAUD target level is 2.10269
My target may come a bit late because this trade is a swing trade.
I would appreciate it very much if you do not miss your likes within the framework of Respect for Labor Thank you very much in advance
Beyondtechnicalanalysis

GBP/JPY Bullish Flag (29.04.2025)The GBP/JPY pair on the M30 timeframe presents a Potential Buying Opportunity due to a recent Formation of a Breakout Pattern. This suggests a shift in momentum towards the upside and a higher likelihood of further advances in the coming hours.
Possible Long Trade:
Entry: Consider Entering A Long Position around Trendline Of The Pattern.
Target Levels:
1st Resistance – 192.18
2nd Resistance – 192.70
🎁 Please hit the like button and
🎁 Leave a comment to support for My Post !
Your likes and comments are incredibly motivating and will encourage me to share more analysis with you.
Best Regards, KABHI_TA_TRADING
Thank you.

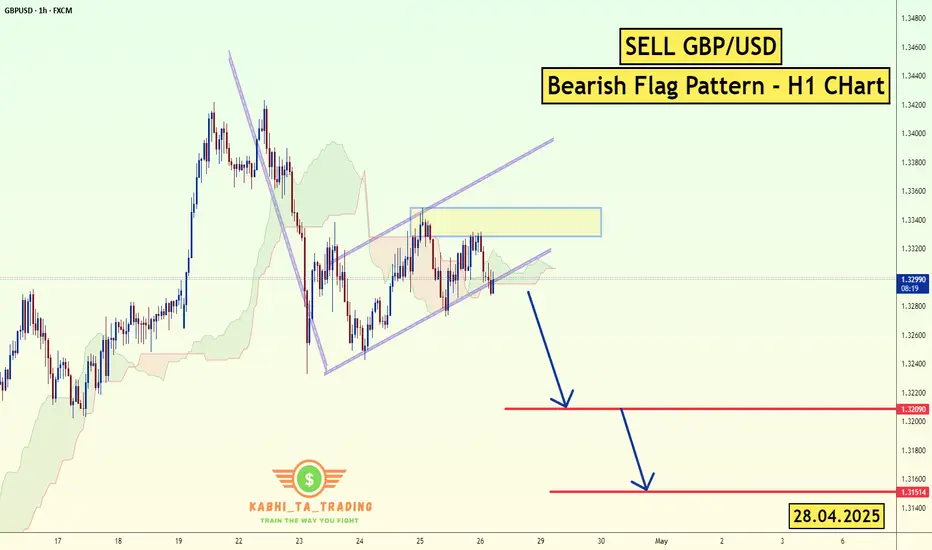
GBP/USD - H1 - Bearish Flag (28.04.2025)FX:GBPUSD The GBP/USD Pair on the H1 timeframe presents a Potential Selling Opportunity due to a recent Formation of a Bearish Flag Pattern. This suggests a shift in momentum towards the downside in the coming hours.
Possible Short Trade:
Entry: Consider Entering A Short Position around Trendline Of The Pattern.
Target Levels:
1st Support – 1.3209
2nd Support – 1.3151
🎁 Please hit the like button and
🎁 Leave a comment to support for My Post !
Your likes and comments are incredibly motivating and will encourage me to share more analysis with you.
Best Regards, KABHI_TA_TRADING
Thank you.
Fundamental Update :
on Monday as the trade tensions between the U.S. and China provided some relief to investors, while a stronger dollar further weighed on prices.
The U.S. dollar TVC:DXY rose 0.2% against a basket of currencies, making bullion more expensive for overseas buyers. TVC:DJI SP:SPX NASDAQ:IXIC also rising .
Bitcoin has broken above the $86,000 zone, just as we anticipateBitcoin has broken above the $86,000 zone, just as we anticipated.
🔹 On-Chain Insights:
• Long-Term Holders: Mild distribution — profit-taking phase
• Network Activity: Steady — strong and healthy
• Sentiment: Bullish — weak USD and rising institutional inflows
🔹 Macro Overview:
• U.S.–China tensions and Fed uncertainty boost Bitcoin’s safe-haven appeal
• Institutions are steadily increasing exposure — a strong positive signal
Stay tuned with megvipofficial for more accurate updates and premium crypto signals!

FET/USDT - Trendline Breakout (22.04.2025)The FET/USDT Pair on the M30 timeframe presents a Potential Selling Opportunity due to a recent Formation of a Breakout Pattern. This suggests a shift in momentum towards the downside in the coming hours.
Possible Short Trade:
Entry: Consider Entering A Short Position around Trendline Of The Pattern.
Target Levels:
1st Support – 0.553
2nd Support – 0.516
🎁 Please hit the like button and
🎁 Leave a comment to support for My Post !
Your likes and comments are incredibly motivating and will encourage me to share more analysis with you.
Best Regards, KABHI_TA_TRADING
Thank you.

USD/CAD - Channel Pattern (22.04.2025)The USD/CAD Pair on the M30 timeframe presents a Potential Selling Opportunity due to a recent Formation of a Channel Pattern. This suggests a shift in momentum towards the downside in the coming hours.
Possible Short Trade:
Entry: Consider Entering A Short Position around Trendline Of The Pattern.
Target Levels:
1st Support – 1.3771
2nd Support – 1.3745
🎁 Please hit the like button and
🎁 Leave a comment to support for My Post !
Your likes and comments are incredibly motivating and will encourage me to share more analysis with you.
Best Regards, KABHI_TA_TRADING
Thank you.

ENA/USDT Breakout Pattern (18.04.2025)The ENA/USDT pair on the M30 timeframe presents a Potential Buying Opportunity due to a recent Formation of a Breakout Pattern. This suggests a shift in momentum towards the upside and a higher likelihood of further advances in the coming hours.
Possible Long Trade:
Entry: Consider Entering A Long Position around Trendline Of The Pattern.
Target Levels:
1st Resistance – 0.3015
2nd Resistance – 0.3217
🎁 Please hit the like button and
🎁 Leave a comment to support for My Post !
Your likes and comments are incredibly motivating and will encourage me to share more analysis with you.
Best Regards, KABHI_TA_TRADING
Thank you.

LEAP: GBPUSD Week 17 Swing Zone/LevelsLast week saw a good pinch on market pips. Aim to continue as always.
Price swing levels are set; either a or b, price action directs.
Levels/zones are calculated based on previous week H/L

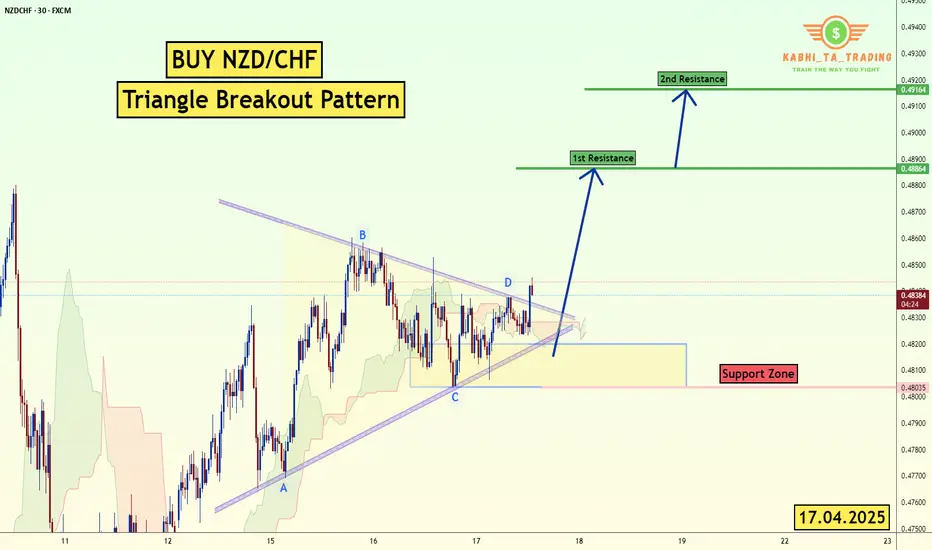
NZD/CHF Triangle Breakout (17.04.2025)The NZD/CHF pair on the M30 timeframe presents a Potential Buying Opportunity due to a recent Formation of a Breakout Pattern. This suggests a shift in momentum towards the upside and a higher likelihood of further advances in the coming hours.
Possible Long Trade:
Entry: Consider Entering A Long Position around Trendline Of The Pattern.
Target Levels:
1st Resistance – 0.4886
2nd Resistance – 0.4916
🎁 Please hit the like button and
🎁 Leave a comment to support for My Post !
Your likes and comments are incredibly motivating and will encourage me to share more analysis with you.
Best Regards, KABHI_TA_TRADING
Thank you.
GBP/USD Fundamental Update (17.04.2025)The GBP/USD pair on the M30 timeframe presents a Potential Buying Opportunity due to a recent Formation of a Breakout Pattern. This suggests a shift in momentum towards the upside and a higher likelihood of further advances in the coming hours.
Possible Long Trade:
Entry: Consider Entering A Long Position around Trendline Of The Pattern.
Target Levels:
1st Resistance – 1.3320
2nd Resistance – 1.3369
🎁 Please hit the like button and
🎁 Leave a comment to support for My Post !
Your likes and comments are incredibly motivating and will encourage me to share more analysis with you.
Best Regards, KABHI_TA_TRADING
Thank you.

XRP/USDT Breakout Pattern (15.04.2025)The XRP/USDT Pair on the M30 timeframe presents a Potential Selling Opportunity due to a recent Formation of a Breakout Pattern. This suggests a shift in momentum towards the downside in the coming hours.
Possible Short Trade:
Entry: Consider Entering A Short Position around Trendline Of The Pattern.
Target Levels:
1st Support – 2.0158
2nd Support – 1.9362
🎁 Please hit the like button and
🎁 Leave a comment to support for My Post !
Your likes and comments are incredibly motivating and will encourage me to share more analysis with you.
Best Regards, KABHI_TA_TRADING
Thank you.

NZD/CAD Fundamental Update (17.04.2025) The NZD/CAD Pair on the M30 timeframe presents a Potential Selling Opportunity due to a recent Formation of a Breakout Pattern. This suggests a shift in momentum towards the downside in the coming hours.
Possible Short Trade:
Entry: Consider Entering A Short Position around Trendline Of The Pattern.
Target Levels:
1st Support – 0.8138
2nd Support – 0.8077
🎁 Please hit the like button and
🎁 Leave a comment to support for My Post !
Your likes and comments are incredibly motivating and will encourage me to share more analysis with you.
Best Regards, KABHI_TA_TRADING
Thank you.

XRP/USDT I Reverse Short Squeeze Alert! Resistance at 2 USDTHey Traders after the success of my Previous trade this month on NASDAQ:HOOD hitting Target 1 & 2 in 2 days more than 16%+
With a Similar Trade setup But Crypto I bring you today
BINANCE:XRPUSDT
Short opportunity
- Market structure
- Head and shoulder pattern
- Currently will be trading at supply zone which was a recent support and now an ideal place for a reversal which is taking place as we speak- 4 Hour TF.
- Breakdown and retest
- Risk Aversion Dynamics in Cryptocurrency Markets
PROTIP/-
Entry on Bearish candle stick pattern on Current Levels
Stop Loss : 2.2292
Target 1 : 1.4707
Target 2 : 1.0507
Technical View
The orange circle marks a double top within the supply zone, acting as the shoulders of a larger head and shoulders pattern, suggesting strong resistance.
Bearish Trendline
breakdown + Retest
Risk Aversion Dynamics in Cryptocurrency Markets
Fundamental View - How Current Affairs can effect this pair!
The proposed imposition of significant tariffs, such as the 60% levy on Chinese imports suggested by former U.S. President Donald Trump, could trigger a chain reaction across global markets. This scenario would likely amplify risk aversion among investors, potentially catalyzing a sell-off in risk-sensitive assets like XRP (Ripple) in favor of perceived safe havens such as the U.S. dollar (and by extension, Tether/USDT). Below, we analyze the mechanics of this relationship and its implications for the XRP/USDT trading pair.
1. Tariff Escalation and Its Macroeconomic Consequences
1.1 Direct Impact on China’s Economy
A 60% tariff on Chinese exports to the U.S. would directly reduce China’s export competitiveness, potentially lowering its GDP growth by 1.5–2.5 percentage points annually, according to UBS economists. This slowdown would exacerbate existing vulnerabilities in China’s economy, including a property market crisis, weak domestic demand, and deflationary pressures (June 2024 CPI: 0.2% YoY). Reduced economic activity in China—the world’s second-largest economy—could dampen global trade volumes and commodity prices, indirectly affecting risk sentiment in financial markets.
1.2 Global Spillover Effects
The UBS analysis highlights that retaliatory measures by China or other nations could amplify trade fragmentation, further destabilizing supply chains and corporate earnings. For example, the April 2025 announcement of 25% U.S. tariffs on automotive imports triggered a 2.9% drop in the S&P 500 and a 5–7% decline in major Asian equity indices. Such volatility often precedes broader risk aversion, as investors reassess exposure to growth-dependent assets.
2. Risk Aversion Dynamics in Cryptocurrency Markets
2.1 Flight to Safety and USD Appreciation
During periods of economic uncertainty, capital typically flows into safe-haven assets like U.S. Treasuries and the dollar. Tether (USDT), a stable coin pegged 1:1 to the USD, often benefits from this dynamic as crypto traders seek stability. For instance, Bitcoin’s role as a “weak safe haven” for the USD in acute crises suggests that stable coins like USDT could see increased demand during tariff-induced turmoil, while altcoins like XRP face selling pressure.
2.2 XRP’s Sensitivity to Risk Sentiment
XRP, unlike Bitcoin, lacks established safe-haven credentials. Its price action in Q2 2025 exemplifies this vulnerability: a 7.5% decline over 30 days (peaking at 2.57 USDT on March 19 and bottoming at 1.64 USDT on April 7). This volatility aligns with broader patterns where altcoins underperform during risk-off periods. A global slowdown would likely intensify this trend, as retail and institutional investors reduce exposure to speculative crypto assets.
3. Mechanism: From Tariffs to XRP/USDT Price Decline
3.1 Investor Behavior in Risk-Off Environments
Tariff Announcements → Equity Market Sell-Off: The April 2025 auto tariffs caused a 6–7% drop in Asian equities, signaling growing risk aversion.
Liquidity Reallocation: Investors exit equities and crypto (including XRP) to hold cash or cash equivalents like USDT.
USD/USDT Demand Surge: Increased demand for USD lifts USDT’s relative value, pressuring XRP/USDT downward.
3.2 Technical and Fundamental Pressure on XRP
Supply-Demand Imbalance: As sellers dominate XRP markets, the token’s price in USDT terms declines. The 14.56% 90-day volatility in XRP/USDT suggests heightened sensitivity to macroeconomic shocks.
Liquidity Crunch: A broader crypto market downturn could reduce trading volumes, exacerbating price swings.
4. Historical Precedents and Limitations
4.1 Bitcoin’s Mixed Performance as a Hedge
While Bitcoin has shown limited safe-haven properties for the USD in short-term crises, its decoupling from altcoins like XRP during stress periods is well-documented. For example, Bitcoin’s 40% rebound post-COVID crash contrasted with XRP’s prolonged slump in 2020–2021.
4.2 Mitigating Factors
Stimulus Measures: If China implements aggressive fiscal stimulus, as UBS posits, a partial recovery in risk appetite could cushion XRP’s decline.
Crypto-Specific Catalysts: Regulatory clarity or Ripple-related developments (e.g., SEC case resolutions) could counteract macro-driven selling.
5. Conclusion: Bearish Outlook for XRP/USDT in Tariff Scenario
In a tariff-driven slowdown, the XRP/USDT pair faces downward pressure due to:
Risk Aversion: Capital rotation from crypto to stable coins.
USD Strength: USDT demand surges as a proxy for dollar safety.
Altcoin Underperformance: Historical precedent of XRP lagging during macro stress.
People interested should monitor China’s policy response and U.S. tariff implementation timelines, as these factors will determine the severity of XRP/USDT’s downside. A breach below the April 7 low of 1.64 USDT could signal prolonged bearish momentum.
This analysis synthesizes macroeconomic triggers, market psychology, and cryptocurrency-specific dynamics to outline a plausible pathway for XRP/USDT depreciation amid escalating trade tensions.
Not An Investment Advise

USD/CAD Breakout Pattern (15.04.2025)The USD/CAD pair on the M30 timeframe presents a Potential Buying Opportunity due to a recent Formation of a Breakout Pattern. This suggests a shift in momentum towards the upside and a higher likelihood of further advances in the coming hours.
Possible Long Trade:
Entry: Consider Entering A Long Position around Trendline Of The Pattern.
Target Levels:
1st Resistance – 1.4034
2nd Resistance – 1.4131
🎁 Please hit the like button and
🎁 Leave a comment to support for My Post !
Your likes and comments are incredibly motivating and will encourage me to share more analysis with you.
Best Regards, KABHI_TA_TRADING
Thank you.

AUD/NZD Triangle Breakout (15.04.2025)The AUD/NZD Pair on the M30 timeframe presents a Potential Selling Opportunity due to a recent Formation of a Triangle Breakout Pattern. This suggests a shift in momentum towards the downside in the coming hours.
Possible Short Trade:
Entry: Consider Entering A Short Position around Trendline Of The Pattern.
Target Levels:
1st Support – 1.0666
2nd Support – 1.0617
🎁 Please hit the like button and
🎁 Leave a comment to support for My Post !
Your likes and comments are incredibly motivating and will encourage me to share more analysis with you.
Best Regards, KABHI_TA_TRADING
Thank you.

GBP/JPY Triangle Breakout (11.04.2025)The GBP/JPY Pair on the M30 timeframe presents a Potential Selling Opportunity due to a recent Formation of a Triangle Breakout Pattern. This suggests a shift in momentum towards the downside in the coming hours.
Possible Short Trade:
Entry: Consider Entering A Short Position around Trendline Of The Pattern.
Target Levels:
1st Support – 184.40
2nd Support – 182.60
🎁 Please hit the like button and
🎁 Leave a comment to support for My Post !
Your likes and comments are incredibly motivating and will encourage me to share more analysis with you.
Best Regards, KABHI_TA_TRADING
Thank you.

EUR/USD Triangle Breakout (07.04.2025)The EUR/USD Pair on the M30 timeframe presents a Potential Selling Opportunity due to a recent Formation of a Triangle Breakout Pattern. This suggests a shift in momentum towards the downside in the coming hours.
Possible Short Trade:
Entry: Consider Entering A Short Position around Trendline Of The Pattern.
Target Levels:
1st Support – 1.0825
2nd Support – 1.0719
🎁 Please hit the like button and
🎁 Leave a comment to support for My Post !
Your likes and comments are incredibly motivating and will encourage me to share more analysis with you.
Best Regards, KABHI_TA_TRADING
Thank you.

GOLDThis chart represents Gold (XAU/USD) on a 1-hour timeframe. Several key price levels and technical patterns are identified, including resistance zones, FVG (Fair Value Gaps), and target levels. Let's break down the analysis:
Key Observations:
1. Price Action & Trend:
- The price of Gold has been moving downward, as seen from the red trendlines marking a downtrend. The price has faced resistance around the 3,141.644 level, which has acted as a strong supply zone. Following this, Gold showed a sharp decline towards lower levels.
2. Resistance Zone:
- The resistance zone is marked at 3,141.644, which corresponds to a region where the price has previously encountered selling pressure. This level seems to have rejected the price multiple times, confirming it…- The FVG gap is highlighted around the range 3,120.00 - 3,141.644. An FVG represents an area where the price imbalance occurs, typically after a sharp price movement. In many cases, the market returns to fill the gap before continuing in the direction of the initial move. The FVG zone in this chart likely indicates a potential for a price retracement or consolidation before further price action.
- As the price moves downward, the FVG zone is tested, and it might act as a rejection zone if the price moves back into it, suggesting a short trade opportunity.
4. Downward Price Movement:
- The sharp bearish movement observed from the resistance level at 3,141.644 shows a breakdown, confirming a trend reversal. This move pushes the price below the previous su…

XAU/USD - H1 Chart - Trendline Breakout (27.03.2025)The XAU/USD pair on the H1 timeframe presents a Potential Buying Opportunity due to a recent Formation of a Breakout Pattern. This suggests a shift in momentum towards the upside and a higher likelihood of further advances in the coming hours.
Possible Long Trade:
Entry: Consider Entering A Long Position around Trendline Of The Pattern.
Target Levels:
1st Resistance – 3051
2nd Resistance – 3065
🎁 Please hit the like button and
🎁 Leave a comment to support for My Post !
Your likes and comments are incredibly motivating and will encourage me to share more analysis with you.
Best Regards, KABHI_TA_TRADING
Thank you.

CHF/JPY Triangle Pattern (27.3.25)The CHF/JPY Pair on the M30 timeframe presents a Potential Selling Opportunity due to a recent Formation of a Triangle Pattern. This suggests a shift in momentum towards the downside in the coming hours.
Possible Short Trade:
Entry: Consider Entering A Short Position around Trendline Of The Pattern.
Target Levels:
1st Support – 169.06
2nd Support – 168.46
🎁 Please hit the like button and
🎁 Leave a comment to support for My Post !
Your likes and comments are incredibly motivating and will encourage me to share more analysis with you.
Best Regards, KABHI_TA_TRADING
Thank you.

Bull Trap Confirmed: HOOD's 8% Rally Faces ExhaustionHey Traders after the success of our last month trade on Tesla hitting all targets more than 35%+
With a Similar Trade setup I bring you today the NASDAQ:HOOD
Short opportunity on Hood
Based on Technical + Fundamental View
-Market structure
-Head and shoulder pattern
-Currently will be trading at supply zone which was a recent support and now an ideal place for a reversal to create the right shoulder of the bigger head and shoulder pattern - Daily time frame.
1. Declining User Growth and Transaction-Based Revenue
2. Regulatory and Legal Challenges
3. Rising Costs and Profitability Pressures
4. Intense Industry Competition
5. Macroeconomic and Market Volatility
Technical View
Head and shoulder pattern - Pretty visible. Right shoulder is yet to be formed, Which makes an ideal place to SELL with a great Risk Reward ratio.
Pro Tip
Wait for a bearish candle stick pattern to execute trades on end of the day keeping stop loss somewhere above the supply zone.
Target 1 - 35.52$
Target 2 - 30.81$
Target 3 - 26.26$
Stop Loss - 44.72$
Fundamental View
1. Declining User Growth and Transaction-Based Revenue
Robinhood’s revenue model relies heavily on Payment for Order Flow (PFOF), which makes it vulnerable to fluctuations in trading activity. After a pandemic-driven surge in 2020–2021, user growth stalled, with monthly active users dropping 34% YoY to 14 million by mid-2022. Transaction revenue fell 55% in Q2 2022, and while assets under custody grew to $140 billion by Q2 2024, the platform’s dependence on volatile crypto and meme-stock trading amplified revenue instability.
2. Regulatory and Legal Challenges
The SEC’s scrutiny of PFOF and proposed trading rule changes threaten Robinhood’s core revenue source. In 2022, New York regulators fined Robinhood’s crypto unit $30 million for anti-money laundering violations. Ongoing legal risks, including backlash from the 2021 GameStop trading restrictions, have further eroded institutional trust.
3. Rising Costs and Profitability Pressures
Operating expenses surged due to aggressive marketing, technology upgrades, and compliance investments. Despite workforce reductions (23% layoffs in 2022), profitability remains strained. The company’s shift toward diversified products like retirement accounts and credit cards has yet to offset these costs.
4. Intense Industry Competition
Traditional brokers like Fidelity and Charles Schwab adopted zero-commission trading, neutralizing Robinhood’s initial edge. Newer platforms like Webull and Public.com also captured younger investors with advanced features, while Robinhood’s limited product range (e.g., lack of wealth management services) hindered retention of high-net-worth clients.
5. Macroeconomic and Market Volatility
- Interest Rate Sensitivity: As a growth stock, HOOD declined amid rising rates in 2022–2023 and broader tech-sector sell-offs.
- Recent Market Turmoil: On March 10, 2025, HOOD dropped 18% alongside crypto-linked stocks like Coinbase due to Bitcoin’s price volatility and fears of inflationary tariffs under new U.S. policies.
- Retail Investor Pullback: Reduced discretionary investing and crypto crashes (e.g., Bitcoin’s 71% plunge in 2022) dampened trading activity.
NOT AN INVESTMENT ADVISE

USD/CAD Triangle Pattern (24.03.2025)The USD/CAD pair on the M30 timeframe presents a Potential Buying Opportunity due to a recent Formation of a Triangle Pattern. This suggests a shift in momentum towards the upside and a higher likelihood of further advances in the coming hours.
Possible Long Trade:
Entry: Consider Entering A Long Position around Trendline Of The Pattern.
Target Levels:
1st Resistance – 1.4403
2nd Resistance – 1.4435
🎁 Please hit the like button and
🎁 Leave a comment to support for My Post !
Your likes and comments are incredibly motivating and will encourage me to share more analysis with you.
Best Regards, KABHI_TA_TRADING
Thank you.

CAD/JPY Triangle (BoJ Interest Rate- Today) 19.03.2025The CAD/JPY pair on the M30 timeframe presents a Potential Buying Opportunity due to a recent Formation of a Triangle Pattern. This suggests a shift in momentum towards the upside and a higher likelihood of further advances in the coming hours.
Possible Long Trade:
Entry: Consider Entering A Long Position around Trendline Of The Pattern.
Target Levels:
1st Resistance – 105.50
2nd Resistance – 106.06
🎁 Please hit the like button and
🎁 Leave a comment to support for My Post !
Your likes and comments are incredibly motivating and will encourage me to share more analysis with you.
Best Regards, KABHI_TA_TRADING
Thank you.
