GBPUSD, Double Top price actionGBPUSD is correctively moving to a double top range which we could potentially see a short opportunity to the bottom of the larger correction.
Wait to see if we get a reversal and bearish confirmation.
Thanks
Trade Safe
**If you found this idea helpful in anyway, hit the LIKE button and FOLLOW me for more analysis and educational ideas**
Leave a comment and share your opinion on this view.
I appreciate all the feedback.
Beyondtechnicalanalysis

NZDCAD, Pullback to an area of value, look for sell entries Price action has pulled back an area of which we saw a strong impulse breaking downward from a strong structure level. Price has now retraced back to this area which we could see a nice sell opportunity.
Wait for bearish price action and find an entry thst meets your trading plan.
Thanks
Trade Safe
**If you found this idea helpful in any way, hit the LIKE button and FOLLOW me for more analysis and educational ideas**
Share your view by leaving a comment below.
I appreciate all the feedback.

Gold Time analysis for Revers Timezone !Hello traders this is an analysis for GOLD based on the time analysis that shows us the possible pivots Dates for Gold . In these days it is expected that we see a Revers in Price of Gold( It is normal to have a Reverse Daily Candle for 1 day sooner or later than the exact shown Dates ) .You can see the previous timezone analysis but to use that you should open the other Gold chart and read the Dates of Days in analysis and have fun !
*Sometimes Maybe It won't happen a Reverse point in specified days but maybe we see a Pivot point (something like Drops in Supply and Demand Methods ! )

what happens if we stay near the bottom of this range?quite simply its very bearish. if semiconductors dont immediately rally over this pivot they wont come back this week. if they dont come back this week the whole market is headed down for now.

short vix futures cboe showing spx long stressi think this regression strategy is showing the price of short cboe vix is crashing back into the channel, and fractal chaos is confirming the health of a downtrend, meaning coming up on the speech with which the uptrend es1! is predicted to stop through to the end of march and causing additional shorts on equities in the underlying index, and further bearish action in the futures meaning higher vix or uvxy and a decline in short vix and svxy. maybe the market has one last pop wed before continuing lower, maybe it breaks the trend and we see chaos flatline with the short vix popping back over the regression, maybe we continue immediately down, ut if im going to hope for bulls is spx im curious to first see short vix pick up over the midline and go for the top of the range, and opposite for the bearish picture either in continuation or rejection from some level.
short short on long spx vol bearish us equities

🧊The Iceberg Illusion In TradingThe iceberg illusion in trading refers to the perception gap between what people think trading is and what it actually means. Many people see trading as a simple way to make quick profits and accumulate wealth, with the idea that all one has to do is buy low and sell high. However, the reality is far more complex. Under the surface of what appears to be a straightforward process lies a world of risk, stress, and uncertainty. Trading is not just about making money, it requires discipline, patience, and a deep understanding of the markets. Those who don't understand the true nature of trading may face financial loss, depression and failure, much like the hidden dangers beneath the surface of an iceberg. Success in trading often requires much more than just a basic understanding of market trends and patterns, and those who dive in without being fully prepared may face dire consequences.
🔷 Above the Iceberg
Above the iceberg, people often see the glamorous and attractive side of trading, characterized by success, wealth, and financial independence. They imagine traders as confident and knowledgeable individuals, making smart decisions and reaping the rewards of their investments. The image of traders making large profits in a short amount of time is one that is often perpetuated by media and popular culture. People often see the stock market as a fast-paced, exciting place where opportunities for financial gain are abundant, and the idea of being able to control one's financial future through trading is alluring. This perception of trading often creates a rosy and idealized image of what it entails, leading many to believe that success in the markets is easy to achieve.
🔶 Bellow the Iceberg
Below the iceberg, lies the reality of the challenges and difficulties that traders face on a daily basis. There are many hidden risks and uncertainties that are not immediately apparent to those who are new to the world of trading. Some of the things that people don't know that lie beneath the surface of the iceberg include:
🔸 Market volatility:
The stock market is a highly volatile environment, and prices can fluctuate rapidly and unpredictably. This can make it difficult for traders to manage their positions and minimize their losses.
🔸 Emotional stress:
Trading can be a highly emotional experience, and the pressure to make the right decisions can be immense. Many traders struggle with anxiety, fear, and depression, particularly when faced with losing trades.
🔸 Lack of understanding:
The stock market is complex, and it can be difficult for traders to understand all of the factors that influence market trends and prices. This can lead to costly mistakes and an increased risk of financial loss.
🔸 Competition:
The stock market is a highly competitive environment, and traders must be able to keep up with fast-moving markets and make quick decisions based on complex data and information.
🔸 Long-term success:
Many traders are focused on short-term profits and may not consider the long-term impact of their trading decisions. Achieving lasting success in the markets requires a well-thought-out strategy and a strong understanding of the markets and the risks involved.
🔸 Timing:
Successful trading often requires precise timing, as markets can change rapidly and prices can fluctuate. Traders must have a deep understanding of market trends and be able to make quick decisions to take advantage of opportunities.
🔸 Risk management:
Trading involves risk, and traders must be able to manage their positions and minimize their losses. This requires a well-planned and executed risk management strategy, including setting stop-losses and taking profits at appropriate levels.
🔸 Knowledge and experience:
Trading is not just about buying low and selling high. It requires a deep understanding of market trends, economics, and financial analysis, as well as years of experience to develop a successful trading strategy.
🔸 Discipline:
Trading requires discipline and patience, as well as the ability to stick to a well-thought-out strategy. Many traders make impulsive decisions based on emotions or market rumors, which can lead to financial losses.
Welcome to the hardest game in the world.
👤 @AlgoBuddy
📅 Daily Ideas about market update, psychology & indicators
❤️ If you appreciate our work, please like, comment and follow ❤️

EURJPY 4HHey traders, in today's trading session I'm are monitoring EURJPY for a buying opportunity around 139.109 zone, once I will receive any bullish confirmation the trade will be executed.

GOLD 2HHey traders, in today's trading session i'm are monitoring XAUUSD for a selling opportunity around 1870.770 zone, once I will receive any bearish confirmation the trade will be executed.

The Bigest chanel for dgoecoin!hi friends this is my idea about dogecoin..
i think its again on the dynamic support..
my idea is long ..

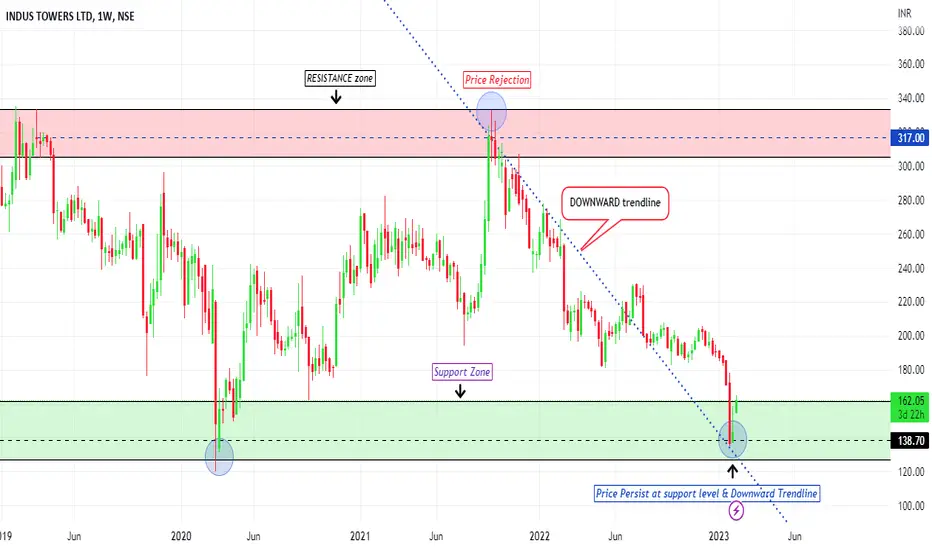
#Bullish Momentum View.#INDUSTOWER Persisting near support zone and at downward trendline @138--140. If price holds this level & sustained above this level than We can see a good buying opportunity to buy near support level.
🧠 The Mind Of A Smart TraderTrading psychology is influenced by emotions like greed and fear, which can drive irrational behavior in markets. Greed causes excessive risk-taking and speculation, while fear causes traders to exit positions prematurely or avoid risk. Regret can also cause traders to violate discipline and make trades at peak prices, leading to losses. These emotions can be particularly prominent in bull or bear markets and can have a significant impact on market outcomes. Trading psychology is a crucial factor in determining success in trading securities. It includes aspects of an individual's character and behavior that affect their trading decisions. Discipline and risk-taking are critical components of trading psychology, as is the impact of emotions like fear, greed, hope, and regret. It can be as important as knowledge, experience, and skill in determining trading success.
🧠10 Trading mindset tips:
🔹 Stay informed: Stay updated with the latest market news, trends, and developments, as well as your preferred assets.
🔹 Create a trading plan: This should include a clear set of rules for entry, exit, and risk management. Stick to your plan.
🔹 Manage your emotions: Avoid making impulsive decisions, especially during volatile market conditions. Keep a clear head and stick to your plan.
🔹 Continuously educate yourself: Enhance your knowledge and skills by reading books, attending seminars, and practicing with demo accounts.
🔹 Diversify your portfolio: Spread your risk across different assets and markets to reduce your exposure to any one particular market.
🔹 Stay disciplined: Follow your plan and stick to your rules, even if your emotions are telling you otherwise.
🔹 Set realistic expectations: Be mindful of your limitations and don’t overreach. Accept small losses and focus on long-term success.
🔹 Stay focused: Avoid distractions and keep your mind on your trading activities.
🔹 Keep a trading journal: Record your trades, track your progress, and reflect on what you could have done differently.
🔹 Take breaks: Avoid overtrading, which can lead to burnout. Take time to recharge and come back fresh.
👤 @AlgoBuddy
📅 Daily Ideas about market update, psychology & indicators
❤️ If you appreciate our work, please like, comment and follow ❤️

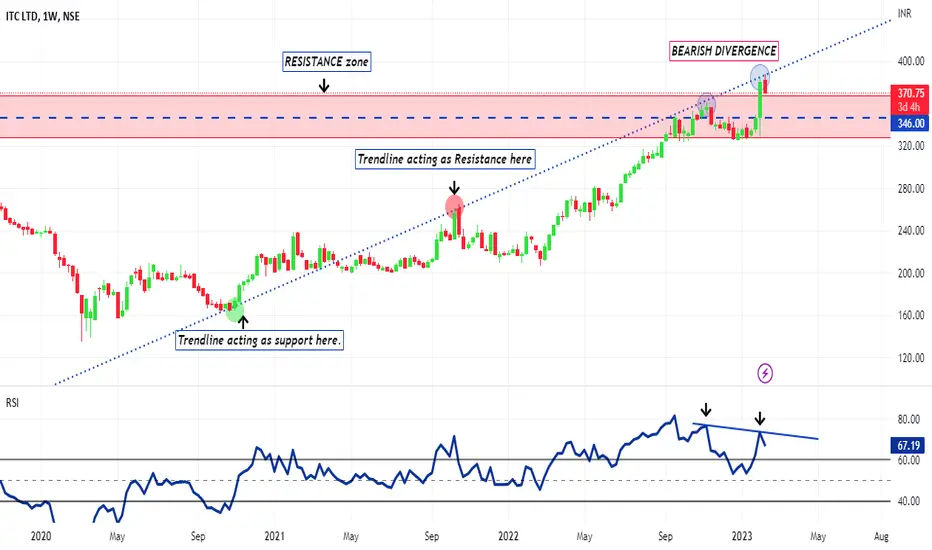
#ITC Bearish Divergence.#ITC Weekly chart showing BEARISH DIVERGENCE beween it's PRICE & RSI. Upward tredline firstly acting as support for the price & now acting as resistsnce for the price. If price holds itself below the resistance of trendline than peice can come toward downside in coming days.
US30 1HHey traders, in today's trading session i'm are monitoring US30 for a buying opportunity around 33808 zone, once I will receive any bullish confirmation the trade will be executed.

short vol coming off near outside upweve gained in the market, shed short volume on vix, shed weight on short vix, and lost slightly in svxy. if you study the long term picture svxy is near breakout. 69.69 and 79.79 roughly are levels to beat before were really in the green to clear $100 as the market rebounds. ive drawn a path that can hopefully outline what the topping out proccess could look like as uvxy heads for 1:10 reverse split. normally we revisit the fib bands when price comes off overbought, but im still bullish while were above mon-wed lows targeting 66.66

BTCUSDT Short!Dear guys, I am shorting from 23.6k
hopefully 22.8k is my target or even more
what about you guys?
Don' trade blindly!
Thanks!
Cheers!

S&P 500 MONTHLY TRADE Hi all
After falling from 4818.62 and reaching 50% retracement, the S&P is currently in a downtrend. There are still three weeks left to determine if the market will turn south or north, as long as 4146.88 holds. S&P could return to 3491 or 3818.
My trading strategy isn't intended to be used as a signal service. It's a process of gaining knowledge of market structure and improving my trading abilities.
Like and subscribe and happy trading to all

NZDUSD 1HHey traders, in today's trading session i'm are monitoring NZDUSD for a buying opportunity around 0.64566 zone, once I will receive any bullish confirmation the trade will be executed.

im not the first to say itif were going to hang out here below 20 and play with the idea of a recovery we run the serious risk of entertaining the inevitability of a second major wave in this corona island top/bear triangle. the new regime in volatility is either demanding we crush it, or we let it rip. we cant coil up like this forever. it might be super confusing, but ive laid out contingencies basically orbiting the general area targeting a breakout. i hope its not too dumbed down.
could uvxy for example relive recent exploits, or is it headed for 1:10 unit deletion ($50?) and then back to $5 (-90%?). this is the definition of an inflection point. all i know is theres a lot of units out there... they better start looking under rocks, in streams, up trees and in peoples underpants.

Dollar chart beyond of any walls.To print, or to not print?
That's the question to resolve, if you want to succeed in different markets.
Many investors & traders focus onto indicators, bands or some chart structures like Harmonic patterns, economy overviews, data and personal opinions.
Everything what would help is useful. Especially at shorter time frames.
When I am looking from my view after decade, I see how markets are more/like about the Dollar, world reserve currency.
This is shaping SP500, Technology stocks, precious metals and also Crypto currencies, with usually limited supplies ( that better ones ).
They told about CBDC and crash of money. I agree, it will come quite soon.
To me in my mind, they will make some changes in digital behind that nobody will notice and that is reason USD will here.
You can monitor MACD, RSI or some others. However, It will gives you just an overview about the state of markets and can trick you into bull/bear traps or bad decisions from other people ideas.
Game of coincidence probably started yet. Yourtubes told you " there is magical support, which will hold forever.
Maybe you noticed even multiple times, how indicators are all to late and often in conflict in any major trend. Can stay overbought/oversold for long time and so on...
I can also confirm markets are often behaves irrationally.
Currency should also be pronounced like " Current sea".
So more you will speculate and look into fundamentals/events, probably more money will be spent on leverage, transactions and fees, which only dives yourself deeper into this local sea,
when only few will see some fair results of success ; )
So well, here I made my simple chart with targets to the future.
I know, it won't end up perfect and I even do not expect it to be 100%.
To be fair, I never tried to give any signals or disappoint people.
Always with care and ready,
Emvo.
*This is not any financial advice.

Bull flag on BTC?Hello.
Possible bull flag forming on Bitcoin . Target around 24k .
First resitance is around 22400-22800 (13th of september high) .
I think 25k there will be more selling/profit taking if we even get there.
You can see from the chart how 10EMA (blue one) has worked as support 3 times before when Bitcoin started its rise (marked with red arrows) .
I believe it will work as a support until the price shows that it doesn't and breaks it (and stays below) .
Possible risk reward is pretty good, almost 5 ratio .
This is not financial advice.
If you do take trades always use stop loss!
First mistake novice trades do is not use them and gets their ass burned!
Check out my analysis on 12th of january "why I think Bitcoin has bottomed"
-Jebu

I think Bitcoin's bottom is inHello.
We can see RSI has broken its ~1 year downtrending trendline from feb 2021 on 3D ( also on daily and weekly ). Tells about possible trend change .
Double top from 69k and head and shoulders targets hasn't been able to met. ( Not enough sellers? )
Price was pressured down with 25EMA (yellow line highlighted with red arrows), and has broke it now.
18 500 is a strong resistance. If Bitcoin breaks 18 500 and stay on top of it, for me this FTX panic drop was to shake people out and trick them to wait for "lower prices"
Market sentiment has been really negative for a long time and people have been waiting for 14, 12 and 10k so we probably won't even get there.
Also there has been many news again how crypto is dead etc etc

MARKET BOTTOM PREDICTION!!! DXY & ES1! (MACRO ANALYSIS)DESCRIPTION: In the chart above I have provided a MACRO ANALYSIS of DXY. And what should only be taken as SPECULATION & as a POSSIBILITY since patterns tend to repeat themselves. The chart above includes an overlap of DXY & ES1! in an effort to observe their inverse & parallel relationship.
POINTS:
1. DXY shows a COMMON DEVIATION of 10 POINTS justifying the placement for SUPPLY & DEMAND POCKETS.
2. A VERTICAL YELLOW LINE is indicative of a MARKET PEAK.
3. A VERTICAL GREEN LINE was placed after a VERTICAL YELLOW LINE to signify when MARKET BOTTOMED.
*IMPORTANT:Between every MARKET TOP & every MARKET BOTTOM DXY FLUCTUATES a total of 20 POINTS BEFORE THE MARKET
5. PAY CLOSE ATTENTION to the recession of 2007 - 2009. After DXY saw its first 20 POINT FLUCTUATION DXY hit 80 and bounced back to 90 POINTS.
6. Moving onto RSI we can see that DXY COMMITS to its RSI TREND throughout a RECESSION which does in fact lead me to believe that current RSI levels for DXY will follow a Down Trend similar to what was seen from 2000 to 2003.
SCENARIO:
- With all this in mind we can speculate that DXY will CAPITULATE to 95 POINTS before seeing a bounce allowing current UPTREND CHANNEL for DXY to find some CONSOLIDATION. This will also allow RSI too COMPLETE a DOWNTREND SIMULTANEOUSLY.
*PREDICTION: If DXY is to fall to 95 POINTS that would be the equivalent of ES1! falling too 3,600 OR SPY to 360*
TVC:DXY
CME_MINI:ES1!
AMEX:SPY

Setups for MondayOrange pairs: AUDNZD, AUDCHF, NZDCHF, GBPCAD, EURAUD, GBPNZD, NZDCAD, EURNZD, EURCAD
Green pairs: USDCHF and GBPCHF
Purple pairs: AUDCAD and EURGBP
*
Orange = Moving away or getting slowly to our trade, not suitable for a trade yet unless it's giving a little bit more in our direction
Green = Close to a trade, needs a break for anything serious
Purple = Very close to a trade! Needs a retest or a break of exhaustion point for an entry.
Have a great week all! :)
