Gold and Nasdaq TradeAggressive trading but manage to change my trade after seeing that I was right on the Bias initially. In the end sell short
Bias

Soooooooo... CONTINUATION?! Or nah...I think everythings gonna keep moving the same way! I mean, AJ might've roc'd me a bit but that 200pip move on gold was saucy! EU did me som justice too. They also BLEW TF UP AGAIN! But, its not about trading all the time, its about trading well often ;)
So with that being said, make it do what it do my trading family!! Happy trading <3

OVERALL PROJECTION FOR THE 1ST FULL WEEK OF JUNE!!!!!!!!!!!!!!!!Overall bullish on dollar!
Bearish on all other pairs!!
Looking to get a slight pullback/retest, then continuation!!!
YEAH SMALL TAKE INTO THE WEEK, LETS SEE WHAT WE GET! GANG. HAPPY TRADING.
** IN NO WAY, SHAPE, OR FORM AM I TELLING YOU TO TAKE THESE TRADES!! THIS IS SIMPLY SOME MARK UPS I WANTED TO POST SO KISS MY TRADING ASS AND DO YOUR DUE DILIGENCE!! THANK YOU**
FOLLOW MY YOUTUBE CHANNEL 'DIVINITY UNLEASHED' ILL BE RELEASING NEW CONTENT AT THE END OF THIS WEEK ABOUT MY CURRENT JOURNEY AND WHAT IM WORKING TOWARDS WITH FOREX!!!
MUSIC BY ME! ALL PLATFORMS!

DXY D1 - Long expectation.DXY D1
Whilst we have a bullish sequence here on the D1, the H4 looks to be showing a bearish breakout. As we always say, higher TF takes precedence. Not only this, we have fundamentals and risk sentiment backing USD bid.
I'd like to see DXY get off the ground a little more before jumping into these USD*** longs or ***USD shorts.


End to daily bearish trend and strong momentum.Last week the bulls were in action for the most part of the week. And the after hitting some area of resistance the bears stepped in and gained resistance. Last week lows were broken as part of this support turned resistance which gave away some movement to the market downside. Several lower lows were made during this week and they held tightly as resistance. Steadily pushing the market to the bottom on the 1hour was strong bearish. The Fibonacci is saying their is and area at the 25% that is holding at support which in turn makes it possible for the bulls to return. We wait for a new higher lows to form now.

Waiting for some action on USDCHFI'm still waiting to see signals of an executable trade, I still have the same bias for the pair and am waiting for price to possibly test yesterday's low.
Should price test the area and provide some the signal I'll be going long. This falls into the cycle I see on a long term perspective (yearly).

BTC BIAS + my thoughts explainedBTC has been trending since 15th of May
We obviously don't want to go against the trend
but what I can see is that we have pretty
much been consolidating since the 27th of march
We also raided the FVG and previous highs really hard
I wanna see if we break out above the consolidation first
then come to take sellside liquidity
We still havent broken the trend but it looks like it
has already build plenty of sellside liquidity to take btc to
AT LEAST 45K to then push up.
Like I said I'm eyeing the 45-43K zone before another buy.
Support zone is literally around 45k + OB right below it so
it looks golden

Short term price rally up into areas of interest. GBP/USDSo at the start of the week we formed a gap, and now price has covered the gap. We saw some hard selling off towards the end of last week, where very little buying was done. This means there is an imbalance of price. This does not mean that price will run to close this unbalanced price action, rather it only serves as a pointer to the overall underlying bearish tone. Ideally, I'd hope to see price take out those equal lows formed today, then go up into these areas of selling. This, I believe, would lead to the formation of a premium in a higher timeframe, which would lead to a selloff.

Which day of the month to buy ETH at DCA? Our Quant Answer!In this idea we want to show our operation as a long term trader - further definition for the term "Investors" - in which we select - doing also fundamental analysis - assets with long term bullish Bias.
In some of our portfolios we have ETH, which we buy every month in Dollar Cost Averaging ( DCA ).
As Quant Traders and Investors, we have developed the Bias Analyzer to help us decide the day of the month when we can get a statistically advantageous price.
We notice that between the 10 -11 and between the 21-22 the price of ETH tends to fall and therefore in those days, we can buy at market whenever we want, considering that the day is calculated at midnight UTC .
Also we can combine the BIAS information by looking at the graph where is presented:
- Fibonacci levels or Hosoda's 50% to find a good point: 0.382, 0.500, 0.618, 0.786
- Support and Resistances provided by Ichimoku /Chikou
If you would like to automatize or remind, feel free to use our Open-Source DCA Bot Indicator
How do you guys calculate your DCA entries?

Which day of the month to buy ATOM at DCA? Our Quant Answer!In this idea we want to show our operation as a long term trader - further definition for the term "Investors" - in which we select - doing also fundamental analysis - assets with long term bullish Bias.
In some of our portfolios we have ATOM, which we buy every month in Dollar Cost Averaging ( DCA ).
As Quant Traders and Investors, we have developed the Bias Analyzer to help us decide the day of the month when we can get a statistically advantageous price.
We notice that between the 17 and 21 the price of ATOM tends to fall and therefore in those days, we can buy at market whenever we want, considering that the day is calculated at midnight UTC .
Also we can combine the BIAS information by looking at the graph where is presented:
- Fibonacci levels or Hosoda's 50% to find a good point: 0.382, 0.500, 0.618, 0.786
- Support and Resistances provided by Ichimoku /Chikou
If you would like to automatize or remind, feel free to use our Open-Source DCA Bot Indicator
How do you guys calculate your DCA entries?

Which day of the month to buy ADA at DCA? Our Quant Answer!In this idea we want to show our operation as a long term trader - further definition for the term "Investors" - in which we select - doing also fundamental analysis - assets with long term bullish Bias.
In some of our portfolios we have ADA, which we buy every month in Dollar Cost Averaging ( DCA ).
As Quant Traders and Investors, we have developed the Bias Analyzer to help us decide the day of the month when we can get a statistically advantageous price.
We notice that between the 10 and 12 the price of ADA tends to fall and therefore today, we can buy at market whenever we want, considering that the day is calculated at midnight UTC .
Also we can combine the BIAS information by looking at the graph where is presented:
- Fibonacci levels or Hosoda's 50% to find a good point: 0.382, 0.500, 0.618, 0.786
- Support and Resistances provided by Ichimoku /Chikou
If you would like to automatize or remind, feel free to use our Open-Source DCA Bot Indicator
How do you guys calculate your DCA entries?

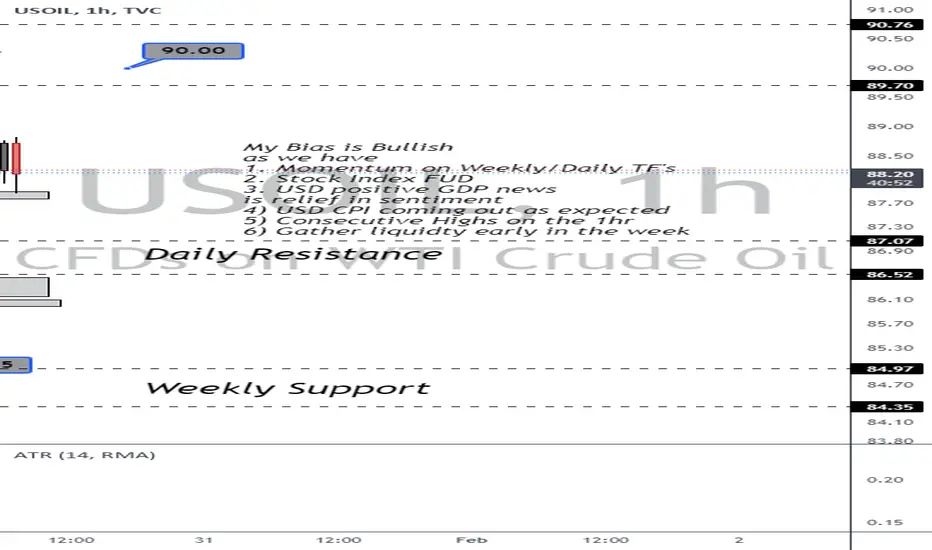
USDCAD Bias, Crude Bullish to 90$ this weekAs Crude propells itself upwards to the moon like a CryptoCurrency, Thanks to the Fed,
I liken USDCAD to continue to depreciate. Looking for price points 1.26250 in the coming
few trading sessions. keep in mind we do have a lot of News this week.
It is NFP Week, good Idea to take profits and go enjoy your day.
We reached 1.267 as anticpated in the previous USDCAD post.

DXY 1Hr Analysis, London Close Friday 1/28/22Wow, what a move this week by USD
Expecting us to come back for liquidity to
96.95. It is possible this Dollar trend may just keep going
but usually the weekly candle crossover provides some bout of
liquidity

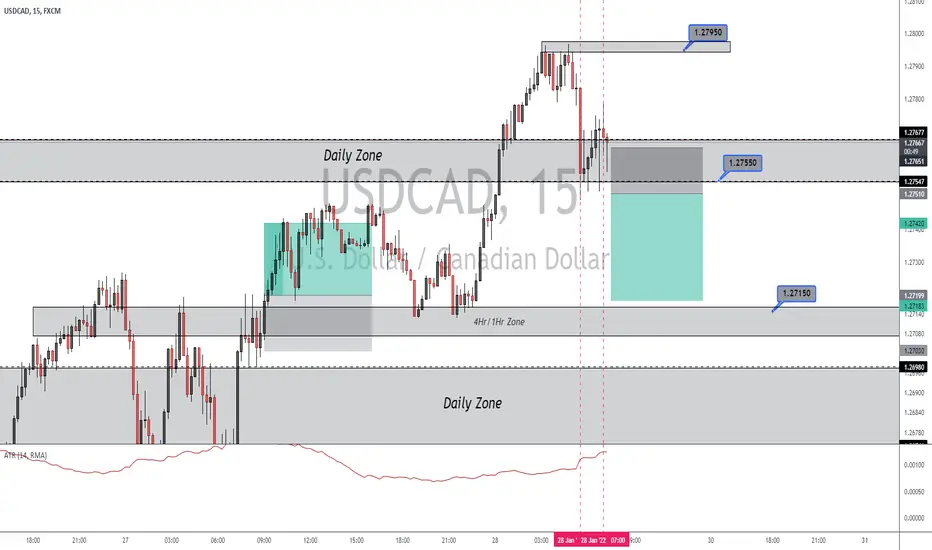
USDCAD Bearish Bias to 1.267 price point on the 4HR ChartLooking for USDCAD to respect 127.5 Price Point on the Daily
Anticpating a pullback to 1.26700 on the 4hr
Really good risk to reward short during High volume
time (London Session Close) We''ll see what happens
This is a day trade, don't plan on holding it into asian
unless we are in a fair amount of profit

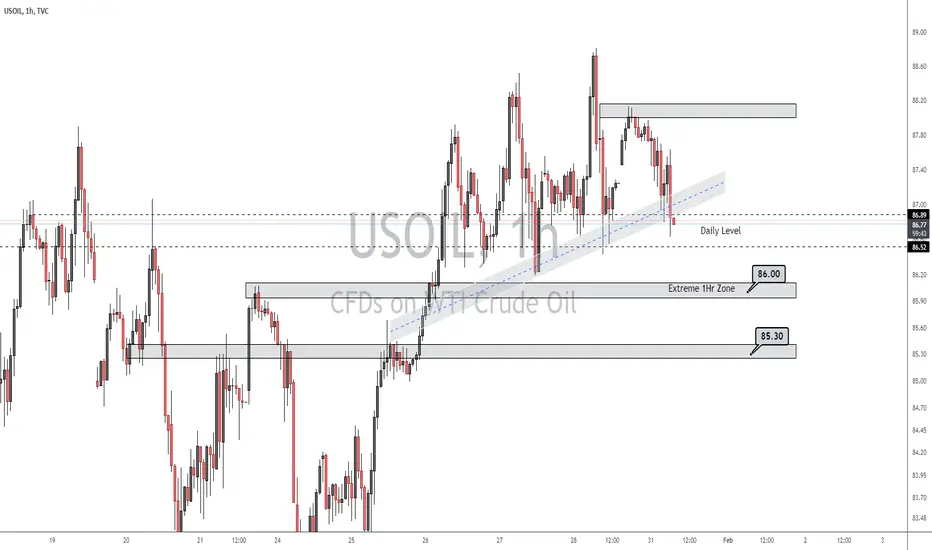
USOIL 1Hr Medium Term AnalysisI'm bearish on crude as we begin the week, in the medium term. We have been quite bullish on this
commodity. However it looks like we may correct to 86 and/or 85.30$ price point before
continuing our Bullish Ascent to 90$
EURUSD Sell Setup Idea, Trading with Higher Time Frame TrendHere we have a sell setup Idea, Selling at a 1Hr Zone Pullback
The Risk to Reward is worth it when trading with the trend.
Momentum is Bearish on the HTF's
We have a clean range to fill on the daily/weekly Timeframes down to 1.10
The USD Dollar is in Momentum
Stock Index fear has stabilized, but still has the market thinking twice. I believe I am correct
but I am okay witht he market proving me wrong
and will not fight the market if we decide to pullback hard bullish early in the week

GJ Bearish Bias, Daily Rejection, Looking for 153.5 on HTF'sWe have the first london session of the week go bullish
but nd up pulling back hard, back below 155 Psychological level on HTF's
I'm looking bearish, we have bearish market structure on this intraday chart
Anticpating USD strength as well, JPY being a safe haven, I expect them to move in unison

//EURUSD Final 4 Sessions of the Week, Avg RR 5.11:1, +7.33R //
Hello All, This ^^ is my Technical breakdown of Eurusd on the 3m Chart
I detail the Final 4 Trading Sessions of the Week and how I earned
+7.33R.
During this time period we had 2 USD Red Folder News Releases.
I review our last release of the week, USD CPI and How I used it
to get the price I wanted and earn +2R (2 Times my Risk)
If you have read this Far , I appreciate it.
We have quite a bit of news during the next week. Jan 31-Feb 4
Cheers to a good trading week and Safe Trading

USDCAD Day Trade Idea // 15m TimeframeWe have Rejection from Daily Resistance that began during NY Open
This could just be liquidty for another Leg up in Trend Bullish.
However, I like Dollar weakness to finsh off the week.
This is a sell stop, SL about 14 Pips, same as 15m ATR
Bitcoin 4Hr Chart AnalysisIt Appears we are rejecting our Weekly Support
Level at 33,500
We can see a Range forming above the Lows which
Is a good sign for the Bulls
Holding 35K Psychological Price point. We have a few
scnearios that can play out.
1 We go Retest the Lows , which is where most Long term
and positions traders are looking, which I think is most likely.
2 We continue to Range on the 4Hr
3. Buyers step in on the Weekly and drive Price back up to 39,200 Price point

USOIL 1Hr Chart Friday NY Session, 88.20$Consecutive HH's on the 1Hr
Fakeout for liquidity back down to 86.75 yesterday duirng NY Session
to grab orders. Shouted out buys if your Bias is Bullish on crude in the "update section "
yesterday from 86.75
Intraday ATR increasing as we move into London Close, could see another leg here.
Or we reject to gather more liquidty for Sunday/Monday next week.
Anything can happen, always have a stop and a good Risk Reward
GJ Short Idea , NY Session Friday 4:1 RRAnticpating the weekly candle to pullback to 154
Fakeout during NYSE to gather liquidity
Tight 11 Pip SL on GBPJPY
anticpating London Close volkume to take us bearish
We got a solid bearish 1hr candle close at 154.5
