GBPJPY 4Hr Analysis, week 4 2022 We may come up to 155 on the Daily
We may Respect 154.500 Since we just closed below that
price point during the Pre-NY 4hr Candle.
I don't like it a whole lot, Staying out for the Time being
I had just taken a 5:1 RR position that got stopped out,
Trading in Line with my bias, Bearish , Due to the Daily/Weekly TF's
I'm still looking for a retest of lows, at 153.8 and 153.5
Bias

BTC ShortShort, trading with the Bearish Moomentum
on the HTF's, We have rejection candles at our Daily S/R Zone
I believe the RR is worth it, trading with the trend

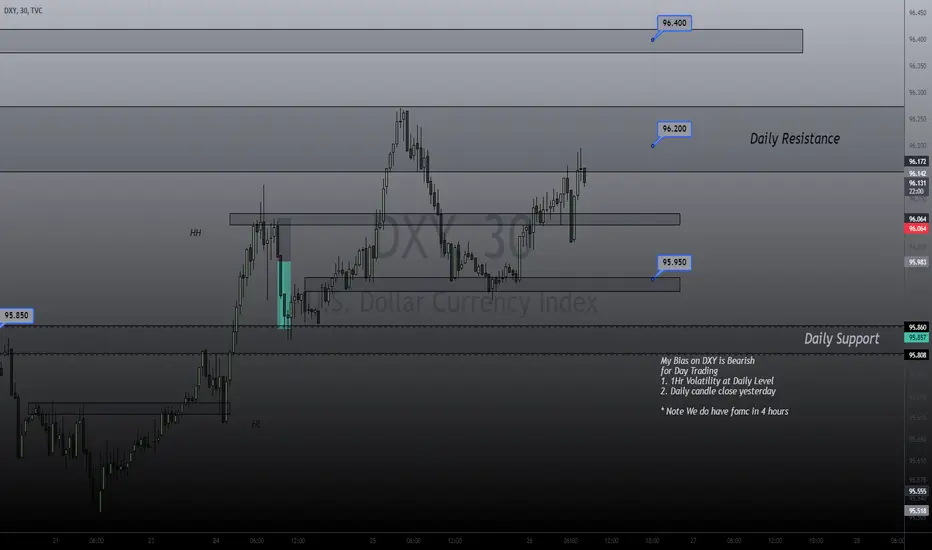
DXY Lower TF Rejection of Daily Resistance Level As we approach FOMC price is printing rejection candles off our daily zone.
This could all be liquidity for a move higher later during FOMC
Best to stay out of the market for the time being and possible scalp with your bias
if FOMC confirms your bias.
USDCAD 4Hr Analysis, Week 4 2022 Interest ratesBearish
based off past 2 sessions.
Also based off Weekly/Daily Market structure
I am bearish on this pair as we move into Interest Rates.
It appears we may have done a liquidty pullback as
the market prepares for the News.
If we go down i'm looking to scalp as we go down to 1.25250

EURUSD 4hr analysis2 Reasons why my bias has flipped on this pair with regard to day trading
Listed on chart
looking for
1.133 price point

US Oil 4Hr Analysis, Week 4 2022, Cad interest Rate DayWe are quite Bullish
The daily candle yesterday closed in a fashion
that validated longs to 90$ a barrel.
We are currently testing 4hr Resistance
It is most wise to wait for the Daily candle to close
or until asian session latter for any sells. For
buys, Fomc could be a catalyst for us to move out of
87$ and 88$ and continue on towards 90$ a barrel


EURUSD 4Hr Analysis, New York Session Jan-25Lots of bear momentum
Lots of fear in the Market
Price needs liquidity though to keep moving
We'll see what happens
We shall see how candles close at 1.128 Daily Zone on the 1Hr during NY and Asian Sessions
Rejection or close below. IF we pullback up, im looking for 1.13

DXY 2Hr Analysis, Jan 25 NY SessiomDaily Market Structure is Bullish
and Weekly
However Im looking for a pullback for liquidity in trend
If I am Wrong I will be quick to cut losses. Looking for the price point
96.50 as a target for any shorts

Which day of the month to buy LUNA at DCA? Our Quant Answer!In this idea we want to show our operation as a long term trader - further definition for the term "Investors" - in which we select - doing also fundamental analysis - assets with long term bullish Bias.
In some of our portfolios we have LUNA, which we buy every month in Dollar Cost Averaging (DCA).
As Quant Traders and Investors, we have developed the Bias Analyzer to help us decide the day of the month when we can get a statistically advantageous price.
We notice that between the 19 and 21 the price of LUNA tends to fall and therefore today, we can buy at market whenever we want, considering that the day is calculated at midnight UTC .
Also we can combine the BIAS information by looking at the graph where is presented:
- Fibonacci levels or Hosoda's 50% to find a good point: 0.382, 0.500, 0.618, 0.786
- Support and Resistances provided by Ichimoku/Chikou
If you would like to automatize or remind, feel free to use our Open-Source DCA Bot Indicator
How do you guys calculate your DCA entries?

Which day of the month to buy THETA at DCA? Our Quant Answer!In this idea we want to show our operation as a long term trader - further definition for the term "Investors" - in which we select - doing also fundamental analysis - assets with long term bullish Bias.
In some of our portfolios we have THETA, which we buy every month in Dollar Cost Averaging (DCA).
As Quant Traders and Investors, we have developed the Bias Analyzer to help us decide the day of the month when we can get a statistically advantageous price.
On the 21 and 27 the price of THETA tends to fall and therefore on these days, we can buy at market whenever we want, considering that the day is calculated at midnight UTC .
Also we can combine the BIAS information by looking at the graph where is presented:
- Fibonacci levels or Hosoda's 50% to find a good point: 0.382, 0.500, 0.618, 0.786
- Support and Resistances provided by Ichimoku/Chikou
If you would like to automatize or remind, feel free to use our Open-Source DCA Bot Indicator
How do you guys calculate your DCA entries?

BTCUSD : Not so fun times aheadThere's a ton of open float / liquidity collecting below equal lows of $28.7K - price is expected to reach there in a few weeks.
Below the liquidity grab, there are two open Fair value gaps which could support price.
Wait and watch.

Which day of the month to buy BTC at DCA?In this idea we want to show our operation as a long term trader - further definition for the term "Investors" - in which we select - doing also fundamental analysis - assets with long term bullish Bias.
In some of our portfolios we have BTC, which we buy every month in Dollar Cost Averaging (DCA).
As Quant Traders and Investors, we have developed the Bias Analyzer to help us decide the day of the month when we can get a statistically advantageous price.
We notice that between the 21st and 22nd the price of BTC tends to fall and therefore today, we can buy at market whenever we want, considering that the day of is calculated at midnight UTC.
Or we can combine the BIAS information by calculating Fibonacci levels or Hosoda's 50% to find a good point:
- 0.382
- 0.500
- 0.618
- 0.786
How do you guys calculate your DCA entries?

When to Change Bias in TradingHello Traders!
Do you ever wonder, "When is the trend ending?" or "When should I change my directional bias?"
Many traders find it hard to figure out not only how to choose a directional bias for the day, or how to change their bias if they are on the wrong side of the trade.
In this educational video tutorial, I provide simple confirmations to discern when to change your bias and how to look for your next entry!
Traders, we would love to hear your opinion and how you determine directional bias. Write in the comments and share with us!
Cheers,
- BKH

E-Mini S&P 500 December Contract2021.11.19 Analysis
Daily Chart
Daily Bullish Bias remains on break above market structure point B @4723.50. Since 2021.11.10 low point A @4625.25 price has not had a 50% retracement to qualify for a change in market structure. Therefore overall Daily Bias remains Bullish.
1 Hour Chart
7 hours after the break above daily market structure @4711.75, price has moved lower into the previous internal swing 70.7% @4684.25 or point a, and then back towards the high 70% @~ 4712.00 or point b. It would appear to be a possible start of a Bearish internal market structure.
Bearish Price Projection favors a break below point a @4684.25 and lower to pair up sell stops @ 4668.00 and lower into the 1LC @4665 as a minimum price target.
Bullish Price Projection would see a continuation to the upside and a break back above points b and B on the daily chart in line with the previous break in market structure @4711.75.

BTC Analysis1-What's BTC market bias as of now?
-Price has formed (or 90% formed) an ascending wedge (red lines), which indicates a down movement possiblity.
-Price is near monthly support (63K zone). If price breaks it, it will continue downward. If it bounces back, it will go to the wedge's upper limit (mentioned in a).
-Volume (yellow line at the bottom) is decreasing; less and less money has been used to buy BTC. This indicates a lack of interest in the market which drives people to avoid it or use as little amount of money as possible. Usually, this ends up with the price moving downward.
-The volume profile of the market shows that since the start of the year, large amount of money was poured in when the BTC price was around 31K-40K. The next wave of money poured in was around 45K-50K, and last one when the price was around 54K-60K. The amount of money used decreased respectively (shown in the left side of the chart as horizontal bars). Again, this has the same conclusion as the point above.
*Conclusion: market bias >>> Down movement.
2-Where would the price go to in that case?
-The regions mentioned above (31K-40K/45K-50K/54K-60K) act as support levels and the price will most likely move to one of them starting from the nearest (54K-60K) and bounce back up. If price doesn't bounce up, it will go to the region below it. In case the price falls below 31K-40K region, we can expect a market crash.

Nasdaq structure shift 2021-11-09Long or short? what do you think?
in the picture you see trend lines and fibbonacci retracement
and SMA 21 50 200
.
.
.
.
.
.
.
.
.
.
.
.
.
.
.
.
.
.

NZDCHF BULLISH CONTINUATION FROM KEY LEVELNZDCHF is very bullish from the beginning of October.
Setting a new high last week the price retraced to a key level.
Retesting key support the price started to grow.
Bulls managed to violate a falling wedge pattern, and duplicate the bullish breakout.
Expect new wave upward to the key resistance level.
The bias for the NZD remains firmly titled to the upside, and as rates keeps rising
Also note that the RBNZ delivered on expectations to raise the OCR to 0.50%. As the hike was already fully priced, the lack of new hawkish tones we saw a textbook buy-the-rumour-sell-the-fact reaction in the NZD pushing lower.
Risk Disclosure: Trading Foreign Exchange (Forex) and Contracts of Difference (CFD's) carries a high level of risk. By registering and signing up, any client affirms their understanding of their own personal accountability for all transactions performed within their account and recognizes the risks associated with trading on such markets and on such sites. Furthermore, one understands that the company carries zero influence over transactions, markets, and trading signals, therefore, cannot be held liable nor guarantee any profits or losses

XAUUSD ShortTime frame: 4H
Bias: Short
Symbol: XAUUSD
Analysis: There is a little hope of trending up. It has a clear downward direction . We will try to nail down the target entry and exit next week. Please wait for our posts at the start of next week.

#AUD USD# SCALED ENTRY 1:5 RRR SHORTSECOND scaled entry on AUD USD 1:5 RRR POSSIBLE move down side, thanks.

✅GOLD UPDATE|SHORT 🔥
✅GOLD is still trading below a resistance level
And we've see a bearish reaction from the area
Which proves our bearish bias on Gold
I still think that we will see a move down
To retest the support blow
And the likelihood of such a move increased
SHORT🔥
✅Like and subscribe to never miss a new idea!✅


