BIDU Baidu Fibonacci Retracement target: $195China-based tech giant may receive increased oversight from Chinese regulators, in addition to threats from the U.S. about potential delistings of foreign stocks.
The U.S. Securities and Exchange Commission (SEC) has threatened to kick foreign companies off of U.S. exchanges if they don't adhere to U.S. auditing practices. (fool.com)
Fib 0.618 perfect touch: $195
If you are interested to test some amazing BUY and SELL INDICATORS which give the signal at the beginning of the candle, not at the end of it, just leave me a message.
BIDU

BIDU - Perfect setup at Golden Pocket at 200 Day EMABIDU is looking good again. We can long again.
1. Golden Pocket at $177 - $180
2. FIB level support
3. 200 day EMA
4. oversold RSI
5. MACD under histogram on the daily

𝗔𝗥𝗞 𝗜𝗻𝗻𝗼𝘃𝗮𝘁𝗶𝗼𝗻 𝗨𝗽𝗱𝗮𝘁𝗲: $ARKK Daily. 200dmaLooks like a visit to the 200dma on the table again as mid-bolli has held as resistance
$TSLA $SQ $ROKU $TDOC $BIDU $SPOT $Z $SHOP $QQQ $SPY #ElliottWave #Stocks 📉

BIDU (NASDAQ) - Be Carefull
Greetings
Humbled, we would like to thanks for your support who has already liked, commented and followed us. Your support, strengthens us, to help in analyzing the market. If you have any questions, feel free to send us message (inbox).
Pra Trading :
- Please care for Money Management
- Have a good psychology
- Do not be hurry to open position and do not do nothing if u see opportunity
- Evaluate and upgrade your trading plan
Execution Strategy :
- Know what you want to buy, see the Fundamental
- Decide that you are on investing or speculating
- Consider what your strategy based on Investing/Speculating
- Make Road Map Of Your Trading Plan
- Decide
a. Entry strategy
b. Cut loss
c. Target of Profit
Post Trading :
a. Do not be sad if you loss or do not be very happy if you win
b. Just become a normal without emotion, Do not put emotion into your trading
c. Evaluate your trading
d. Keep on Learning
e. Be Humble
Idea :
BIDU - Be Carefull
Note :
1. This is just a road map
2. After u know the rod map, u need to decide what is the entry strategy, and exit strategy where we do not explain here. if u will know more, let send us message
3. If your information/knowledge is intermediate, it is very dangerous to do trade.

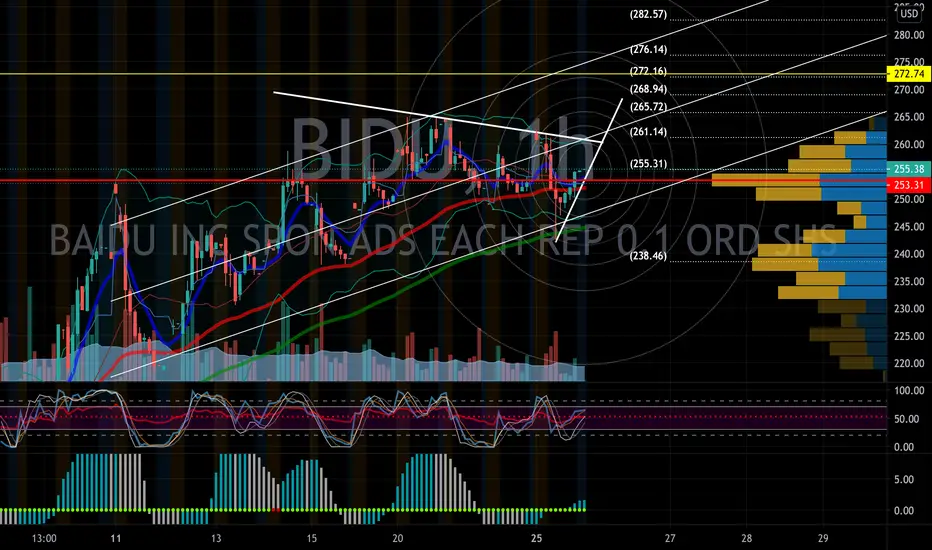
Long | BIDU | 3/19/2021NASDAQ:BIDU
Possible Scenario: LONG
Evidence: Price Action
TP1 ~ 275$,
This is my idea and could be wrong 100%,
Option Calls for 19 March, 275$

Cup and handle pattern on BIDUWe know the market in general terms. It's in an "overbought" situation. However, our job here is to analyze any chart and make conclusions based on what we see.
What can we see here?
-The price made a new ATH after breaking the major resistance zone.
-After that, we can see a Flag pattern on the Edge of the Major resistance zone.
-From a technical perspective, this can be considered a Cup and Handle Pattern.
The lines you can see on the chart are:
Greenline: Activation level, there we will open our setup
Redline: Invalidation level, there we will ser our stop loss, or we will cancel our setup if the price reaches it without executing our trade.
Fibo extensions: The first one is our Break-Even level, and the 2nd one is our final target
Remember: This is another setup, which means that you should be open to a stop loss or a profit. When you are trading chart patterns, you are creating an edge over 100 setups. The most likely scenario is that you can have 35 Take Profits, 40 stop losses, and 25 Break-Evens. With an average risk-reward ratio of 1.8, you are profitable. That's how a real strategy behaves.
Thanks for reading!

Random Walk Index Indicator (RWI)This is a perfect indicator to determine the trend direction!
💲💲💲💲💲💲💲💲💲💲💲💲💲💲💲💲💲💲💲💲💲💲💲💲💲💲💲💲💲💲💲💲
✅ Uptrend strategy:
When RWI high (purple in this video) is above the RWI low then the trend is up.
Combine this indicator with the Fisher Transform indicator, then open long positions as per the Fisher Transform when the trend is up.
✅ Downtrend strategy:
When RWI high (purple in this video) is below the RWI low then the trend is down.
Combine this indicator with the Fisher Transform indicator, then open short positions as per the Fisher Transform when the trend is down.
Uptrend strategy:
When RWI high (purple in this video) is above the RWI low then the trend is up.
Combine this indicator with the Fisher Transform indicator, then open long positions as per the Fisher Transform when the trend is up.
Downtrend strategy:
When RWI high (purple in this video) is below the RWI low then the trend is down.
Combine this indicator with the Fisher Transform indicator, then open short positions as per the Fisher Transform when the trend is down.

𝗔𝗥𝗞 𝗜𝗻𝗻𝗼𝘃𝗮𝘁𝗶𝗼𝗻 𝗨𝗽𝗱𝗮𝘁𝗲: $ARKK Daily. C WaveLooks like a flush scenario to 200dma is increasingly likely. Below last week's low where Cathie stepped in
$TSLA $SQ $ROKU $TDOC $BIDU $SPOT $Z $SHOP $QQQ $SPY #ElliottWave #Stocks 📉

$BIDU Nearing Daily Support! Reversal Coming?Video Breakdown on $BIDU! Currently in a Descending wedge heading towards our daily support!


Bullish on BIDU going into earningsEarnings are still 23 days however since we are in still in bullish momentum from the big up move last Thursday. I expect tomorrow to test and then break last Thursday's high.


$BIDU 15min EV PLAY Currently in a weekly BIDU call following the flows and the technicals. Entered 310C 2/19. Its been taking the stairs up.

BIDU - Diamond Performance Dashboardlooking for a demand zone around 222. Scouting for electric car development/partnership news.

$BIDU 1h Still climbingAccording to the stock bot the next resistance is 172.74. Insane upside if Chineses stocks can finally rally this week.

Bidu - making the turn - Diamond Performance Cube.786 support as we move around the cube. Time for a new model.

BIDU is going much higher stock split is coming pump timeOTM BIDU calls have been printing every single week on the EV hype. You might be afraid to buy in after a monster run out of its long bear trend. Don't be afraid because it is going much higher. A birdie told me that a stock split will be announced very soon. Don't sell calls options or you will lose your shares. Buy in heavy and let it run to $380. The split is intended to keep the price low and attractive as it gets ready for secondary exchange listing in HK.


