SBI CARDS - undervalued?SBI CARDS is currently at it's lowest ever P/E. It is trading at 28.5 P/E while its lifetime median P/E is 54.4. It is constantly posting good revenue and profit which makes it a very highly undervalued company at its present price and P/E. It can be considered a good buy for both short and long term.
Trade can also be taken on the basis on range bound trading strategy with range being 686 to 926 and it can give approximately 30% return from present levels. The target will be achieved within 150 days at max.
Hope you like my analysis.
Please do your own analysis before investing.
Do like and follow.
Thank you
Billionaire

Buy Tanla Platforms Ltd.Tanla Platforms Ltd which may had been a multi-bagger stock for many is currently 62% down from it's lifetime high and hasn't given returns from past few years despite strong balance sheet and profits. At a time when the whole market is up such precious gems which were talk of the town during pandemic period are currently undervalued and available at dirt cheap price.
It provides us with great investment opportunities even at expensive markets.
Hope you like my analysis.
Please do your own analysis before investing.
Do like and follow and share among your friends and family.
Thank you.

Buy Lux Industries 40% returnLux Industries chart if back-tested shows that it has traded in a range between two price points 1123 and 1559. The range is around 40% wide and today the stock has touched the bottom of the range. After touching this price it has touched 1559 in a short period of time in the past for a total 4 times. The years in which the range was covered are 2017, 2019,2020 and the latest being 2023 itself. In 2023 it made a bottom at this price and then bounced back. History will repeat itself and the stock will again touch 1559 very soon.
Hope you like my analysis.
Please do your own analysis before investing.
Do like and follow.
Thank you.

BUY RELIANCEBuy Reliance and hold it for 2-3 months. It is the largest company of BHARAT and also the most profitable company. It is a good company for investment purpose.

Will RELIANCE touch 3200Reliance the biggest company in India is ready to give an upside of 23.5% to reach a level of 3200 in the coming months. It is the best time to buy the elephant now. Beautiful cup with handle pattern supports the uptrend of this stock.
Please follow if you like my analysis.
Trade or invest at your own risk

GBPUSD:- BUY TARGET 🎯 HITGBP USD final hit my target as well as I as well as I analyst in the first analysis it my target and I enjoying my target there is the very nice strong momentum that I noticed and with the fundamental concretement

FIL Coin WEB 3 time to Buy and hold till the price reach sky rock of $69 no any order block found during the trend BINANCE:FILUSDT

ICP Internet Computer Coin WEB 3 if Price break order block of 6.80 than the next target of icp should be $22

📖 Jesse Livermore famouse Quotes 📖Jesse Livermore famous quotes:
“Don’t take action with a trade until the market, itself, confirms your opinion. Being a little late in a trade is insurance that your opinion is correct. In other words, don’t be an impatient trader.”
- Jesse Lauriston Livermore.
“There is nothing new in Wall Street. There can’t be because speculation is as old as the hills. Whatever happens in the stock market today has happened before and will happen again.”
- Jesse Lauriston Livermore.
“He will risk half his fortune in the stock market with less reflection than he devotes to the selection of a medium-priced automobile.”
- Jesse Lauriston Livermore.
“Losing money is the least of my troubles. A loss never troubles me after I take it. I forget it overnight...”
- Jesse Lauriston Livermore.
“Profits always take care of themselves but losses never do.”
- Jesse Lauriston Livermore.
“Go long when stocks reach a new high. Sell short when they reach a new low.”
- Jesse Lauriston Livermore.
“It is not good to be too curious about all the reasons behind price movements.”
- Jesse Lauriston Livermore.
🚀 Follow profile for more! 🚀

$SHIB Short Play I Am PredictingCheck Out My Charted Out Idea
Support & Resistance Levels Set Per Chart
ABCD PATTERN CHARTED TARGET $0.00000976
FIBs Drawn
ENJOY!! STAY BLESSED!!

PONTENTIAL 1500 PIPS MOVEGood day you Great traders it is always with my greatest delight to serve you insightful stuff On the NASDAQ Market hope you good here we go
Weekly the trend still bearish making lower highs and lower lows
Daily we have been exchanging momentum bullish to bearish however right now today we broke the 11800(hoztinal lvel in blue) to the downside making it a resistance point now
H4 Momentum does still seem to be bearish last 5hrs we have been slighly pushing down
H1 we have our great profit genarating trades drawn (the green 1 guys)one that has been recently respected at new york session open together with the market being at daily resistance
point and a bearish higher time frame trend i expect the market in the next 1hr to sned profits to all sellers of this nasdaq market till we meet again positively comment our bright perspective below
God bless love u!!!

Big day for NASDAQ TradersGood day you great traders it is with my greatest delight to announce my big comeback
Hope you well let's dive right into this bright idea
Firstly, the weekly tells us the trend is bearish and has been since 21 DEC 2021 Creating lower highs and successive lower lows recently in fact last week, we made a new low
Daily we broke a proficient level price 12200 support level and since then we have been ranging below it
H4 let's call a spade a spade momentum is to the downside since our last impulsive move was to the downside breaking the h4 range in the process making a new low
H1, we followed this impulsive move by a couple of lower lows and when pushing up we have been slow to do so last 12hrs
Verdict is should the market break this trendline support close below it successfully i will take sell be sure to positively comment your bright suggestions below God bless till we meet again

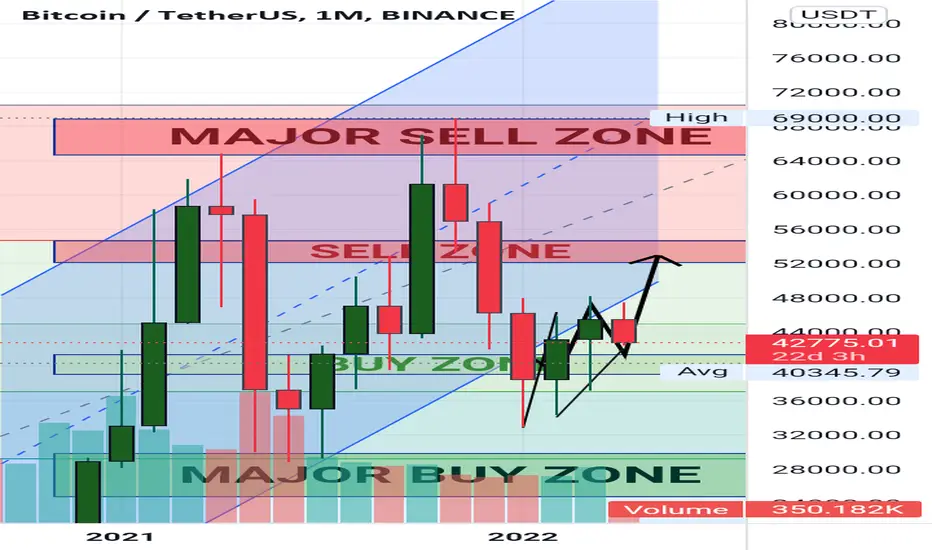
This current week can become bullish for BitcoinOn the daily time frame, Bitcoin (BTC) remains trading in the middle of a wide range, which means that the coin is still accumulating efforts for a further sharp move.
If the price approaches $31,000, one can expect the possible test of the resistance at $32,950 within the next few days.

Is there a secret playing out for TRON? TRX shows last time a stable view, but depending on some trend it shows that it's a trend that could show an unexpected increase candle.
In case TRX will show the breakout, it should at last stay above 0,05 - there are no guarantees into markets - as crypto goes up and down.
IF TRX shows coming time a huge increase - then it's already counted in a secret way.
It's not only trading the price action - but it seems more projects have more extras last time.
For traders, it's always good to wait and to scan for new chances.
Let's see what this stable TRX will show coming time - a breakout to 0,12 would be not bad.
Or this will happen time will learn.
Manage always a risk.

The Golden NASDAQ TRADEGood day you great millions I am happy been dancing the entire day over this new potential wonderful TRADING Day.
How i know you all doing great tell me how you are feeling down below on the comment section
Right, what is the update on Nasdaq today:
Weekly our trend has remained bearish why?
We have been consistently making Lower lows and Lower highs since Dec 21, 2021
Now we know the trend is bearish let's look at what has been occurring on our major structure levels (support and resistance levels)
We recently Successfully respected (By a BIG 3500PIPS UP) the 12190 Price level which held as support just more than four times ON OUR WEEKLY AND DAILY!
H4/H1 have reacted to the market pushing up by creating higher highs and higher lows opposing the weekly trend= (Means we might be entering a range/or having our trends within trends)
Gathering all that data what the verdict is currently to still be bearish at major resistance levels so i do expect the market today to push up to 12500 then we will see what happens from the should that happen
Till we meet again kindly positively comment below on your outlook God bless Brave minds

NASDAQ Trading setup for the boldGood day great Traders hope you are all great I know I am
Now let me feed you my introspect on this great rewarding market
Here we go: Weekly we are overall bearish having created successive lower lows and lower highs since 21 December 2021
Daily we seem to have approached a great support level @price level 12400 holding with over 3 touches
Hourly timeframes couple of the last days we have been selling to the downside however the market is currently creating again progressive lower lows and lower highs
Does this mean we should sell? Not yet cause looking at the momentum it is currently steaming out to the downside so should the daily candlestick close below the great 12400 support level the we can come back see what peaks and troughs the market forms then selling should be an option or the market could respect the support level today then that means we should see it retrace to the 12700 level then collect orders sell afterwards
for now, its waiting time Loved it Guys I'll be back to explain again God bless positively comment below tells us what u think

NASDAQ QUICK SELL SETUPGood day great traders hope you all doing phonemical
Here's One setup about to occur
Weekly is bearish we made a new low last week Friday first new lower low point since 2008 march
Daily we rejected the 13100-price level resistance more so not pushing up as aggressively+ lack of momentum
H4/H1 has been correctively moving down however ranging between weekly structure levels not creating any new major highs in the process
Which leaves room for us to trade the lower timeframes so the analysis now is as follows we expecting a h1 down warding trendline creating a lower high now we expect the market to break past the 13000-price level and go for the 12800 level let's see what happens
God bless feel free to positively comment

Crazy Times for Nasdaq what next?Good day great traders it is once more with my greatest delight to be serving you insights on Nasdaq today
Now what's been happening with this market
Weekly our trend still has been bearish since 27 Dec 2021
Again, we have recently approached the 13000-price level which has a weekly support that has 4 touches holding support since 8 March 2021 so it is a strong support area
On the daily we got a close below this support level Tuesday however we did engulf back into this 13000-price support level
What does this mean? we are likely starting to range after or great impulse down
H4 h1 they do not seem promising to be taking trades on them because we recognize lack of momentum
What is the verdict? Wait for the market to break below the 13000-level close successfully there then we should catch further retracements on lower timeframes why are we to sell? the higher timeframe still is bearish and till we maybe push above the 13600-level creating higher lows and new higher lows then have the weekly close above the price too then trends should continue up but for now I will be selling be sure to comment positively till we meet again God bless


NASDAQ Continues downtrend?Good Day great traders
Hope you all recharged locked and loaded ready to work on this wonderful market once more it is our greatest delights to be able to serve you insights on Nasdaq today oh ooh here we go...
Nasdaq grocery list is as follows:
Weekly we closed below the 14000 price level signaling that bearish trend will continue despite a bit of strong bullish movement last week
Support has been broken on the weekly so applies to the daily candlestick broke the 14000 support which should see it act as future resistance
H4 we broke the 3 touch purple trendline and successfully created a new low for our hourly timeframes
Secondly the momentum to the upside isn't strong as seen in the last 3 candlesticks and we are currently respect the support level that has turned to resistance why? the market close below it and now is testing the area which acts as resistance
Verdict is should we successfully break our new formed (Green colour with 2 touches so far)trendline close below it strongly and get further confirmations (reversal candlesticks signaling downside movement) on lower timeframes We will consider sells till we meet again God bless You great traders feel free to positively comment your predictions below Cheers!!!

I've Been waiting for this Nasdaq trade all weekGreetings you millions
Hope you are all well it's with our greatest delights to get to serve you guys today
Here's Today's Nasdaq grocery list :
Weekly We stand bearish with Having created successive Lower highs and Lower lows the trend is bearish since 27 Dec 2021
Daily we approached a major support level (highlighted in white @14000 price level)
Why is it major? well it held on the weekly 3 times as support more times on the daily
Now what was the reaction? We closed below this major support yesterday on our daily
The very same support level now is a resistance Which means if we successively touch it/come close to the yellow trendline down-warding as well
And reject it and then break that purple trendline with 2 touches we should be for potential impulsive sells !!!
Be blessed God bless kindly POSITIVELY COMMENT what you see till we meet again cheers

BTC behavior as i predicted BTac market is same behavioring as i predict the market before please follow like qnd share to support me.
NASDAQ MARKET ON VACATIONGOOD DAY GREAT TRADERS ONCE MORE IT IS WITH MY GREATEST DELIGHT TO SERVE YOU WITH INFORMATION TODAY
THIS is my Nasdaq grocery list as follows:
Weekly we bearish creating Lower lows and lower highs
Daily we are at a major support area in which the market has stalled at
4hr the momentum is neither bullish or bearish last 24hrs
1hr we haven't created any new highs or broken trendlines
Which brings to conclusion the market is ranging currently till we get a break of range creating new lows or highs i will be on vacation waiting for the market to break cause remember take a trade where there's no trend then what liquidity will be unpredictable leaving you vulnerable best thing to do is let it break the range then consider trades for now i will be reading a forex related book reviewing my trades for the week getting my mental attitude better Till we meet again God Bless Great traders
