Books on trading and Profitunity strategy by Bill WilliamsIn this article, I will share books that were useful for me in the process of studying trading and the Profitunity trading strategy by Bill Williams.
Bill Williams "Trading Chaos 1 and 2" ♡
The first and third books by Bill Williams contain complete and up-to-date information on the Profitunity strategy. The second book "New Trading Dimensions" is intermediate and less relevant.
The book Trading Chaos 1 includes trading psychology (an integral part of trading), the basics of understanding the markets, candlestick patterns (divergent bars and determining the trend based on a pair of bars, the market facilitation index, volume and squat bar), Elliott waves (characteristics, determining waves using the MACD 5/34/5 indicator, an analogue of the modern Awesome Oscillator, and the Fibonacci ratio), fractals, trading in waves (impulses 1-3-5 and ABC correction). And also very important topics — how to work with your internal structure and how our brain functions (Chapter 11).
The book Trading Chaos 2 (co-authored by Bill Williams' daughter Justine Gregory) includes a description of the Alligator indicator in combination with the Awesome Oscillator, divergent bars and fractals. And also tools for working on yourself - morning pages (Chapter 13, from the book by Julia Cameron "The Artist's Way") and autogenic training for traders by Johannes Schultz (Appendix 3).
Tom Hougaard "Best Loser Wins" ♡
The book greatly expands the perception of markets, the approach to trading and deeply describes the psychology of trading.
The book was first published in 2022 and perfectly complements the books by Bill Williams.
John J. Murphy "Technical Analysis of the Futures Markets"
A basic book on classical (linear) technical analysis, which also contains up-to-date information on Elliott Wave Theory in addition to the corresponding section in the book by Bill Williams "Trading Chaos 1".
Alexander Elder "Trading for a living" (How to Play and Win on the Stock Exchange)
A book on the psychology of trading and classical chart analysis, includes a detailed description of popular indicators and a description of the basic strategy "Three Screens" (analysis of the chart on the senior and junior timeframes), as well as an important topic "Risk management".
Steve Nison "Japanese Candlesticks"
A basic book on classical candlestick (bar) analysis.
Thomas DeMark "Technical Analysis - a new science"
Constructing trend lines based on the support price minimums and maximums described in the book led me to search for an indicator that displays such bars, as a result, I first became acquainted with the Bill Williams Fractals indicator, even before I became acquainted with his strategy.
Theodore Dreiser "The Financier" ☽
A novel published in 1912 based on the life story of the American millionaire Charles Yerkes (1837-1905). The book shows how the financial and economic environment surrounding the main character (Frank Cowperwood) already from childhood forms in him the psychology of a businessman and stock dealer...
Robin Sharma "The 5 AM Club" ☆
This book is not about trading, but about healthy habits. But for me the book became useful, including in trading, because I made the following conclusion for myself - it is important to rest (take breaks) every day, and not only on weekends and vacations. And it is worth starting with the fact that after waking up there is free time (about 1 hour) before business activity begins, i.e. either wake up earlier, or move all things forward, so that you can start your day easily. And taking breaks in trading is very important, so I recommend paying attention, for example, to the algorithm for removing limitations using neurographics.
(◉ ‿ ◉) There are many good books, as well as good strategies, but I am sure that only independent deep study, practice, good concentration and self-control will allow you to find your own understanding of the markets and your own approach to successful trading.
Bill Williams Indicators

Deep dive into Acceleration / Deceleration Indicator Hello, Skyrexians!
Last time we discussed how you can use the Awesome Oscillator to create profitable crypto trading strategies and which type of signals it generates. Today we will deep dive into Acceleration/Deceleration (AC) the next Bill Williams indicator, which can also enhance your cryptocurrency trading strategy. This indicator also can be valuable not only for manual trades, but also for developing your crypto trading algorithm, crypto algo trading platform, crypto trading bot, ai trading bot or grid bot.
The main thing is to understand what is the AC indicator and which signals it generate, which signals we shall use in crypto trading like top crypto traders. Let's go!
What is Acceleration / Deceleration?
The Acceleration/Deceleration Oscillator (AC) is a technical analysis indicator developed by Bill Williams, a notable trader and author known for his work in market psychology and trading systems. This indicator helps traders identify changes in market momentum and potential trend reversals.
How the Acceleration/Deceleration (AC) Indicator Works? The AC indicator is based on the idea that the momentum of the market (speed of price movement) often changes before the price itself changes. By identifying these shifts in momentum early, traders can anticipate potential trend changes.
The AC is derived from the Awesome Oscillator (AO), another indicator created by Bill Williams, which is the difference between a 34-period and a 5-period simple moving average of the median price (the average of high and low prices).
The AC is calculated by subtracting a 5-period simple moving average of the AO from the AO itself. Mathematically, it can be represented as:
AC = AO − SMA5(AO)
Where AO is Awesome Oscillator (calculated as the difference between the 34-period SMA and the 5-period SMA of the median price). SMA5(AO) is 5-period simple moving average of the AO. Now let's consider which types of signals AC can generate.

Deep dive into Awesome OscillatorsHello, Skyrexians!
We continue our series of educational content. Today it's time to consider the Awesome Oscillator, the indicator introduced by Bill Williams in his book "Trading Chaos". It can be very useful in your crypto trading. A lot of crypto trading strategies use this indicator. You can combine it with other indicators to create your crypto trading algorithm, trading bot or manual cryptocurrency trading strategy. Most of top crypto traders and top crypto trading platforms use it in their automated crypto trading. If you will be aware you to trade using Awesome Oscillator will be able to enhance your automated trading bot, manual trading strategy or setup grid trading bot more effectively. We think there is enough arguments to learn how to use this indicator. Let's start our deep dive!
What is Awesome Oscillator?
The Awesome Oscillator (AO) is a momentum indicator used in technical analysis to measure the strength and direction of a market trend. It was created by Bill Williams and is designed to help traders identify potential reversals or trend continuations.
Key Features of the Awesome Oscillator:
Momentum Measurement: The AO measures the difference between a short-term moving average and a long-term moving average, using midpoints of each candlestick rather than closing prices. This provides insights into the market's momentum.
Histogram Representation: The indicator is typically displayed as a histogram, with bars oscillating above and below a zero line. Green bars represent increasing momentum (bullish), while red bars indicate decreasing momentum (bearish).
The Awesome Oscillator is calculated using simple moving average(SMA) as follows:
AO = SMA(5-period) − SMA(34-period)
Now let's consider the signals which can be produced by Awesome Oscillator with the examples.

$MDT Inverse Head and Shoulder??NYSE:MDT
Dividend: Medtronic has a forward dividend yield of about 3.41%, which might attract investors looking for income from their investments.
MDT appears to be in a slightly bullish to neutral phase.

$NFLX Bullish ReversalNASDAQ:NFLX is reversing from a support line looking to continue its bullish move... great opportunity for selling premiums here ... Whats your thoughts here?

Is Bitcoin BTC and crypto scamming now or it's FUDHello, Skyrexians!
This weekend was extremely fearful on the crypto market, even more, today is a true "black Monday" and not only crypto, but also traditional markets are crashing right now. The most commonly known crypto trading strategies gave false signals before the crash. Most of top crypto trading platforms and top crypto traders faces with the huge losses, algorithmic trading bots and other algorithmic crypto trading software led their users to losses and liquidation. Different automated trading bots, grid bot and other cryptocurrency trading also performed awful for most of a people. Only ai crypto trading bot allowed people not to lose.
The really dark time came to the market, how to overcome all this FUD and be successful in crypto trading. We know that the most important is understanding on which market phase we are now. In today's article we will look at the different charts and time frames on BINANCE:BTCUSDT price chart and try to understand what is coming next.
Monthly time frame shows it's almost done
If you see our previous Bitcoin analysis you will find that GETTEX:49K was absolutely reachable. But the speed of this move really concerns us and we need to take a look at the global picture first of all. The sideways which started in March 2024 led to the first red column on Awesome Oscillator, and this is our first reminder that the bull market is not forever. This is the first sign of weakness. Momentum is gone, therefore we cannot wait for the bull run continuation to the insane numbers like $200k. Bull market is almost over! The bearish divergence and Elliott waves counting tells us that wave 5 of super cycle is done and we will enter the bear market which has never been before.
Is it time to panic? We assume not! Last wave 5 shall also consists of 5 waves and we cannot see now the clear confirmation that this bull run is finished. It's weakening but will likely continue. Where it will be finished. The approximate projection for wave 5 shows us that BTC will likely reach $80k+, but not significantly higher. After that we will see the bear market with target at $35k.


Will StarkNet STRK revive from the dead zone? Hello, Skyrexians!
Today we have another one "perspective" crypto to overview. This is BINANCE:STRKUSDT token. Since Binance listing price dropped significantly and continue dropping now. Entire crypto market dump boosted the STRK sell-off. Today we will analyze in details this asset and try to understand will this coin pump or die. It's vital for successful cryptocurrency trading to consider all possible scenarios.
Looking at the most of ideas on this asset we can conclude that most of the crypto trading strategies gave the advice to buy this coin when price was above $1.5. Obviously, it's not profitable crypto trading strategies. Even automate crypto trading of most cryptocurrency trading platforms fails to predict the price of this asset because after dumping at 50% it continues dumping, which is not likely according to the most crypto trading algorithm. That's why most of automated trading bots and grid bot faced with losses for this asset.
The exception is the ai crypto trading bot which takes into account the Elliott wave, the key feature of successful crypto trading. Today we consider STRK price action using advanced technique. Let's go!
STRK dump structure
Let's use the 1D time frame to analyze this downtrend. Fortunately, it has the clear Elliott waves structure. Awesome oscillator helps us to find the most impulsive wave 3, this is the min value. After this the price formed the flat or triangle wave 4. If crypto has already significantly drop it tends to form the flat corrections without big retracement to the upside. This is because most of early bulls have been locked in their position and they shall be disappointed before reversal.
Now we can see three strong signs of trend reversal. Awesome oscillator crossed zero line after wave 3 bottom reaching, it has printed bullish divergence and the momentum now is upward. In most of cases these are enough to make a decision about the entering trade, but we will make the deep dive further in different indicators.

IQQQ Weekly - 'Well'All well?
iShares Global Water UCITS ETF
IQQQ in EUR
IH2O in USD
P/E Ratio 27.38
P/B Ratio 3.02
as of 05/Jul/2024
Standard Deviation (3y) 21.25%
as of 30/Jun/2024
IH2O.USD Weekly snap
EDIT
Fractal low does for some reason not show on the published idea chart
IQQQ snap
Current Fractal high is unconfirmed till +4d8h

Composite way.Hi, everybody.
This is one of those composite charts that are designed to help you understand a little more.
First let me say that if you look at the larger timeframes, the whole market situation looks like some sideways movement. While some see a rise as early as tomorrow and others see the market falling, I see no clear signs of either right now. My personal opinion. But I do see something in the future.
So, we take the capitalisation of all coins without BTC and ETH,
subtract Tether additionally from it and divide by BTC.
On the left is a daily chart, on the right 19D.
Daily.
I haven't switched on the Volume Flow Indicator (VFI) for a long time.
There is a positive signal, the short volume EMA crossed the long EMA to form a golden cross.
If the volume data is valid, it means that the process of pumping liquidity into Total3 is underway.
The signal from the 9 seasons rainbow is ambiguous.
We have as many as three fuchsia-coloured stripes signalling a crazy sell,
and they have been replaced by light red stripes. In typical cases this is interpreted as:
Crazy Sold (Fuchsia) -> Bear Bounce (Light Red):
This normally indicates price has dropped to a new level
In addition, the Whalemap Indicator recorded purchases in February this year at 0.43.
It is assumed that the profit on these purchases is underperforming. Now the altcoin market is below this buying point.
19D.
Here I will switch to Ichimoku and Stupid Willy.
On the clouds we can see the "thin neck" area. Anyone who has been following my charts for a long time knows that I keep a close eye on these areas. When Senkou Span A and B come so close, it means an area extremely convenient for a resistance breakout. For price to break out above the clouds and start a run.
On this chart, the neckline starts on 23 September and ends on 31 October.
We can expect a breakout in this time frame, I think.
Stupid Willy showed a switching trend signal from red to green as early as the end of April, and pretty quickly back to red again. However, these signals occur when the black EMA crosses the major signal line.
And the black has once again come close to the leading line. I expect that by mid-summer we will have a sustained green.
Past pumps have formed two tops on this chart.
1.34 and 0.98. Additionally, I will highlight the resistance level of 0.68.
0.68 is the first target that the TOTAL-3 should pass towards new tops.
Unfortunately everything is still very slow.
But we are not discouraged.
I remember the summer and autumn of 2017,
not everyone actually thought growth was possible.
Killing faith is one of the tricks of this market.

NOT/USDT Bullish Global 3rd Elliott WaveWithin the ascending channel, a five-wave impulse and an ABC correction have been completed, reaching the 0.618 Fibonacci level. The price has encountered the first resistance level (res).
Based on the fractal from the initial five-wave pattern, there is potential for growth towards the upper boundary of the channel, into the Fibonacci zone 1.236 - 1.382. From there, an ABC correction is expected towards the Fibonacci zones of the second subwave 3(2) of the global third wave. Subsequently, I anticipate the formation of the first subwave of the third global wave 3(3-1).
The Alligator indicator shows an upward trend. There is a support level (sup) below. The scenario will be invalidated if there is a breakout and consolidation below the support zone (sup).


Discovery Mission4h tales of future expectations
Orbital price ping pong in bearish fractal reversal. Accelerating to the path of least resistance.
We gotta fuel high to go to where no man every bought the top before us and beyond.
Related idea:

EXVG...which Planet is next?Super Neutral Play but let's go!
Fibonacci Retracement
Fibonacci Extension
Volume increase
and seems to be a really cool game to explore

Looming AI Power Stock?
NASDAQ:MRVL The Chip Designer Company is a must watch stock especially this week with the upcoming earnings report.
This is my strategy:
Using Bollinger Bands and Fibonacci Retracement, we see a consistent trade volume and slight increase in volatility as the price drops below the SMA and nears the lower band. The price is currently $76.68. We can expect it to reach a price target of $77.75 (test strategy here) for uptrend confirmation.


Ultimate guide on Williams Fractals in crypto tradingIn today’s article we will reveal one of the most powerful tools in cryptocurrency trading which often ignored even by top crypto traders. We are talking about fractals. Best crypto traders just use fractal levels to find support and resistance and trade bounces and breakouts. Spoiler - the fractal breakout is a right way to use it, but support and resistances aren’t. A lot of people are using fractals even for their algorithmic trading bots. We remember when encoding our first automated crypto trading bot the fractals were used for support and resistance detection. It’s not surprise that it was not one of the profitable crypto trading strategies.
Now we researched a different ways to use fractals and assume that we have the great expertise in it to share our knowledge with you. It’s not a top secret that even Skyrex ai trading bot is using fractals in detecting potential trading opportunities. Please, read this article carefully and you will know build your own cryptocurrency trading strategy or even apply it to automated cryptocurrency trading. Let’s go!
Initiating fractal
First of all let’s understand what is the fractal and how it looks like. Fractal is not just a sequence of candles like it can seems on the first look. This is the change in behavior of traders on the market. When you see the fractal on the chart, this is the turning point where a lot of traders were too worried that current trend can be stopped here.
Technically fractal is very simple. If we talk about upfractal it’s just a consequence of bars where the central bar have the highest high than two preceding and two following bars. On the chart below you can see different fractal’s shapes. Don’t worry about it that much because on the TradingView you can find an indicator which find all fractals. Even if you build automated trading bots you can just copy the code of this indicator.
How to trade using fractal
Let’s go to the most interesting part of an article. How to execute trades using fractal? You will be surprised but it’s super easy. Let’s take a look at the picture and try to understand the concept of fractal start, signal and stop.
Fractal start is the fractal which precedes the another one fractal in the opposite direction
Fractal signal is the fractal which follows the fractal in the opposite direction
Now when we have this two fractal combination we can place our sell stop one tick below the fractal signal and go short if market reach this level. Now it’s time to place the stop loss. When your trade is open you shall chose the highest fractal from the last two and place stop loss order one tick above. Here you can have two cases A and B. Look carefully and try to find these formations on the real charts.
Conclusion
Next time we will look inside the fractal and try to understand how to trade during sideways. I think today you could understand that fractal trading is good in trend markets, but it’s not profitable during sideways. Price will hit your order every time and hit stop loss many times before the true trend move. For sure fractal breakout trade guarantees that you will not miss the big trend move, but you will have multiple losing trades in the range bounded market. Next time we will discuss how to avoid it.

WKHS a risky penny EV StockWorkhorse could start working again as the 50 minute chart is showing a suggestion of a reversal
after a long trend down. Price has passed over the longest moving average which is a SMA20.
The EMA cloud ( 100, 200, 300) is starting to turn up and price has crossed over it. All in all,
there are some golden crosses here. Blue buying volume spikes are seen on the relative
volume indicator and they are about six times the running mean. In a bit of divergence the
price volume trend has oscillated up. Overall, this is a penny stock with a price under $ 1.00
It appears to be starting a trend up. I will zoom into a lower time frame and find a optimal
entry. I amy get call options as well. The risk in the trade should be limited by a stop loss
wide enough to allow for a true range or even twice that. My target is about 1.15 the price level
at the time of the last good earnings report. This is about 300% upside. It will probably never
get there but hay you never know. Stranger things have happened.

Short position koc holding vadeliShort position for koc holding which had the grafik on willy at February 2021. potential tp at %20

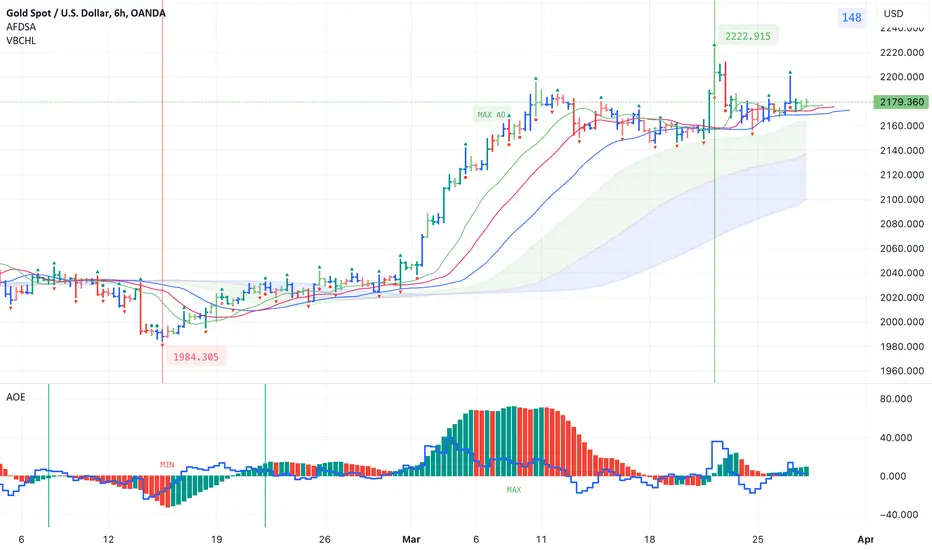
Indicators for trading using Bill Williams' Profitunity strategyI published 3 indicators for trading using Bill Williams' Profitunity strategy. For each indicator, I have added a visual and detailed description in English and Russian. In this post I will briefly describe these indicators and how I use them together.
AFDSA indicator (Alligator + Fractals + Divergent & Squat Bars + Signal Alerts)
Includes Williams Alligator, Williams Fractals, Divergent Bars, Market Facilitation Index, Highest and Lowest Bars, maximum or minimum peak of the Awesome Oscillator, and signal alerts based on Bill Williams' Profitunity strategy:
Bullish and Bearish Divergent Bar Signal + Squat Bar + Green Bar + Fake Bar + Awesome Oscillator Color Change + AO Divergence.
Crossing the green line (Lips) of an open Alligator.
Formation of a fractal.
Signal about the breakdown of the last upper or lower fractal.
Signal about the appearance of a new maximum or minimum peak of AO in the interval of 140 bars from the last bar.
I also added an Alligator display for the higher timeframe, for example, if the chart timeframe is 1 hour, then the higher timeframe will automatically be 4 hours, if the chart timeframe is 4 hours, then the higher timeframe will be 1 day, etc.
AOE Oscillator (Awesome Oscillator + Bars count lines + EMA Line)
Includes the Awesome Oscillator with two vertical lines at a distance of 100 and 140 bars from the last bar to determine the third Elliott wave by the maximum peak of AO in the interval from 100 to 140 bars according to Bill Williams' Profitunity strategy. Additionally, a faster EMA line is displayed.
I also added display of the AO line for the lower timeframe instead of the EMA line if the Moving Average Line values (method, length and source) are equal to the Awesome Oscillator values in the indicator settings. For example, if the chart timeframe is 1 day, then the lower timeframe will automatically be 4 hours, if the chart timeframe is 4 hours, then the lower timeframe will be 1 hour, etc.
VBCHL indicator (Visible bars count on chart + highest/lowest bars, max/min AO)
The indicator displays the number of visible bars on the screen, including the prices of the highest and lowest bars, the maximum or minimum value of the Awesome Oscillator. The values change dynamically when scrolling or changing the scale of the chart, but with a delay of several seconds, so this feature is included in a separate indicator so as not to slow down the work of other indicators.
Indicator settings
In the AFDSA indicator I use the following settings:
By default, the Squat Bar is colored blue, and all other bars are colored to match the Awesome Oscillator color, except for the Fake bars, which are colored with a lighter AO color. But I also enable the display of "Green" Divergent bars in the "Green Bars > Show" field.
I enable the display of Alligator for higher timeframes in the "Alligator for higher timeframe > Enable" field.
In the indicator style settings, I disable the display of the highest and lowest bars, maximum and minimum AO peak labels, because these labels are also displayed by the VBCHL indicator depending on the number of visible bars in the chart window.
Only after opening a position, I enable all additional alerts in the “Enable all additional alerts” field (after changing this field, you need to re-create the alert for the current chart): crossing the green line of an open Alligator, formation of a fractal, appearance of a new maximum or minimum AO peak.
In the settings of the AOE oscillator, I enable the display of the AO line for the lower timeframe instead of the EMA line, setting the same values in the fields for the Moving Average Line (method, length and source) and Awesome Oscillator.
In the VBCHL indicator settings, I only enable the simple display text style for labels in the "Simple display text style for labels" field.
As a result, when analyzing the current chart, I immediately see all the signals on the chart, the location of the bars relative to the Alligator on the higher timeframe and changes in the Awesome Oscillator on the lower timeframe. And thanks to the VBCHL indicator, I quickly select the desired timeframe for analyzing the 5-wave Elliott impulse, focusing on the interval of 140 bars, and immediately see whether there is divergence between the maximum AO peak and the following lower AO peak in this interval.
Pump Up the JamMonthly Chart of CBLS. Bullish! Little Island Reversal w./ a double bottom. Expecting to C higher monthly Close(s). Higher lows on each month.

Huge Gap at SP500 Hey there!
We can see huge gap at SP500, also looks the same like at the previous movements.
Stop loss and Take profit at marked w read and green lines.
IMPORTANT! Always follow RM strategy, trade not more than 2% of your deposit!
LMK what u trading this weeks?

BTC is falling to 52.000$?Hey guys!
Today, I'm seeing a rather dim picture for Bitcoin.
It appears that we're currently experiencing ABC Elliott correction waves. Furthermore, despite a minor uptick, I'm observing a bearish divergence, and overall, trading volumes seem somewhat weak. The weekly support line is situated around $52,000.
Additionally, historically, BTC tended to correct 2-3 weeks before halving events...
If you're considering trading this movement, don't forget to set up a stop-loss and follow a risk management strategy.
What are your thoughts, guys? Do you believe we'll retest $52,000, or are we headed back towards reaching $100,000?
