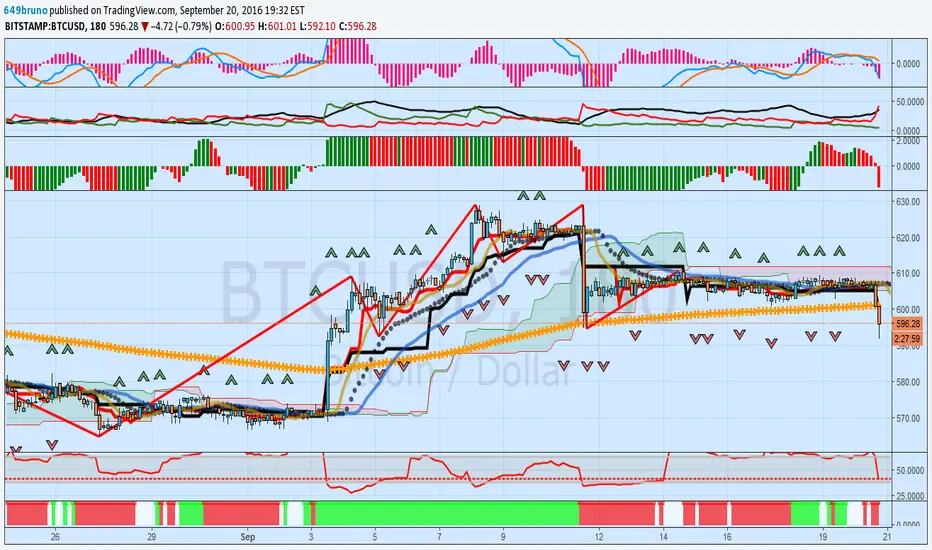
BTCUSD Update: Bearish Trend Building Its Downward Momentum Negatives:
1. Last valid sell Sell Fractal was Sept 13th.
2. Your compass for direction, the alligator, is feeding weakly in a down trend.
3. CHOP is almost BELOW the shaded area. This predicts a trend.
4. CHOP ZONE is red, indicating a downward bias.
5. Prices are trading below the Ichimoku Cloud .
6. Prices are below the red Ichimoku Cloud conversion line.
7. Prices are below the Ichimoku Cloud baseline.
8. The 5/34 MACD (top) has a bearish cross. Histogram within is falling.
9. The phase energy (top lower) is steadily falling, and it is still below the zero line. NOW HAS A DOWN-WARD BREAK.
10. The-DMI (top middle) has the dominant direction as down (red line over green), and the black line is rising. This means more strength in SELLING.
11. Ichimoku Cloud has red border.
Positives:
1. NONE TO REPORT.
Support is last swing low at $594.63.
Want odds? 92% odds down (because of the sell Fractal, down alligator direction, lower-DMI, lower phase energy),
8% odds up/ sideways (CHOP VERY NEAR indicating trend).
What to look for: if there is to be a breakout move lower, CHOP should start falling (lower in the shaded area,
THEN OUT OF SHADED AREA) to confirm the trend.
Another indication of trend is-DMI (top middle). Currently-DMI has a strong negative bias.
Note: DMI-indicates trend. CHOP indicates trend. From my own experience, CHOP is more reliable as a trend tool, but-DMI reacts faster.
This is why I use both.
There are PLENTY OF NEGATIVES AND NO POSITIVES on this three hour chart.
The daily chart should be used to confirm. (Naturally, the daily moves more slowly).
In my opinion, use tight stops if you are long. I would not short until a breach of $594.63.
Good luck to you in all your trades. Don.
Bill Williams Indicators
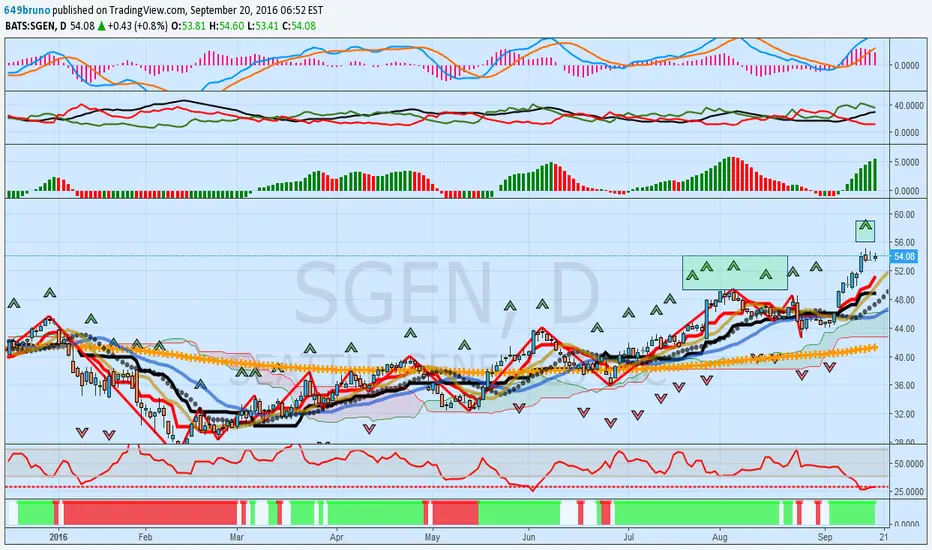
Seattle Genetics: Rules And Disciplines That Will Help You WinWhat determines whether or not I take a position, up or down, in a stock , commodity, or futures contract?
WHAT IS THE SINGLE BIGGEST FACTOR THAT I SHOULD KNOW?
To me the answer is simple. Is what I am reviewing "TRENDING" or "RANGE BOUND"?
I need to know if a stock or commodity is trending. Why? RANGE BOUND assets are very hard to make money, long or short.
Let's look at-Seattle-Genetics, a biotechnology company focused on the development and commercialization of therapies for the treatment of cancer.
Is-SGEN TRENDING? Yes. How do I know?
Several things tell me. The buy Fractals (in rectangle). The rising Ichimoku Cloud . The rising trend-line. The Alligator is feeding in the up trend.
IMPORTANT: to determine the STRENGTH of the trend I use CHOP, (lower indicator below chart). The lower the red line the stronger the trend.
The higher the red line the more likely I will see "choppiness", or range bound trading. (It is harder to make money with lots of chop).
Right now CHOP tells me-SGEN has a trend, the trend is very strong (it is below the shaded area).
The dashed line is the price trend in CHOP, so the trend will likely remain strong.
The lower the line is below the shaded area, the stronger the trend.
Here are the positives for-SGEN:
1. Currently a buy Fractal.
2. The lower indicator under the chart is CHOP; readings below the shaded area (38.2) indicate a strong trend.
Authors Note: last weekend I reviewed almost 900 charts for trend. I found only 8 CHARTS THAT HAD CHOP READINGS UNDER THE SHADED AREA.
This told me that only about 1% of what I reviewed are trending. If you have had trouble with your trades lately, ask yourself the TREND question.
Then I would suggest you add trend analysis to your own "Rules of Engagement" . It will most likely keep you out of frustrating range bound trades.
3. The top lower indicator is phase energy, and this is positive. Very strong.
4. The alligator is feeding in the uptrend.
5. 5/34 MACD (top indicator) is strong.
6. Prices are trading above the Ichimoku Cloud .
7. Prices are trading above the thick red Ichimoku Cloud conversion line.
8. Prices are trading above the Ki jun-Sen baseline of the Ichimoku Cloud and this has been HEADING SHARPLY HIGHER.
9. The Directional Movement (top middle, a.k.a.-DMI) is strong.
In my opinion, SGEN-is in a solid uptrend.
I hope you establish your own "Rules of Engagement" and stand by them.
Two final thought:s if you swing trade and look left for structure, an understanding of trend enhances your probabilities of being correct.
If the CHOP is below the shaded area and you have sell Fractals and a falling cloud, and other indicators are falling,
CHOP is still valid in telling you the strength of the down-trend. USE Directional Movement (a.k.a.-DMI) to help compliment CHOP.
If you do your homework you will find plenty of opportunities.
Identify TRENDS and wait for the market to come to your price objective. Don't chase.
I hope this helps you.
Mark Twain said: “Good judgment comes from experience, and most of that comes from bad judgment.”
Good luck to you. Don.
GBPUSD: Federal Reserve Jitters? Key Support At Fib .236This is a three hour chart. If you looked at a daily chart for-GBPUSD you will notice a TRIPLE BOTTOM and a well defined inverse head and shoulders pattern.
The low of the triple bottom was 1.27893 on July 7th. The next low was 1.28654 on August 15th.
The third low is right now, 1.29942 on September 16th.
The negatives on the above chart are many:
1. Many Sell Fractals.
2. Your compass for direction, the alligator, is feeding STRONGLY in a down trend.
3. CHOP is almost BELOW the shaded area. This predicts a STRONG SELLING TREND.
4. CHOP ZONE is red, indicating a downward bias.
5. Prices are trading below the Ichimoku Cloud . This is a sell signal.
6. Prices are below the red Ichimoku Cloud conversion line. This is a sell signal.
7. Prices are below the Ichimoku Cloud baseline. This is a sell signal.
8. The 5/34 MACD (top) has a bearish cross. Histogram within is falling. This is a sell signal.
9. The phase energy (top lower) is steadily falling, and it is still below the zero line. This is a sell signal.
10. The-DMI (top middle) has the dominant direction as down (red line over green), and the black line is rising. This means more strength in SELLING.
11. Ichimoku Cloud has red border.
Positives: none to report.
What to look for:
Key chart support levels: Fibonacci .236, last swing low at 1.28654, bottom-most level of the triple bottom at 1.27893.
As prices approach these levels, look to the indicators listed above for any signs of directional change.
Price action might have to wait for the Federal Reserve meeting next week.
Good luck to you in all your trades. Don.

BTCUSD Update: Trendless Action But Increased Bearish DivergenceThis update is from two days ago. Sideways action prevails. Here are the indicators.
Negatives:
1. Last valid sell Sell Fractal was Sept 13th.
2. Your compass for direction, the alligator, is feeding weakly in a down trend.
3. CHOP is almost above the shaded area. This predicts a lack of trend.
4. CHOP ZONE is red, indicating a downward bias.
5. Prices are trading below the Ichimoku Cloud .
6. Prices are below (or at) the red Ichimoku Cloud conversion line.
7. Prices are below the Ichimoku Cloud baseline.
8. The 5/34 MACD (top) has a bearish cross. Histogram within is falling.
9. The phase energy (top lower) is steadily falling, and it is still below the zero line.
10. The-DMI (top middle) has the dominant direction as down (red line over green), and the black line is rising. This means more strength in SELLING.
11. Ichimoku Cloud has red border.
Positives:
1. Not many. Price is hanging above trend support, but this is a very weak positive.
Support is last swing low at $594.63.
Want odds? 88% odds down (because of the sell Fractal, down alligator direction, lower-DMI, lower phase energy),
12% odds up/ sideways (CHOP not yet indicating trend).
What to look for: if there is to be a breakout move lower, CHOP should start falling (lower in the shaded area) to confirm the trend.
Another indication of trend is-DMI (top middle). Currently-DMI has a strong negative bias.
Note: DMI-indicates trend. CHOP indicates trend. From my own experience, CHOP is more reliable as a trend tool, but-DMI reacts faster.
This is why I use both.
There are FAR MORE NEGATIVES than positives on this three hour chart. The daily chart should be used to confirm. (Naturally, the daily moves more slowly).
In my opinion, use tight stops if you are long. I would not short until a breach of $594.63.
Good luck to you in all your trades. Don.

Update: All That Glitters Is Not XAUUSD: 12 Bearish SignsUpate from three days ago. XAUUSD-is still weak. It is down an additional 2% since then.
Here are ONE DOZEN negatives I see in-XAUUSD, and why I feel-Gold is a sell:
1. Multiple Sell Fractals in effect (red rectangle on chart).
2. Alligator jaws OPEN, feeding in down-trend. THIS IS YOUR DIRECTIONAL COMPASS.
3. Chop indicator (under chart) is in the shaded area. This indicates a ZERO trend and, at best, sloppy action with a downward bias.
4. Phase energy (lower top indicator) is heading LOWER. The action is below the zero line. Decidedly bearish .
5. DMI-(middle top indicator) has red (sell) as the dominant factor, and this bearish action is gaining strength as the (black) DMI-line rises.
6. Prices are trading BELOW the Ichimoku Cloud . This is a sell signal.
8. Prices are trading below the Ki jun-Sen baseline of the Ichimoku Cloud . This is a sell signal.
9. Prices are trading below the thick red Ichimoku Cloud conversion line. This is a sell signal.
9. The red Ichimoku Cloud conversion line direction is heading lower. This is a sell signal.
10. The Ki jun-Sen baseline of the Ichimoku Cloud direction is heading lower. This is a sell signal.
11. The CHOP ZONE indicator (under chart) is red, indicating a down trend.
12. 5/34 MACD (top) is heading lower.
My comments: very bearish signs. Decision: do not go long-XAUUSD. If you are short, maintain position.
Good luck to you. Don.

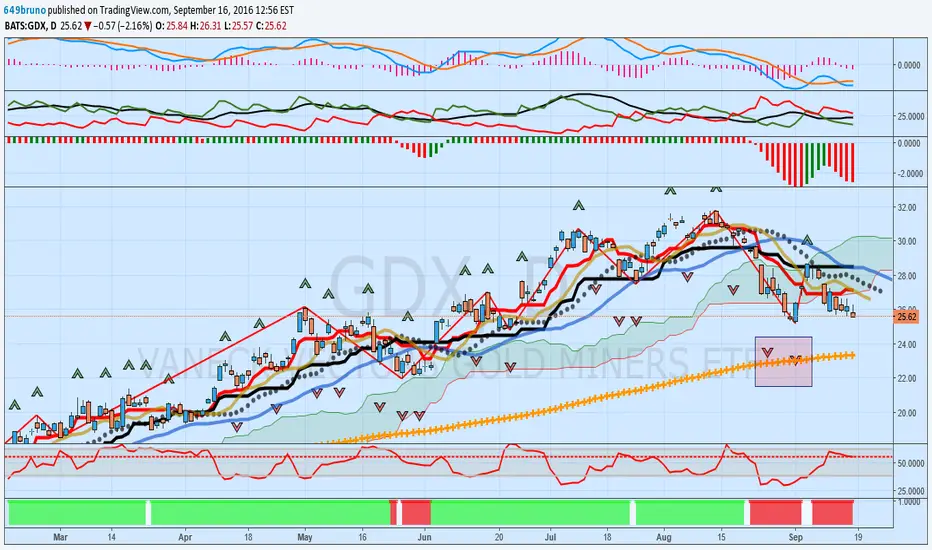
Update: All That Glitters Is Not GDX: 12 Bearish SignsUpdate: GDX-is weaker than when I published the negative (sell) chart four days ago. It is down another 6% since them.
Here are ONE DOZEN negatives I see in-GDX, and why I feel this-ETF is a sell:
1. Sell Fractals in effect (red rectangle on chart).
2. Alligator jaws opened in tandem with sell Fractals. Alligator feeding in down-trend. THIS IS YOUR DIRECTIONAL COMPASS.
3. Chop indicator (under chart) is well above the 38.2 shaded area. This indicates a ZERO trend and, at best, sloppy action with a downward bias.
4. Phase energy (lower top indicator) is heading LOWER. The action is below the zero line. It failed at a rally and is now lower.
5. Momentum (top indicator) is the 5/34 measure, and this is bearish action and is heading lower. Histogram within is also heading lower.
6. Prices are trading UNDER the Ichimoku Cloud . This is a sell signal.
8. Prices are trading below the Ki jun-Sen baseline of the Ichimoku Cloud . This is a sell signal.
9. Prices are trading below the thick red Ichimoku Cloud conversion line. This is a sell signal.
9. The red Ichimoku Cloud conversion line direction is heading lower. This is a sell signal.
10. The Ki jun-Sen baseline of the Ichimoku Cloud direction is heading lower. This is a sell signal.
11. The CHOP ZONE indicator (under chart) is red, indicating a down trend.
12. DMI-(above chart, middle) is showing red (sell) as the dominant force. The DMI-(black line) is flat to down. Note: the DMI-and-CHOP are in sync. NO TREND.
In my opinion-GDX is heading LOWER. I have given you a dozen negative signs as my objective evidence.
Because of the recent sell Fractals and other negative signs, its hard for me to envision GDX-heading into a new up-trend.
As always, good luck to you in all your trades. Don.
ACRE: Double Bottom With Upside Move ?Ares Commercial Real Estate Corporation is a specialty finance company. The Company is focused on directly originating, managing and servicing a portfolio of commercial real estate (CRE) debt-related investments for its own account.
With the slight uptick in interest rates-ACRE has digested previous gains.
There is a double bottom (thick black line beginning August 12th) with a possible upside move.
Please consider the positives in the chart of-ACRE.
1. Buy Fractal (green box).
2. CHOP line (below chart) sinking out of the shaded area, below 38.2, indicating a new TREND.
3. CHOP ZONE, below CHOP, is green, indicating up trend.
4. The alligator, YOUR COMPASS, is feeding in the uptrend.
5. The Ichimoku Cloud (black) base line and (red) conversion line are both rising.
6. Prices are above both of these lines.
7. The three indicators on top are strong. The middle top indicator is-DMI, and the dominant move is green (up) and the black line (trend) is starting to rise. This confirms the CHOP indicator below the chart.
In my opinion, this stock is a strong buy. Good luck to you. Don.

MFI DivergenceUp trend prior to form Head and Shoulder. Tested the neckline (Resistance) for the fourth time. Money Flow Index divergence. Entry: With good price action candlestick. TP: 0.90, SL: 0.97. Trade invalid if breakout with high volume. Last week candlestick was a movement without volume support. 459K compared with 743K (The week before). A nice fibo ratio if you calculate (Just pure coincidence). According to Bill William theory, Blue bar - Market Facilitation Index indicator is up, volume is down. The movement is continuing although the volume has dropped. The trend will soon be reversing.


NZDUSD D (Chart Update): Yet another upside Breakout has failedNumerous times price tried to break out to the upside on the NZDUSD Daily. It has always failed. During the last week of trading the same has happened, price wasn't able to stay above the important resistance area (marked by fractals), instead it went right back into the balance zone. It's possible a new down fractal will form soon, that would be another selling opportunity.

NZDUSD: Daily possibly Ending CorrectionNZDUSD has been in correction on the weekly since August 2015 after a major downtrend unfolded until then. This correction did not run up, instead it moved sideways with the Momentum indicator crossing above 0 on the weekly (indicating a major correction.) The daily chart didn't prove to trade well while this correction has been going on, many breakouts fail in this market phase and the trend trader needs to stay away until the next possible breakout tirggering a new trend shows up.
This could be the case now, after we saw prices trying to breakout of the upper resistance of this weekly sidemove and failed two weeks ago, we saw increasing weakness coming into this market with a new fractal sell signal forming. If price hits the low of that fractal a short position would be triggered and new lows could be possibly. Let's see if that is the one already...

SPX500 4h: Divergence Indicating WeaknessThe SPX500 has been rising ever since the worst start of the year in history. This bullish movement could come to an end now as we don't only see a divergence and prices starting to trade inside of the balance zone on the daily chart.
This four hour chart shows price already tried to break through a fractal and is now sitting just on top of what looks like pretty strong support. As this market keeps trading below the balance zone an eventual break of support is possible, which would end the daily uptrend for now.

Introducing Don's "T R A D E - M A P" Approach: Part 3 Of 5, MOPart 3 of 5. The above chart is a 4 hour time period. The goal of this chart is to confirm, on a shorter term time basis, that the breakout uptrend in Altria Group is valid. Indeed it is. Once again, the elements of Don's "TRADE-MAP" approach are:
1. T : Time and space (Fractals); 2. R : Repeating Cycles; 3. A : Advancing Trend; 4. D : Declining Trend; 5. E : Energy in Phase Forces.
Now the letters in MAP:
6. M : Momentum and Velocity; 7. A : Analysis of Structure; 8. P : Price Performance. There you have it: Don's personal "TRADE-MAP".
One item I must mention. The ideas I present are from a lifetime of reading and listening to others. In other words, I do a lot of bench-marking. I combine what I think are the "best practices" and discipline myself to use them. The combined efforts of some really great technicians are in my work: Bill Williams, Justin Mamis, Jason Stapleton, John Murphy, John Bollinger, Charles-Dow, Robert Precther, Harold McKinley Gartley, Ralph Nelson Elliott, and others too numerous to honor. I do charting simply because I enjoy it. Yours for better trading, Don.

AUDCAD possibly about to break out to UpsideAfter a short breakout has failed on the higher timeframes in Sep 2015, an immediate reversal occured and this FX pair went all the way from 0,92 to 1,02. Ever since it hit that high it retraced, but never went as low as the previous low in Sep 2015. A possible trend continuation could follow if the indicated fractal buy signal is hit. It would mean the break of important resistance and therefore following the move further to the upside is a possiblity.

How I Trend Trade Using Fractals and Moving AveragesUP Fractal = Resistance, buy on breakout
DOWN Fractal = Support, sell on breakout
If Trend gets going, hold on to position until price closes above/below purple line.
Watch for divergences in Momentum indicator vs. price.
Watch for major and minor corrections that could indicate a new entry point or a slowing price.
After a trend is done, prices will always retrace back into the balance zone, marked by the three colored moving averages. As long as it is trading inside of it, stay out of the market.
Once a fractal up or down gets hit after price was breathing in the balance zone, put in a pending order and wait for whatever the market tells you.
Repeat.
Repeat.
Repeat.

Combination Ichimoku Cloud, Pattern, And Alligator View For IWMThe chart above is daily, and is a combination of the Ichimoku Cloud, Pattern Swing Trade, and Alligator systems. There is a bullish and bearish case for IWM. The pattern swing trade shows a bearish bat the the end of impulse leg D (Fibonacci .618). Yet, if you look to the far right on the chart (bright green up arrow), the Ichimoku Ki jun-Sen (baseline) just went positive, rising above the cloud. (This may not be a positive because this is a lagging indicator). The red dotted line is the teeth in the Alligator system, and this is flat, as is the solid red line above it (the conversion line in the Ichimoku Cloud system). The recent price action in IWM has traded below the Ichimoku Cloud conversion line 6 times in the past three weeks, which I view as a negative. The scattered up and down green/ red arrows are fractals (this system created by Bill Williams in 1995). A rule of thumb is "do not accept a buy fractal if it is below the alligator's teeth" (dotted red line), and "do not accept a sell fractal if it is above the alligator's teeth". There is a sell fractal just to the left of the bright green arrow at approximately $101 on the chart. The three indicators below the chart are divided: RSI (top) is overbought; Vortex (middle) slightly positive with green over red, but sagging; CCI (lower) extreme over-bought). I see the signs of IWM trend reversal (to the downside) developing. One other negative not on the chart shown, IWM is still under-performing the S&P 500. It is 14% off its high of $129.10. I do own RWM, the inverse of IWM, so we will see. I hope this has been informative and helpful. Yours for better trading, Don.

Short ETH/BTC due to failed breakoutWe couldn't break 300 and the reason is clear. Volume is low af.
If that was leg one of a new wave it was hella weak. Where are all the buyers at? Waiting or shorting.
The Eye of Sauron looks down upon us and forces us into the nether worlds of the 200 zone. When we reach that level buyers will rush like mad at those prices. then we get exhausted, but people saw what happened on the first leg and they want in on the party and so we get another drive, etc, etc. It's quite simple. But there are rules to these streets. One cannot simply call an irregular elliott wave retracement a new rally when it is no such thing at all.

EURUSD GOES UP
WE have a double top, cant cross the 0.168 fibo level and the alligator start to open up... BUY

EURUSD SHORTIntro
Its been a long time since i posted something here, i was under the impression that posting here was like a game of prediction, as if you can have bragging rights if your prediction went ok. But at the back of my mind if i where a good trader why would i post my trades here what will i get. if not for the feeling of self accomplishment. Sharing knowledge maybe!
Then i learned that the mere impulse of thinking as such, mixed my trade with emotion and clouds my thinking. I also learned that predicting what the market will do will not be good for my business, instead what i should learn is to know what the market wants to do and react on that accordingly.
After three years of trading im still a novice, it sad but the only way to address that is to read up on books, do research to make my trades my own. For newbies like me i suggest you do the same thing and read up, there is no shortcut here there really is a learning curb, and there is no Holy Grail on trading.
Chart
On the screen are lots of indicators i mean lots. I know that my screen is cluttered but this is the result of all my studies and failure. Its a combination of "Harmonic Trading by Scoth Carney" "Fractal Trading by Bill Williams" "Triple Screen Trading by Alex Elder" Three of Moving Averages,MACD,Stochastic,Impulse. If you dont know these people you are not researching enough for your business. In summary Im short on this trade once the impulse system turns red. this not a recommendation for you to do the same.
Im still a novice at these considered a smuck in the trading world made considerable amount donations to the market but now standing my ground.
Learn your trades own your trades.

NZDUSD Could test 0.7175Trying to simplify trading and keeping it clean.
1. Price was trending lower in a falling equidistant channel. Support/Resistance identified at 0.7239 - 0.7175
2. To current lows, strong divergence to the AO
3. Y'day price was a doji so a possible bullish close today could further strengthen the bullish bias
---------------------
Trigger: Waiting for the AO to either cross the 0-line OR waiting for a classic saucer buy signal to initiate the trade. Initial stops at recent lows.
Risk: Initial risk at minor identified resistance of 0.6684. If this is cleared, then the trade should be quite a profitable one.

Pound Long1. Pound is a long on the weekly time frame
2. It has been making higher swing lows
3. It is in a squeeze situation on the Alley gator
4. Buy Stop @ 1.5691 Fractal
5. Set stop under blue alley-gator line when trade is filled.
6. This trade based on daily time frame
7. In buy zone on both oscillators

DAX30 - Ready, Set, Go?Dear Traders,
there has been happening a lot since my last DAX30 analysis eleven days ago. I have closed my short positions with some profits and kept quite until the beginning of this week, waiting to bring my long trades into the race.
If you remember, I revised my initial expectation from 'call' to 'put' as I expected the correction not be finished - or better, it was just about to start. The situation changed a bit which meant the (blue) 4 wasn't complete at this stage and had to be fully developed before we could look at any DAX30 long ideas.
The Question Now Is
Was this correction enough to complete the (blue) 4? There is a good chance that this is the case as the (Elliot wave) fits perfectly - and so do the indicators. But, there is still enough room for the DAX30 to correct. If you remember, I was initially talking about the area around 11,500.
It's A Matter Of Sink Or Swim
To put it in a nutshell, the German DAX30 has a perfect chance to take it from here, marching up, direction 13,000. However, if the latest (yellow) 1 gets touched (~ 11,803) the bullish scenario is off the table - for now. Everything above that is perfectly fine.
Bottom Line
In terms of trading this is a no-brainer. The chance/risk ratio is outstanding, if you are looking for 11,800 as a potential SL and 13,200 for a target.
I take the risk and give it a shot. Therefore I have opened a long position in all my public and private accounts.
Godspeed!
