DOGE/USDT 6h (Binance Fut) Parallel channel on mid-line supportTA: Dogecoin is quite volatile lately, that could be a great opportunity to catch next pump.
Current Price= 0.003393
Buy Entry= 0.003403 - 0.003333
Take Profit= 0.003543 | 0.003686 | 0.003877
Stop Loss= 0.003193
Risk/Reward= 1:1 | 1:1.82 | 1:2.91
Expected Profit= +26.00% | +47.20% | +75.55%
Possible Loss= -26.00%
Fib. Retracement= 0.618 | 0.786 | 1
Margin Leverage= 5x
Estimated Gain-time= 480h
Binancefutures


Bitcoin crossed it's main resistance thus making new S/RHello Everyone,
As I said in my previous analysis that bitcoin either will do a correction downwards which it did but not that much which I expected so after doing some correction it crossed its major resistance which was at 11400 levels ( I plotted parallel trendline in that area ) and I also drew some small uptrend channels which bitcoin has tested before and I was sure it will test those channels again if it goes uptrend or makes new highs. I would also talk about oscillators and momentum indicators which diverged before which is mainly short signal but according to me momentum indicators can be an unreliable indication as of now you have seen MACD has diverged recently but the price did not come down a lot of people were hoping about so if any of you guys are using oscillators or momentum indicators to short/long positions, I would strongly suggest relying on stop loss because high leverage can cause capital loss, you guys are only trading on futures.
`````````````````````````````````````````````````````````````````````````````````````````````````````````````````````````````````````````````````````
Yesterday Bitcoin made a new height so I drew a parallel resistance from that point and other parallel supports and resistances as you can see in the chart. Support and resistances were good nevertheless as I mentioned in my previous idea support and resistance become opposite once they are violated. Channel line can be of huge help in the future in determining trends and making internal supports and resistances which the price has experienced before so as you people can see in the chart I drew some uptrend channel lines which are being effective now. The price currently is testing the second channel I made and it has tried to cross it several times but failed even now the price is at the resistance level of the uptrend channel and if it crosses it and closes above the channel it will move from the second channel to the first channel that I made whos resistance is uneven because it has only touched once by the previous peak and never again so it can make a new high again thus making it a persistent resistance or it can bounce back from the resistance of the second channel that I made thus giving us a short sign with a stop loss just 3% up from the resistance and first take profit which will be at the middle of the channel and another 2 take profit of 25% which will be plotted mentally.
`````````````````````````````````````````````````````````````````````````````````````````````````````````````````````````````````````````````````````
Ichimoku Components -
Kijun - REDLINE
Tenken - BLUELINE
Senkou A - Upper Border of cloud when the trend is bullish and Lower border of cloud when the trend is bearish
Senkou B - Upper Border of cloud when the trend is bearish and Lower border of cloud when the trend is bullish
Chikou - The green color shadow of price moving 26 period back
`````````````````````````````````````````````````````````````````````````````````````````````````````````````````````````````````````````````````````
According to the ICHIMOKU trading system, the price still is in a bullish trend and it has 4 supports to cross so if it crosses Kijun that means it has crossed two supports which are Tenken and Kijun (that has not happened yet) so there could be 2 scenarios there would be a dump and price would cross Kijun when Tenken is above it thus giving us a weak signal of short or it would correct itself slowly and then there would be a crossover of Tenken and Kijun in which Kijun will be above the Tenken so it will give us a short signal and stop-loss would be at 3% higher than Kijun that will be also considered as a weak short signal because the price would be above the Kumo cloud and if there is any other activity of ICHIMOKU trading system I will update the idea automatically.
`````````````````````````````````````````````````````````````````````````````````````````````````````````````````````````````````````````````````````
If you like my idea do give me a follow and if am wrong at some point in this idea, tell me comments :)

Bitcoin going to make some correction or will make new highs XOHello Everyone,
We have seen a lot of activity of Bitcoin because it was deemed as real money by DC laws so masses purchased bitcoin and are now holding because it is digital gold (named) so my analysis is Bitcoin is in my top resistance and support area. The major resistance is at 11391 area and major support is at 9600 area but there are many internal supports that bitcoin needs to cross if it is planning to go to that area. A correction is a must after this massive pump according to supply and demand we have seen a lot of demand this week so there must be a correction.
Each time when previous resistance has been tested uptrend is in a critical phase, failure to cross the previous peak or unable to bounce the near support usually means that the existing trend is changing. Now bitcoin has made a new high that is 11394 if it fails to cross that resistance then surely it will retrace the path, nearest support is at 10832 which has tried to cross 3-4 times but failed to cross it thus giving us a good support area. An individual can take a long order whenever the price retests that support if the candle on 1 hour succeeds crossing that resistance, do not go for long order if the candle is unable to cross that support and makes a wig that exactly touches or is near support wait for the next candle if next candle crosses the previous candle high I would go long there with a stop loss that will be 3% down from support. Please do examine MACD and RSI before going for long I suggest this for every order MACD and RSI plays an important role in telling us about demand and supply so that can be of great help.
---------------------------------------------------------------------------------------------------------------------------------------------------------------------------------------------------------------------
Ichimoku Components -
Kijun - REDLINE
Tenken - BLUELINE
Senkou A - Upper Border of cloud when the trend is bullish and Lower border of cloud when the trend is bearish
Senkou B - Upper Border of cloud when the trend is bearish and Lower border of cloud when the trend is bullish
Chikou - The green color shadow of price moving 26 period back
.....................................................................................................................................................................................................................
Ichimoku also gives a great idea that is the price is still bullish there are many signs of that like Kijun and Tenken crossover that happened few hours ago and still in motion, they are parallel that means the price is consolidation but major signs are still bullish. Another sign I want to talk about is the price is still above Kijun which means bullish until and unless it crosse the Kijun and closes below as well as the Kumo cloud, Price is above Kumo cloud which means the price is bullish and has 4 supports to cross which are TENKEN, KIJUN, SENKOU A and SENKOU B. Crossover of Senkou A and Senkou B is a little bit troubling me because Senkou B is above Senkou A which indicates us of a bearish sign but still bullish signs are a lot more than bearish signs so we can say that price is in the uptrend. Chikou line has also crossed the previous price line so that also means that trend is bullish.
If you have any thoughts regarding this idea or if I am wrong at any point, do tell me in comments :)

If Atom does not break this support its going to MOON If Atom strikes Support which is around 2.9, it will jump to internal trendline which is currently resistance and if it breaks that too, chances are it will hit the main resistance

BTC Gonna Test Magnet Level Hello Dear Users and Visitors, As you Can See On Chart the price Reach the top of the ascending channel.
Resistant: 10950 $ - 11000$
Support: 10450 $
Magnet Level now is very Interesting. Be careful For Your Short Position, BTC now is Very Volatile.

BNB/USDT 12h (Binance Fut) Parallel channel break-outFA: Binance Completes 12th Quarterly BNB Burn last week.
TA: Binance Coin is quite bullish after that acending channel break-out, don't look like a fake-out this time.
Current Price= 18.947
Sell Entry= 19.056 - 18.656
Take Profit= 19.858 | 20.282 | 20.282
Stop Loss= 17.854
Risk/Reward= 1:1 | 1:1.42 | 1:2.05
Expected Profit= +26.55% | +37.80% | +54.40%
Possible Loss= -26.55%
Fib. Retracement= 1.272 | 1.414 | 1.618
Margin Leverage= 5x
Estimated Gain-time= 720h

ETC/USDT 4h (Binance Fut) Descending channel break-outTA: Ethereum Classic is looking quite bullish on LTF after that parallel channel break-out and retest.
I'm still holding a long on ETC/BTC pair so let's scalp it in Futures too:
Current Price= 6.129
Buy Entry= 6.138 - 6.028
Take Profit= 6.357 | 6.464 | 6.615
Stop Loss= 5.799
Risk/Reward= 1:1 | 1:1.38 | 1:1.92
Expected Profit= +27.54% | +38.10% | +53.04%
Possible Loss= -27.54%
Fib. Retracement= 0.5 |0.618 | 0.786
Margin Leverage= 6x
Estimated Gain-time= 360h

Short Term Long Trend Interference 4 Hour BINANCE:BTCUSDT , price crossed the downtrend channel and short uptrend has started. I'm just waiting for MACD crossover and RSI is still overbought. I'm Short at 9220 and my Liquidity is at 9800. It can go to 9000-9100 area where I want to EXIT so badly. There are many other or most of the traders and technical analyzers on telegram and discord are indicating that a big dump is coming and BINANCE:BTCUSDT will drop to 6000-8000 area but it can take weeks or months. I guess only thing that i can do is to wait do share your thoughts in comments and do I need to increase my liquidity by adding more funds to my wallet, please do comment and tell me.

Potential Long entry in BAT buying at the entry zone, selling at the green lines, stop around the red line.
Things to watch:
1- BTC movements if it dumps, this is invalid.
2- if the price reaches the targets, before going to entry zone this is invalid.

BTC/USDT 12H (Binance Fut) Ascending channel retest & breakdownTA: Bitcoin is due for a correction, maybe only a small one but I'm expecting a big one this time if support breaks down.
Current Price= 9074.13
Buy Entry= 9119.00 - 9219.00
Take Profit= 8912.00 | 8506.50 | 7976.80
Stop Loss= 9426.00
Risk/Reward= 1:1 | 1:2.58 | 1:4.64
Expected Profit= 28.00% | 72.30% | 130.00%
Possible Loss= -28.00%
Fib. Retracement= 0.618 | 0.786 | 1
Margin Leverage= 10x
Estimated Gain-time= 480h

Has LTC finally seen the light?LTCUSDT
LTCUSDT is an interesting one for me at the moment. Although we’ve been in a downtrend for some time, we have mostly remained above the 50% channel line other than a few large dumps along the way. This is usually a bullish sign.
The other thing to note is that we are currently trending sideways after a long bearish period - this also usually indicates a change in momentum could be on it’s way.
If we can get a break above resistance that also closes us outside of this channel, creating a HH, I will consider opening a long as we have already created a HL so if this follows a HH this will give me confidence that we have found the bottom for now.

Will LINK be the alt that'll link us to the moon? LINKUSDT
Loving what I’m seeing on LINK atm. There could potentially be a huge reversal coming after such a long bullish run.
We have hit a level of major resistance at LINKs ATH resulting in a double top. I can still see bullish momentum so I don’t feel the bulls are tired just yet, some large bodied green candles show me they’re still around and still fighting. I want to see them starting to get exhausted with smaller candles and a bearish engulfing.
The long wicks on some of the red candles at this area show me there is a fight going on to bring the price down but in this momentum, who will win is still undecided.
I’m not sure I would long if we were to break above residence as I wouldn’t have previous structure to guide me however, if we were to break support and retest, creating and LH followed by a LL, then I would definitely be opening up shorts to ride this baby down!
Take profit areas would be at previous structure around 4.5354, 4.332 and final at supply around 4.2. This would be a multiple take profit trade for me.

DASH making a DASH back to the starting line??DASHUSDT
I’m seeing a potential further drop for DASHUSDT here.
We have failed to break above the 50 line within the current downtrend channel and are currently sitting around support.
What concerns me is that this level has often lead to a change in direction multiple times in the past and lead to a fairly decent long run, however, these runs have been getting shorter and short every time. So in that case, has dash made it’s final dash…?
The long out of this zone in the past has been fairly instant but the moment we haven’t seen any bulls come in to save the day within the last 24 hours so this leads me to maintain a bearish bias on this one.
I want to see a break of support and retest which clear the wicks to the left before I open up a short back to previous structure for a possible 8% market move.

Possible long opportunity on ATOMUSDT in the near future ATOMUSDT
I see market structure starting to change which may present a long opportunity soon.
We are currently breaking resistance. I won’t be longing from the break and retest here because I don't like the messy structure to the left. There are huge wicks there showing this is an area of volatility.
I want to clear this first before I would consider entering a long, at the same time creating another higher low.
If we can get a break above 2.850 and a retest of that level with some nice solid candles, I will consider opening a long to the previous high.
Stop loss may change dependant on the new structure created before the point of entry.

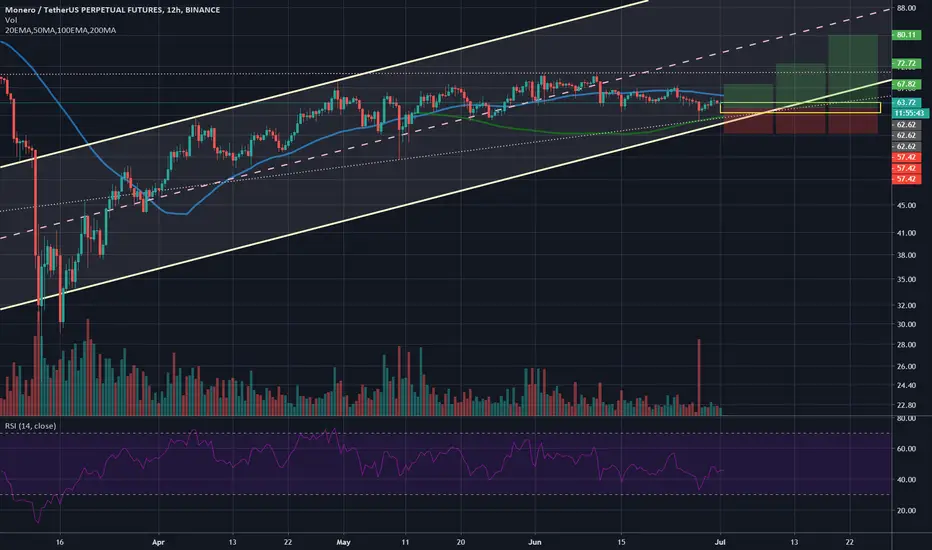
XRM/USDT 12H (Binance Fut.) Ascending channel and triangleTA: Monero bounced on 200MA (green one) acting as support and forming an ascending triangle (bullish pattern).
Also I can see a big parallel channel holding the up-trend, I hope it will keep this way!
Current Price= 63.72
Buy Entry= 63.72 - 62.32
Take Profit= 67.82 | 72.72 | 80.11
Stop Loss= 58.22
Risk/Reward= 1:1 | 1:1.94 | 1:3.36
Expected Profit= 24.90% | 48.39% | 83.79%
Possible Loss= -24.90%
Fib. Retracement= 0.786 | 1.272 | 2
Margin Leverage= 3x
Estimated Gain-time= 720h
ETC/USDT 8H (Binance Fut.) Pennant on support, back to channelTA: Ethereum Classic would probably retest the ascending parallel channel if pennant manage to hold and break up.
Current Price= 6.286
Buy Entry= 6.310 - 6.220
Take Profit= 6.591 | 6.969 | 7.237
Stop Loss= 5.939
Risk/Reward= 1:1 | 1:2.16 | 1:2.98
Expected Profit= 26.00% | 56.20% | 77.55%
Possible Loss= -26.00%
Fib. Retracement= 0.382 | 0.618 | 0.786
Margin Leverage= 5x
Estimated Gain-time= 360h

BCH/USDT 12H (Binance Fut.) Channel on support & falling wedgeTA: Bitcoin Cash is holding that support, and as long as the BTC pair is looking bullish, I'm expecting a big growth.
Also, we can see that the falling wedge broke-out then pulled back, this is another positive sign.
Current Price= 232.86
Buy Entry= 231.80 - 226.30
Take Profit= 269.95 | 313.53 | 357.11
Stop Loss= 208.60
Risk/Reward= 1:2 | 1:4.13 | 1:6.26
Expected Profit= 53.58% | 110.64% | 167.73
Possible Loss= -26.79%
Fib. Retracement= 0.382 | 0.5 | 0.618
Margin Leverage= 3x
Estimated Gain-time= 720h

Bitcoin (BTCUSD) long.All description on the chart.
Please, don't forget to like and follow.
Thank you.

BTC/USDT 4H (Binance Fut.) Rising wedge & midline channel retestBitcoin is facing strong resistance right now and is showing some clear bearish pattern.
I'm expecting price to continue the downtrend towards channel support if doesn't break back upwards.
Current Price= 9435.00
Sell Entry= 9400.00 - 9498.00
Take Profit= 9044.64 | 8706.24 | 8379.50
Stop Loss= 9612.50
Risk/Reward= 1:2.58 | 1:4.54 | 1:6.54
Expected Profit= 64.20% | 117.90% | 198.00%
Possible Loss= -33.90%
Fib. Retracement= 0.786 | 1.272 | 2
Margin Leverage= 15x
Estimated Gain-time= 240h

NEO/USDT 4H (Binance Fut.) Ascending channel holding supportFA: Neo mainnet 3.0 is planned before end of year (Q4 2020) and is one of the oldest staking coin generating GAS (2% APR or so).
TA: Right now channel support is holding, I'm expecting price action to bounce up towards mid-line if we're lucky and patient enough.
Current Price= 11.287
Sell Entry= 11.101 - 11.337
Take Profit= 12.151 | 12.751 | 13.771
Stop Loss= 10.588
Risk/Reward= 1:1.5 | 1:2.46 | 1:4.08
Expected Profit= 50.16% | 82.26% | 136.80%
Possible Loss= -33.48%
Fib. Retracement= 0.5 | 0.786 | 1.272
Margin Leverage= 6x
Estimated Gain-time= 240h

ADA/USDT 4H (Binance Fut.) Ascending channel facing resistanceCardano has grown parabolic after breaking that bullish triangle and is at resistance again, like VeChain.
We could revisit the mid-line of the parallel channel before continue the uptrend, or maybe even retest the Trendline.
Current Price= 0.08582
Sell Entry= 0.08572 - 0.08812
Take Profit= 0.08097 | 0.07512 | 0.06568
Stop Loss= 0.09287
Risk/Reward= 1:1 | 1:1.98 | 1:3.57
Expected Profit= 27.40% | 54.32% | 97.76%
Possible Loss= -27.40%
Fib. Retracement= 0.236 | 0.382 | 0.618
Margin Leverage= 4x
Estimated Gain-time= 240h

VET/USDT 4H (Binance Fut.) Ascending channel facing resistanceVeChain has grown parabolic after breaking that bullish triangle and is at resistance again.
I had to redrew a bit the parallel channel but I still think it's time for retracement now.
Current Price= 0.007462
Buy Entry= 0.007450 - 0.007694
Take Profit= 0.006882 | 0.006349 | 0.005488
Stop Loss= 0.008262
Risk/Reward= 1:1 | 1:1.77 | 1:3.02
Expected Profit= 27.33% | 48.45% | 82.56%
Possible Loss= -27.33%
Fib. Retracement= 0.236 | 0.382 | 0.618
Margin Leverage= 3x
Estimated Gain-time= 240h
