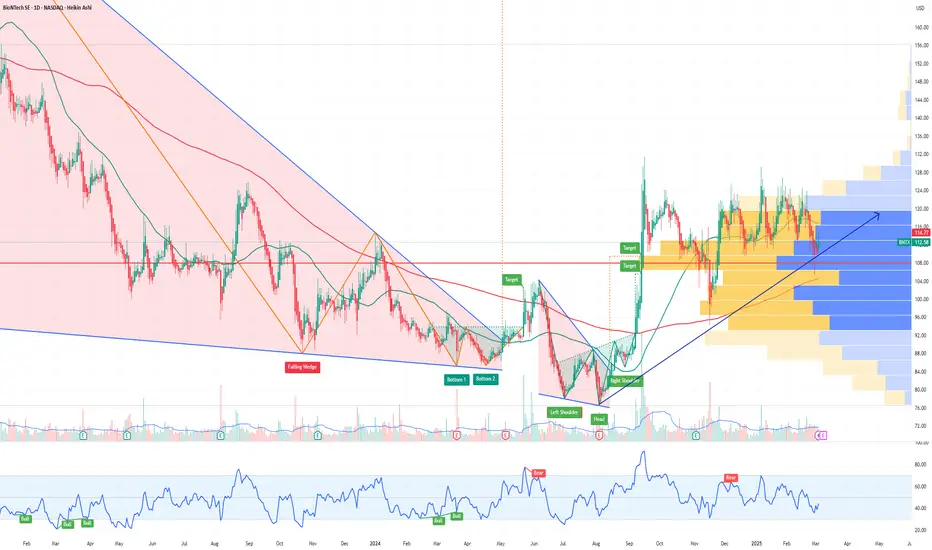
BNTX BioN Tech Options Ahead of EarningsAnalyzing the options chain and the chart patterns of BNTX BioN Tech prior to the earnings report this week,
I would consider purchasing the $115usd strike price Calls with
an expiration date of 2025-9-19,
for a premium of approximately $17.40.
If these options prove to be profitable prior to the earnings release, I would sell at least half of them.
Biontech
Accumulation complete, re-rating starts now ?There is some very bullish price action being observed in Biontech. This could mean a catalyst for all the vaccine stocks could be coming soon.

BioNTech prepping for major upside to 138Inv Head and Shoulders seems to be forming on BioNTech company listed on the Nasdaq.
We might have a consolidation period for the final shoulder to form before it breaks up and out of it.
There is also a solid uptrend, which the price continues to make higher lows.
With the price staying above the 200MA will help the bullish momentum send it to the first target of $138.36.
Let's see how it plays out as it's still a bit early before jumping in.

BionTech Fastly Approaching Major Resistance, Will we Break?Hi Guys, this is a Technical Analysis on BionTech (BNTX) on the 3 Day Timeframe.
We are currently approaching a MAJOR RESISTANCE Trendline.
This Trend started from the TOP in 08/2021.
Everytime we've interacted with it in the past, we've been REJECTED.
Will we get Rejected again?
Well, we've had 3 touch points already. In trendline theory, it states that atleast 3 touches are required before a trendline is weak enough to break through. So, it is possible that a break can occur.
With risk of new variants, hospitalizations of COVID increasing and a push of government to get people to get boosters, this could be a chance for Trend change to UPSIDE for BNTX.
BUT just looking at it in a pure TA lens, i wouldn't just start buying now.
I would wait for a break above the Trendline and CONFIRMATION above it.
Also with the break, note that VOLUME should be spiking and increasing.
We should not see a DECLINE in Volume as we break through.
That can be signs of a FAKEOUT.
We are also reaching some Resistance from a Support line turned Resistance line.
Now lets look at our indicators for more evidence.
RSI -> We've had the Lowest RSI reading on May 09,2023 EVER in BNTX history. This could be a catalyst for more buying pressure and a trend change. We also broke above RSI Red Resistance line.
MACD-> A momentum indicator, has crossed BULLISH, below the 0 level. If we continue this bullish momentum and the Blue/Orange lines move above the 0 level, this can be inject the well needed momentum for BNTX to increase in price.
STOCH RSI -> Is also in a BUllish cross and it shows that theres plenty of room for momentum to continue.
__________________________________________________________________________________
Thank you for taking the time to read my analysis. Hope it helped keep you informed. Please do support my ideas by boosting, following me and commenting. Thanks again.
Stay tuned for more updates on BNTX in the near future.
If you have any questions, do reach out. Thank you again.
DISCLAIMER: This is not financial advice, i am not a financial advisor. The thoughts expressed in the posts are my opinion and for educational purposes. Do not use my ideas for the basis of your trading strategy, make sure to work out your own strategy and when trading always spend majority of your time on risk management strategy.

Biontech SE ADR, BNTX, $BNTX, #bntxBiontech SE ADR
$130 PREDICTED LIVE
This stock move is called a bounce, rock, algo skate.
Pillar worthy

BioNTech showing a solid entryBNTX is finally concluding a year long descending triangle pattern. I see a low risk entry at $150 and will be buying. Stop loss set at $138.49, risking about 8.5%. If we see a large move upward, I could see the stock retesting both its 200 day moving average (likely at $183) and its next major resistance after that at $295. A potential of nearly 100% profit (not to say its a sure bet or smart to dump huge amounts into the trade without the stop loss...). Fundamentally, the company has a P/E of 3, no debt, and a huge free cash flow to fund its mrna platforms for a lot of other diseases partnering with some of the largest pharma companies in the world. Yet another variant of covid, upward pressure from the 50and100 day MAs, large portions of the world unvaccinated, and president biden contracting the virus could be potential catalysts for a move. If you're looking for a bio tech exposure this is a stock that seems to be set up well. Good luck to all.

BionTech - Financial Health ExcellentThe Statistics say between $182-$253 (1 year)
This Looks like it can Happen in 1 Year.
That will depend on their Progress.
Let's see what will happen in 2023,
but it looks ok to hold for the next 5 Years or more
BioNTech aims to develop the first mRNA-based vaccine for Malaria
prevention with the initiation of a clinical trial by end of 2022
BioNTech is evaluating sustainable mRNA vaccine production capacities in Africa;
the Company’s efforts are supported by the joint convening powers of the World Health Organization (WHO)
and the Africa Centers for Disease Control and Prevention (Africa CDC)
BioNTech’s Malaria project is part of the ‘eradicate malaria’ initiative,
led by the kENUP Foundation, to accelerate the eradication of Malaria
Disclaimer:
Just my Idea! Find your Trading Ideas and learn and study more!

Free Fallinnnnn $bntx has NO volume support until green box 24% lower... #bntx
——————————————————————————————
Top 10 trading tips:
1. DO NOT FOMO into a trade. Let it come to you. Don’t force it.
2. Find a strategy that works for you and be consistent. Operate like a machine and less like the wind.
3. Let your winners run and cut your losers short.
4. You will not win every trade, but if you are disciplined with great RM you don't need to be right all the time to win!
5. Before you enter a trade, know your target AND your exit strategy.
6. When you are up, you can use a trailing stop or trim off some profit at a logical resistance point with a stop loss at breakeven.
7. Set your trade parameters up front so you keep your self accountable and remove emotions from the equation. (stop loss, take profit levels, etc)
8. Don't fight the trend. The trend is your friend.
9. Don’t enter a trade based on one indicator.
10. Horizontals > Diagonals
Please note:
- This is not financial advice.
- I do not take every trade I post.
- Never trade off of someone else's chart until you DYOR!


BNTX Earnings BreakBNTX has broken out nicely upon earnings
it also aligns nicely with the pattern price is portraying which is an ascending scallop, commonly considered a bullish pattern

BNTX LONG SETUPWe just finished Elliot wave 1-5 and ABC pattern, already bounced off of a strong demand zone and 71.8% fib zone we can enter right now but our R/R ratio is 1.7 since we missed first bounce, what we are looking for is a retrace to our entry point ant 71.8% fib zone and enter there. Also market made a gap at 182 zone which has to be filled. Also a gap at 325 zone, which also needs to be filled.
AROON: On a daily chart AROON already shows bullish momentum (Orange line above blue one)
Bollinger band: we already bounced off of a bottom Bollinger band which indicates bullish direction movement.
Entry:119 (We can enter right now but for better R/R I would suggest to wait for a retest at the entry zone, though it might not do that and we might miss a trade)
Invalidation: 79 ( Just below Demand zone )
Target 1: 292 (50% FIB ZONE)
Target 2: 325 (Second gap zone)
Ratio if we wait for retest: 4.38
Ratio if we enter right now: 1.75

BNTX still could be profitable!Enter after breaking the trendline.
Even if the end of the epidemic has a big impact on the price, it is still possible enter a long position and be a winner!

Biontech Analysis 22.12.2021Hello Traders,
welcome to this free and educational analysis.
I am going to explain where I think this asset is going to go over the next few days and weeks and where I would look for trading opportunities.
If you have any questions or suggestions which asset I should analyse tomorrow, please leave a comment below.
I will personally reply to every single comment!
If you enjoyed this analysis, I would definitely appreciate it, if you smash that like button and maybe consider following my channel.
Thank you for watching and I will see you tomorrow!

BNTX LONG +5, +30 +150 % channelI will buy Biontech after breaking through the turquoise bold line. In doing so, I will set a short stop lose at 0.4% below this line and will raise it over time. Next, I plan to buy after the next thin turquoise line is broken, if the indicators favor buying.
This is not a financial recommendation.
Take care.

$BNTX BioNTech SE LONG Trade Setup$BNTX BioNTech got wrecked since its August high and lost over 50% of its value.
BNTX is at it's 200 day moving average, if that holds as support, it is a very nice swingtrade setup.
With Covid numbers rising all across the world and booster vaccines for everybody getting more and more a thing,
BNTX could possibly go on another bullrun cycle.
Approach with caution though, that stock can get wild in both directions.

potential bull run to the Q3 earningsThe news are great, the fundamentals better than ever, but the stock is dropping.
WHY?
The big reason is, that big money wants to buy your share before the next bull run.
Therefore they try to push the price into liquidity zones where a lot of Stop/Losses are triggered.
250€ and 200€ are important Fibonacci targets which act like magnets.
Bull Case:
These are the current support zones.
If we assume that we have a finished Elliott Wave, than 250€ could be a support with the 0.618 Fibonacci Retracment.
This is the current Elliott Wave count, eventhough it's not quite perfect. Ignoring some minor flaws, it's still intact.
If we do a normal extention than we could have a first target nearby 600€ (700$) and 800€ (903$) for the long term.
(bear in mind that there could be an overthrow due to the hype in a parabolic movement)
Are 600€ even possible?
Fundamentally, Yes. Technically, Yes.
We had a 144% gain on the last run to the Q2 earnings which we need now for a 600€ target.
What are the risk?
If the Elliott Wave isn't correct, than we could drop even further to the bigger correction nearby 200€.
The current sentiment is extremely cautious due to the Evergrand situation. It's all about timing now if we hit the perfekt window.
PS: I'm just drawing lines. These charts are extremely speculativ. Do your own due dilligence!

BNTX Daily TimeframeSNIPER STRATEGY
This magical strategy works like a clock on almost any charts
Although I have to say it can’t predict pullbacks, so I do not suggest this strategy for leverage trading.
It will not give you the whole wave like any other strategy out there but it will give you huge part of the wave.
The best timeframe for this strategy is Daily, Weekly and Monthly however it can work any timeframe above three minutes.
Start believing in this strategy because it will reward believers with huge profit.
There is a lot more about this strategy.
It can predict and also it can give you almost exact buy or sell time on the spot.
I am developing it even more so stay tuned and start to follow me for more signals and forecasts.

Biontech with a short-term target of 415$ ~ 350€After the last ATH, Biontech corrected quite swiftly with up to -31% on the swing low.
Let's analyze where we are going most likely to trend next:
First look at the bigger scope:
Lower time frame:
Wave analysis:
Targets:
What will happen afterwards?

Biontech with a target of 225€ for JuneBiontech had a run of 135% from April to May but also tanked up to -35% in a short period of time due to the Biden patent waive statement.
Nevertheless, the FUD is over, we are still in a bullish momentum and the fundamentals are looking better than ever.
Bear in mind, I'm drawing only charts here, eventhough my bullish forecast is also backed by the earning reports of Pfizer and Biontech itself. I won't post any numbers or calculations. Everyone has to do its own due dilligence. All I can say is, that the stock is undervalued at this prices currently.
My long term targets are also higher than 225€. But for now I go with 225€ for early June. I also think that the price will leap up from quarter reports to quarter reports.
To the chart:
After the big -35% drop we had a real strong buy back, which is showing still a bullish momentum.
Currently, we are forming a bullish pennant. If we measure the height of it and project it of a break out, we'll get a target nearby. 225€.
The yellow, orange and red wave are messured wave extentions which are all targeting the same price range nearby 225€.
We have not many resistances ahead of us currently. There is the last ATH of 185€ and at the same price range, the median line of the parallel channel. Breaking above it, would head us direclty to the upper boundary of the parallel channel at 225€.
Risk:
Forecasting a price target to a specific date is higly speculative and there is a high likelihood that I will be wrong.
The stock price is highly manipulated due to the overall sentiment and external news.
Eventhough the fundamentals are bullish, we could have a longer period of sidewards movement. That would change the outcome of the predicted target.
Do your own due dilligence!

Breakout if it holds above 130.As you can see from the chart, the RSI is oversold, which means one thing. Breakout season! Now you have heard me say this all the time but a breakout is coming! You can see on every time the RSI has oversold, it has led to all-time highs or breakouts of their patterns. Brace yourself because i bet we are gonna breakout either this month or March and if it breaks below, expect to see support levels at 128,126 and 123. Warning! I am not a financial adviser and take this with a grain of salt. Happy trading!


Pfizer Pfizer and BioNTech companies have offered to supply 50 million doses of their COVID-19 vaccine to Africa for healthcare workers. The vaccine will be delivered in batches from March to the end of 2021.
Meanwhile, Pfizer had broken through the downtrend resistance line and then tested it. The price moves in an ascending channel and the most pleasant entry point is 36.6 if you know what I mean.
BioNTech
Best regards EXCAVO

BIONTECH ELLIOTT WAVE COUNTI wish to share my ELLIOTTWAVE count on BNTX. Impulsive wave (3) can be expected right after the completion of the inner correction (wave 2), currently at the the ascending support zone.
