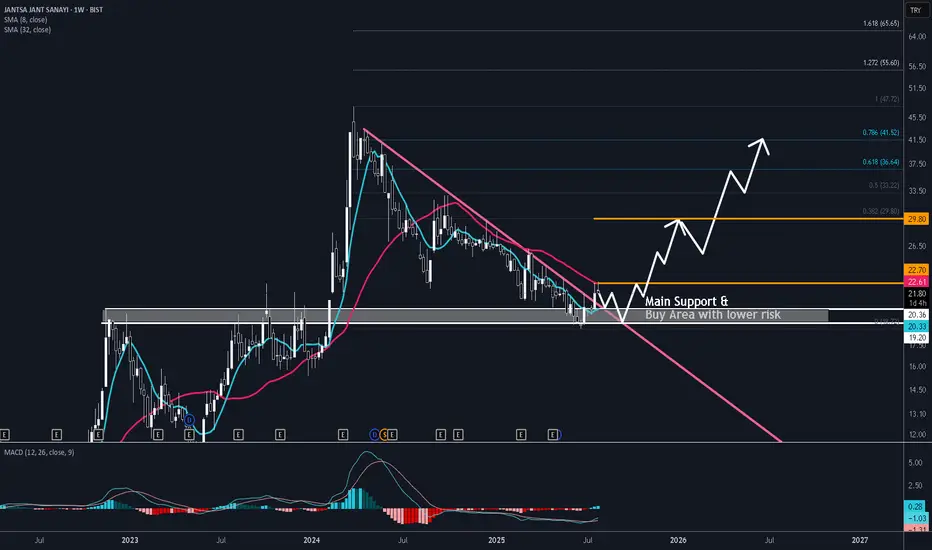
MID-TERM LONG OPPORTUNITY FOR JANTSAs the descending trend was broken out after 16 months, new bullish move is possible for JANTS. There may be ranging price for a while but 19 TL will be a strong support and the stop loss should be set to below 19 TL weekly closure. I believe every downward move to 19-20 TL will be a buy opportunity with lower risk. As this is mid term perspective, 10% loss in possible if the stop loss is triggered. Past performance and win ratio of weekly MACD in JANTS look supportive in this long trade.
Bist100
Preparing for price correctionThe previous scenario is still valid, except that the price correction is taking time and is turning into a diametric.
We are currently in wave-(f) of the diametric
Good luck
NEoWave Chart

High Risk/reward Ratio for ODAS Long TradeI believe ODAS has not much time for breakout. Stop level should be weekly closure below 4.5 TL which is the testing area of double bottom. Take Profit should be set to fibonacci level 8TL.

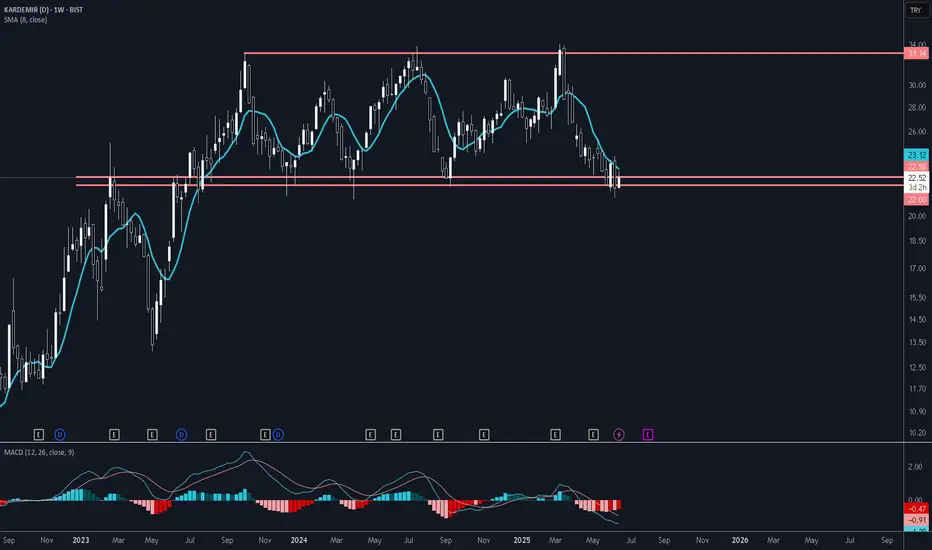
Low Risk for KRDMD Long TradeAs we are close to the bottom line of the horizontal band, long trade is my suggestion in KRDMD. As the stop level would be weekly closure below 22 TL, there is very high risk/reward ratio. I see 25-30% profit is possible if we set the TP as fibonacci 0.618.
Get ready for a 20-25% price drop
The bearish scenario for the BIST 100 index remains valid. It seems that the next downward wave will begin after the formation of the contracting triangle.
Good luck
NEoWave Chart

Will BIST100 beat inflation?BIST100, which has been trending horizontally and falling for a long time, I think it can rise from here and the final rise phase will come. It is too early to say this before the new ATH comes, but I think the 10.9k region is the decision point. When it stays above it, after a move to the 11.8 region, the price should be watched carefully and be cautious. It will look like second BTC 69k ath. So in these times, I think it would be more logical to proceed with a shorter hit and run.

OBASE is BULLISH BIST:OBASE
Strong breakout to the upside from a key level on HTF (1D),
bullish flag on LTF (1–4h),
EMA 20–50 bullish crossover + SMA 200 breakout to the upside.
I'm seeing a 1:7 RRR.
2D ATR stop loss: 29.60 TL
Take profit: 55.30 TL

What to expect from bis on a downward breakIn USDTRY weakly graphic of BIST100 index as it is shown, if the index break down the recent head and shoulders resistance level it may easily go to 150 in USDTRY basis.

"BIST100: Triangle Signals 20-25% Drop"BIST100 (XU100)
In the monthly Cash Data, we see that a Reverse Neutral Triangle has formed and the post-pattern movement (the downward movement after wave-(e)) has also confirmed it and it seems that BIST100 is preparing for at least a 20-25% correction.
If the beginning of wave-(b) is broken, i.e. the number 7189, the correction of this index can continue to 5705.

Technical Analysis of BIST100 Index: Examining Trends and PriceIn this technical analysis, we have examined the Istanbul Stock Exchange Index (BIST100) with a special focus on trend lines and price channels. By precisely drawing trend lines, price channels, and linear patterns, key support and resistance levels have been identified. This analysis, using a simple approach without complex tools, provides investors with a clear perspective on the potential future movement of the BIST100 index in the near future.

xu100XU100 is in contact with the upper resistance of the wedge it entered in December 10. I think it will decline to the lower support, but the target is to return to the 11,000 level with the wedge break.

Narrowing deviations ---> increasing expectancy (close @10.000)
Navigating around white lines: bad idea to think about bearish market
Slowing pace of weekly gains: good idea to support bullish outlook
Approaching bullish market: expected before Q4
Strengthening alpha coefficient: 15.000 in ramge

Short, target 51Following weekly chart.
I got a short signal from my power indicator.
Also as I can see on the chart, it couldn't reach to new highs
TP1 62.55
TP2 56.90
TP3 51
Stop above 67.65 weekly candle close.

Short time, target 9000Bist, following weekly chart.
I got a short signal from my power indicator and my targets will be finonacci levels.
TP1 9400
TP2 9000
SL 9870 above, you can stop, but I still prefer t o stop above 10200

Not enough lows amid friction dense marketsRate of return is still bullish but rate of friction is bearish. This lead to stronger bearish market to normalize returns.

Probable correction of bist100 ( Xu100 )#bist100 index has formed an " evening star " candle pattern and this is the probable signal of downtrend. I drew probable bounce zones on #xu100 ( #borsaistanbul ) chart. Blue way, the W bounce seems more probable for now. Not financial advice.


Target 63.1Following daily chart and got a long signal from screener
TP 63.10
SL close under 58.45 candle close. Rice RR ratio.

#XU100 düşüş başlıyor mu?#XU100 1D grafik;
Bist100 grafiğinde ilk göze çarpan RSI tarafındaki uyumsuzluk
Yılbaşından beri 7 aylık bir yükseliş trend çizgisi üzerinde nizami hareketine devam ediyor ve yeniden destek bölgesinde
Bu desteğin bir kez daha çalışacağını düşünüyorum ancak bu kez zayıflatacaktır
Akabinde tekrar bu desteğe geri dönüp burayı kırdıktan sonra retest ile birlikte aşağı yönlü bir harekete başlaması sürpriz olmaz
Bu seviyeden yaklaşık %22 aşağısına kadar düşmesi ihtimaline karşılık harmonik bir yapı da mevcut. O seviyelere kadar düşer mi orasını göreceğiz.
#bist #bist100 #bist30

AEFES/TRY potential bull flagTECHNICAL ANALYSIS
Bull flag might be forming in the 4 hour chart.
Volume has ben decreasing since entering the pattern.
MACD on the 1 hour chart might turn positive soon.
RSI on the 1 hour chart has a bullish divergence and a triangle pattern.
I expect a move in the next couple of days probably before 31 July.
AEFES is probably in an accumulation phase before going upwards again.
Target price is 385TRY if a breakout happens.
Traders need to be careful because the daily MACD is still in negative territories.
Watch out for potential breakouts from the pattern.
FUNDEMENTALS AND NEWS
AEFES will share its Q2 balance sheet on 8th of august. It is expected to be positive.
AEFES has factories in Russia. Ukraine and Russia might agree to a peace soon.
My view: POSITIVE
Disclaimer: This isn't financial advice.

XU100.USDWhen I examine the investment plans of international companies in Turkey, I can see this graph more clearly, its wanting to return to the upward trend.

CIMSA 1D | The Green BoxCIMSA 1D | The Green Box
It seems that we’re going down a bit because of recent interest rates in Turkey and it can continue to pullback as I think during the election period. If the price will continue to rise up, it is important to be reclaimed the purple box above. If this happens, my first target can be the median line of the Pitchfork.
Chart Hi-Res link:

Ttrak (Türk Traktör) Flat CorrectionThis could be one of the strong possibilities out there...
Don't know what could be the factor or news but after comleting last up move to finish wave B of a flat we can expect strong impulsive C wave to complete Wave 4.
