BTCUSD - Hourly Resistance and Fibs I'm watchingI try to analyse as much as I can to see what is obvious and not so obvious so, when it comes down to making decisions based on price action change, I am ready. We know August will be a very interesting period for bitcoin as a "vote" is made and during or even before, we may see some people pulling out to "play it safe" while others ride it out. We have no idea of the outcome or the movements of capital prior to the vote so staying nimble will be key to those who are trading during this time. Use care with the volume you trade or keep in the crypto and good luck. August is a few weeks away so I'll be looking for any highs to exit portions of the coin for safety elsewhere but keep a small amount to ride the wave.
BIT


BTC USD Buying opportunityThis is the time to BUY BTCUSD
I think it will bounce up to 2500$ per BTC in the next 2-3 days because there is hugh buyer come back
as well as strong hammer candlestick exist in 4H timeframe
Enjoy profit

VRC BTC POLONIEXUnder lower volume conditions and a slight upswing in BTC Prices vs the USD in the past 24 hours, it is possible V R C has reached a settled price range of 6k-6200. I would expect, that under these conditions that market makers will try to break the green bottom trend line with a push to weekly S1 5400-5500 area. A break out is still of course possible, however with every wic down below this green trend line, to me that shows a significant lack of buy support as price hovers between weekly pivot and S1.
The yellow channel is a potential forming down trend. If the USD Value of BTC continues to rise with strength, I would anticipate this downward channel becoming dominant.
This all being said, there is still a rather strong force in the market now as seen by the higher weekly Pivot's.
Within the Indicator window I have underlined in black potential consolidation, however volume doesn't seem to be there. Lack of sellers, or buyers which ever is the case.
RSI Levels: (As per trading view data)
1H: 46.01
2H: 43.12
3H: 40.99
4H: 39.79
6H: 45.79
12H: 40.73
1D: 54.49
3D:67.00
1W: 60.42
1M: 50.77
As always trade at your own risk. I'm no pro, nor am I a market maker. This is simply me sharing my thoughts with interested parties.
(I had to repost this as I forgot some data, sorry if that was confusing)


Demand increase @ 50% Fibonacci retracementDemand increase . Mabe in one or two weeks we will get a more clearly activity of buyers wich will give us a Higher Low where to calculate our risk and put our SL .

Index BTC upClearly it is basically a period of rise supported by investors who prefer this instrument, possibly this look fortalesido with presidential elections as USA, but this is just speculation

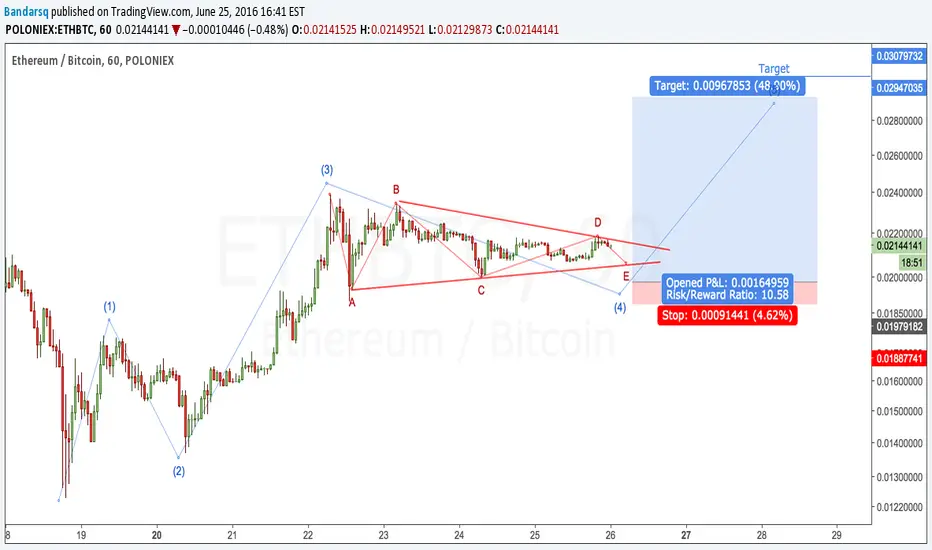
Wave 5 is About to StartETHBTC is in the middle of wave E of 4. I will be looking for breakout of the upper trend of the triangle.


Bitcoin 4/11/2016For those of you who are looking to get long Bitcoin, watch the lines for a time to jump in before the next breakout.


BTCCNY shortBTCCNY - short, trade 2, feb 27.
Stops: (1st - 2884,76; 2nd - 2924,20)
TPs: (1st - 2809; 2nd - 2766; 3rd - 2726)

Have I missed the boat now? Most definitely not! Come aboard.Fellow traders, in my last chart, I accurately predicted the recent rises several days before they came about with the use of the Weekly Stochastic.
When I looked at our current position to see our progress, I compared the current weekly level with that of the past two trends.
From this level of stochastic in the previous trend, we had a 2126% increase and then a 1051% increase. Please understand that for the price to go to the following levels from current ($547) prices takes:
$2,000 - 265%
$3,000 - 448%
$5,000 - 814%
$8,000 - 1362%
You can understand that I am still very bullish at this point.
As additional confirmation, I present the MACD charts which shows us two things:
1. Within the next fortnight, we can expect the uptrend confirmation (blue bars appearing). Look where the last one occurred!
2. The uptick on the white MACD line show a likely bullish crossover above the signal line again within a fortnight. Look where the last one occurred!
Please do your own research before committing to any trade and base your decision upon your own finding, not mine!
