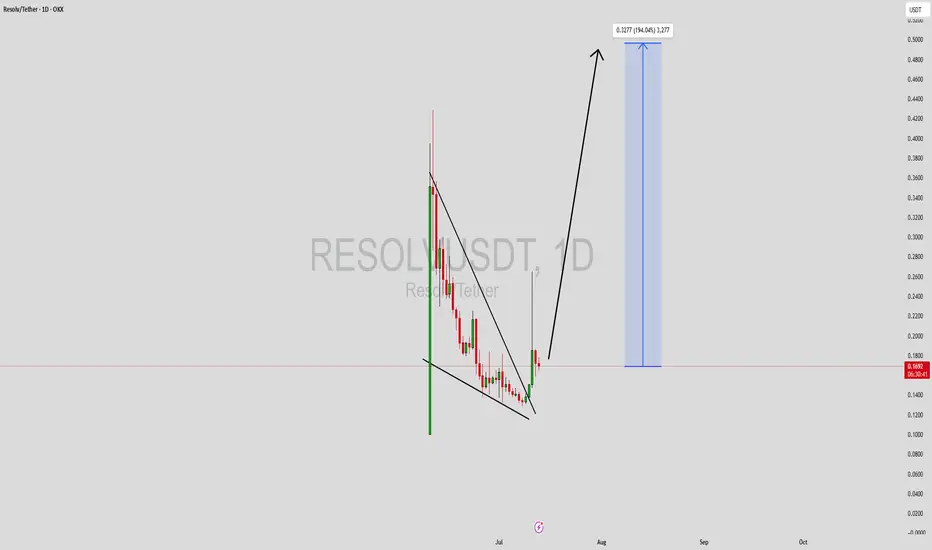
RESOLVUSDT Forming Falling WedgeRESOLVUSDT is beginning to draw significant attention from traders and investors as it develops a promising falling wedge pattern — one of the most reliable bullish reversal setups in technical analysis. This pattern indicates that the prolonged downtrend may be nearing exhaustion, with sellers losing momentum and buyers preparing to reclaim control. The current volume for RESOLVUSDT is looking strong, confirming that there is genuine interest backing this price action, which is exactly what traders want to see when anticipating a breakout.
A falling wedge pattern, combined with solid volume, often results in sharp upward movements once the breakout is confirmed. For RESOLVUSDT, analysts are expecting an impressive gain of around 180% to 190% following this breakout, which positions this crypto pair as a high-potential candidate for traders looking to maximize returns in the current market. As this pattern continues to develop, keeping an eye on key support and resistance levels will be crucial for anyone planning to ride this move.
Moreover, RESOLVUSDT is starting to build a community of investors who see its long-term value and innovative approach in the crypto space. Positive sentiment is steadily growing as more traders share their insights and strategies, which adds to the momentum needed to sustain a breakout rally. This blend of technical and community strength makes RESOLVUSDT one to watch closely in the coming weeks.
✅ Show your support by hitting the like button and
✅ Leaving a comment below! (What is You opinion about this Coin)
Your feedback and engagement keep me inspired to share more insightful market analysis wit
Bitcion
Bitcoin Monthly Candle Close colour and patterns since 2011
At the beginning of June , I wrote this
""On only 2 occasions have we had a GREEN JAN, RED FEB, RED MARCH, GREEN APRIL
And Both of them were on the way to ATH. (Boxes )
On both those occasions we also had a GREEN MAY, though the gains were minimal and one was followed by a Green June and the other by a Red June."
We just got the GREEN June and so this draws my eye to the sequence on the left, ( arrow )
If we are to follow this, then July should be a larger Green (Arrow) - BULLISH
In-fact, in both the sequences we have been following ( boxes), July was GREEN- BULLISH
And using just the month candle colours, we have a higher chance of another Green candle, with July having had 9 Green to 4 Red previously. - BULLISH
However
Of the previous 8 Green June Closes , only 3 went to a Green July - BEARISH
And I have to say, on NONE of the previous Green Junes were we so close to the current ATH.
July 2021 being the closest with a price at 41K, around 18K below the current ATH at the time.
We are currently only around 200 usd below Current ATH
This adds enormous resistance to the ability to rise
I wanted a RED June because I felt it was more sustainable and would lead to a cycle ATH at the end of the year. As can be seen in the middle Box
If we look back toward the 2012 Box on the left, we may now get a Hot July / August , September and then a Cool off for October, November & December.
But something tells me this will not happen.
The Candles for our current cycle in April, May and June are diminishing in size, the opposite of 2012
But they are similar to the 2020 box, except for the red June close.
This could lead to the desired "Cooling" in August & September and a new lift off in autumn.
And if you look at the chart Candle Colour Count, , August and September are usually RED by some majority
This also gives us the Bigger Green July candle that the "Odds" point towards.
So, as ever, we have to wait and see how this plays out.
Odds in favour of a Green July using previous cycle Data
PA position just below current ATH could lead to a slightly Bearish out look in the short term.
And if you are hoping to see ALTS Rally, PLEASE keep your eye on the BTC.D chart
This also points to wards BTC ATH in Q4 this year
And then, we have the BIG question.......Will we ever see a Classix Bear again ?
With so many Holding Bitcoin LongTerm.....How would a Bear market arrive ?
BUY BITCOIN
HOLD BITCOIN
But, as ever, we just have to wait and see,

New buying opportunity may emerge for BTCBTC tends to fluctuate in the short term, but as BTC builds a double bottom structure to support the rebound pattern, it is currently inclined to fluctuate upward. Although the upward momentum has weakened after reaching around 106,000, as long as it stays above the 105,300-104,800 area, BTC is still expected to continue to rise and may challenge the 108,000-109,000 area again.
And with the collapse of the gold and oil markets, funds in the two markets may flow into BTC, which is more attractive and the mainstream market of cryptocurrencies. So as BTC retreats in the short term, BTC may have new short-term buying opportunities. Then if BTC retreats to the 105,500-104,500 area and does not fall below this area, we can consider going long on BTC at the right time.

BTC (Y25.P2.E5).My levels of interest to LongHi Traders,
Much confluence to long in the 105k range.
The chart is self explanatory.
This is not stating to SHORT. Its stating that if price meets our conditions, then this is an ideal level to long.
FYI. We have much bearish divergence as the longs entered and it gave the whales reason to push it down.
Question is how low is enough. Hence why I have some levels and it could be the case the whales could front run 105k
All the best,
S.SAri

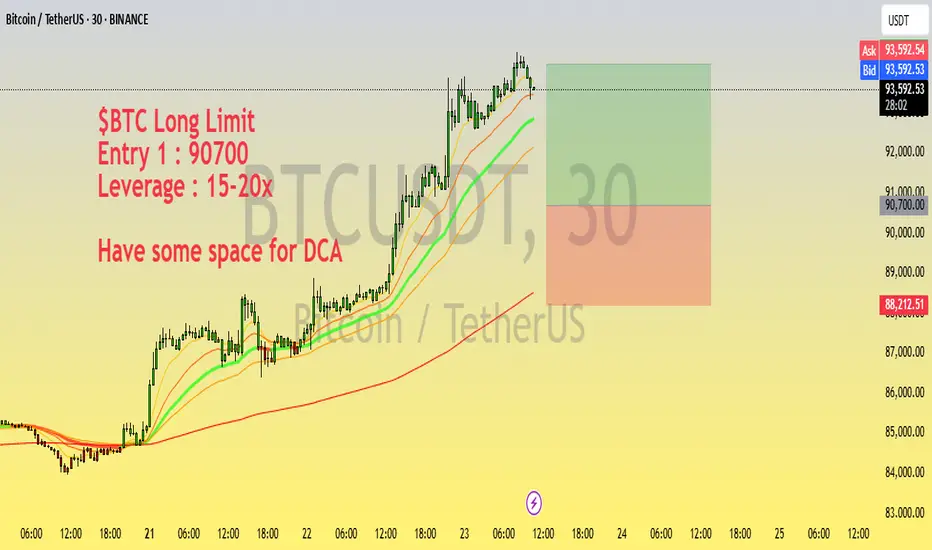
$BTC Long Setup | Entry @ 90700 | 15-20x Leverage | DCA FriendlyLooking to long BTC from the 90,700 zone with a high-conviction setup on support.
Trade Plan:
Entry 1: 90,700
Leverage: 15-20x
Setup: Price holding above key support with bullish structure forming on lower timeframes
Note: Leave room for DCA if price dips further
Monitor closely for reaction around support — tight SL recommended for capital protection.
Disclaimer: Not financial advice. DYOR and manage your risk accordingly.
BTC | MASSIVE CORRECTION or BULLISH PATTERN?After the new of the recent ByBit hack, the entire market seems to have taken a dip.
(more on the bybit hack here:)
Luckily, seeing a 20% correction on Bitcoin isn't strange.. at all. It's actually quite common for the price to correct anywhere between 15% and 30%. The tell all sign will be whether or not we can reclaim the key support ABOVE 90k, otherwise we might be heading closer to that 30% dip.
Meanwhile.. another altcoin is approaching a key buy zone. Don't miss it, here:
_______________________
BINANCE:BTCUSDT

Crazy Chainlink Pumps - What do you think?What do you think of these massive Chainlink pumps at different times on the LINK/BTC and LINK/USD charts.
Link/BTC -> June 8th, 2020
Link/ U.S. Dollar -> May 7th, 2021

BTC, how to use the Crypto Fear and Greed IndexHello everyone,
ever wondered how to use the crypto fear and greed index properly?
It’s calculated using factors like volatility, volume, social media sentiment, and surveys, producing a score from 0 (Extreme Fear) to 100 (Extreme Greed).
Today the index showing 43 points, which is close to the fear zone again.
Do you think it's time to buy now?

BITCOIN TARGET NOW 113k plus or minus 500 We seem to have ended of what is a 4th wave triangle I would now look for 113 era but it should be rather fast and form a Strong TOP to which a much bigger decline !!!

120k #BTC Sooner than later..... No matter how i chart #BTC the 120k to 130k price level is my target For the next year. Technical stand point BTC moves always seem to be calculated This chart is back to the basics and pretty simple Pure market structure. What are your thoughts? This is also why im not ruling out another trip to 40K. But for now........ I think we may take a crack at 72k

$BTCUSD Bull flag in progressIt looks like a little but important bull flag building
If it breaks will not only challenge the 200 days moving average, but also the upper support line of the larger channel @ 69k.

pepeusdt long ideaPepeusdt has been trending up for a while and broke a key level and now it has retested the level with a channel.
I'm buying from this level.
My Sl is below the range while my Tp at recent high.

BTCUSD BULL FLAG TO 80K$Hello Traders
As I can see BTC is now trading above the 60K$ after hit ATH and i CAN SEE A BULL FLAG HERE !!!
If price does not break given Stop Loss level, then it can create a big move so don't miss it its a very low risk-based entry and higher rewards Friends Supply and Demand is issue now with BTC price it had HIT ATH and now retrace more then 14000$ its time to buy Halving did not creat any panic selling pressure as it had created in previous halving because its not 2010 or 2011 world now knows BTC is best asset which will kill inflation and its a Digital Gold many more things is there for bullish in BTC we are long term Bulls on BTC but these levels are important Its just a Trade Idea Share Ur thoughts with us it help many other traders

BTCUSDT.2HLooking at this chart, I'm observing Bitcoin's price action against Tether (USDT) on the Binance exchange. We're using a combination of technical indicators and price levels to gauge potential future movements.
Firstly, the chart shows a symmetrical triangle pattern forming, which indicates a period of consolidation. A symmetrical triangle is typically considered a continuation pattern, meaning that the previous trend is likely to continue once the price breaks out. However, the direction of the breakout (upward or downward) is not determined by the pattern itself but by other indicators and market sentiment.
The Ichimoku Cloud is present here, which consists of several components. The cloud (Senkou Span A and B) acts as support and resistance levels. The price is currently below the cloud, suggesting a bearish sentiment. The Ichimoku Base Line (Kijun-sen) is above the Conversion Line (Tenkan-sen), which typically indicates bearish momentum.
We've also got pivot point levels marked as R1, R2, R3, and S1, S2, S3. These levels are used to determine potential support and resistance levels based on previous highs, lows, and closing prices. Currently, the price is hovering just above the S1 pivot point level. If it breaks below S1, the next levels to watch would be S2 and potentially S3 for support.
The Relative Strength Index (RSI) is just below 40, which is neither in the overbought nor oversold territory but is edging closer to oversold levels. This could indicate that there might be some buying pressure coming in soon, but it's not a guarantee.
The Moving Average Convergence Divergence (MACD) shows the signal line above the MACD line, and the histogram is in the negative territory, which supports the bearish momentum seen in the price action and the Ichimoku Cloud indicators.
In summary, the current setup is leaning more bearish, with the price below the Ichimoku Cloud and pivot point supports. The symmetrical triangle pattern suggests a breakout is imminent. If I were trading this setup, I would watch for a decisive breakout from the triangle pattern and confirm it with other indicators such as the RSI and MACD before making a trade. If the price breaks above the triangle and the cloud, that would be a bullish signal, while a break below could see further downside movement. It's important to keep an eye on the volume to confirm the breakout's strength and look out for any potential false breakouts.

BITCION SELL ON DIPS A BIG DROP COMING !!!HELLO FRIENDS
As I can see BTC is now trading in downtrend dollar dxy showing a strength and we hope so it will drop till design levels as soon as this four hour makes a big red candle world will realize how Golden Forex Traders trade BTC and Commodities it's just a trade idea on the base of technical + Fundamentals share Ur thoughts with us we appreciate Ur support and comments.
Stay Tuned for more updates !!!!!

Bitcoin Bullish Fractal Bars Pattern To $100k, $155k, and $250kHere's a slightly different chart showing how Bitcoin will likelyt proceed quickly to $100k once we break the $70K triple-top resistance, which I see happening quickly.
With Fresh NASDAQ:IBIT money continuing to flow into Bitcoin and the markets, this market has plenty of rocket fuel on the sidelines to send this rocket into the stratosphere.
Not only does the previous cycle fractal pattern show how Bitcoin can hit these levels this cycle, it also overlays perfect (with minor adjusting) with the Fibonacci projections that correctly forecasted the prior cycle high at the Fib 3.618 level.
The 3.168 number for this cycle would be $210k but I think it's reasonable to overshoot that this time with all the money on the sidelines waiting to come in. We're already starting to see and hear rumors of Tesla buying, Qatar and potentially other sovereign wealth funds, even China.
How high will Bitcoin go this cycle? Here's a good roadmap for now.
But new information = new dedision.
I'll keep you updated.
What do you think?

BUY BITCOIN MORE AFTER RETRACE TO 60K$ !!!HELLO TRADERS
As i can see BTCUSD hit ATH and created a double top i am expected a weekly and month and daily its ATH now and in extreme Greed level now its good time to sell now till given buying levels and get minimum 9k pips on this trade... Friends we can buy BTC from given Strong support and hold till halving it can hit given Tps Grayscale Bitcoin Trust ETF ...
Fidelity Wise Origin Bitcoin Fund ... ARK 21Shares Bitcoin ETF ... Invesco Galaxy Bitcoin ETF ... all are buying BTC for future Friends its just a trade idea share Ur thoughts with us
Stay Tuned for more updates!

AVAXUSDT - Ascending Triangle, waiting to breakout#AVAXUSDT (4H CHART) Technical Analysis Update
AVAXUSDT is forming ascending triangle pattern and it's waiting to breakout the ascending triangle.
If the price momentum continues in the similar manner, we can expect the breakout in next 2-3 days.
We have a strong resistance at 37$ level.
Long Entry level: $ 37.88
Stop loss: below $ 34.75
Target 1: $ 40
Target 2: $ 43.3
Target 3: $ 46.8
Target 4: $ 50
Max Leverage: 2x
ALWAYS KEEP STOP LOSS...
Follow Our Tradingview Account for More Technical Analysis Updates, | Like, Share and Comment Your thoughts.

#BTC LIQUIDATIONS COMING SOON !!!HELLO TRADERS ...
#BTCUSD has drop as we had sent predictions in our previous analysis on cup & Handle Shape based chart which is attached in comments
Dear traders weekly chart is showing us some rejection near weekly resistance which was last high of 2024 till now Iam still expecting some retracements and EFT will get some more selling pressure to help they buy cheaper BTC technically it is showing a rejection on broken support which was 42K$ a stronger $ can push the BTC more down to its new support zone lets see what markets bring to us. Friends its just a trade idea on base of technical analysis share Ur thoughts with us it help us alote
have look on Bull Trend analysis also in our profile zone tests also worked well from given levels till now but i am expecting more Drop if BTC does not hold above 44K next week.
Stay Tuned For more updates!

btcusd h4 30% correction target 32 000 usd🔸Hello traders, today let's review 4hourprice chart for BTCUSD and potential
reversal zones. We got a weak bounce in progress since we triggered fresh supply
zone near 46 000/47 000 usd, however limited upside as bulls will face strong overhead
resistances , therefore I still recommend to short sell rips/rallies.
🔸All the positive mid-term catalysts are already priced in the current market price,
there are no further catalysts until BTC halving later in April/May 2024. Therefore,
expecting 30% correction after the distribution stage complete later end of January /
Early February 2024.
🔸Currently we are trading at 42 600 usd, short-term bounces possible later near
40 000 usd, however limited upside going forward. Short-term traders might be
interested in accumulating near 40 000 usd for a TP near 45 000 /46 000 usd.
🔸Recommended strategy for position traders: Wait for the distribution sequence
to complete (final death pump), and short sell rips/rallies near 45 000 USD.
TP1 is 37 000 usd in FEB, 32 000 usd in April. Risk/reward clearly shifted in bears favor.
🎁Please hit the like button and
🎁Leave a comment to support our team!
RISK DISCLAIMER:
Trading Futures , Forex, CFDs and Stocks involves a risk of loss.
Please consider carefully if such trading is appropriate for you.
Past performance is not indicative of future results.
Always limit your leverage and use tight stop loss.

BTC DOMINANCE READY TO FLY !!!HELLO TRADERS !!!
As i can see BTC.D has hold the strong support zone its time to load you bags for a new bull run rally after a small retrace EFT got approved and many big companies and banks are soon getting in this digital money system..... Its just an trade idea for incoming BTC rally Stay Tuned for more updates .............

BTC 4H neutral cum bearish scenarioBTC on H4 TF, still remains the same but the Weekly closing made a good push and given the close above the structural Resistance. But the thing is, Candle have a large wick on top of it, showing the selling pressure/ Rejection. Marketing is also showing some consolidation now, expected to reach the Major Support Zone now.

BTC/USD Idea - 25 November 2023 Hi everyone,
As you can see from this monthly chart, BTCUSD has been on an uptrend since the beginning of January 2023, forming a series of bullish candlesticks, consolidating between around 37,700K and 25K from April to mid of the year.
In general, I don't expect a direct rise in BTC/USD as I anticipate a drop to levels seen at the beginning of the year (around 13-15K).
Personally, I believe BTC will experience growth, but not directly and significantly. Currently, if the monthly bullish candlestick closes within the shaded monthly area, then I believe BTC could rise to the range of 43K to 46K to reach the resistance but afterwards, I foresee a drop to 13-15K.
Once the price reaches these levels and establishes some "history," I expect a strong uptrend in BTC from these zones.
