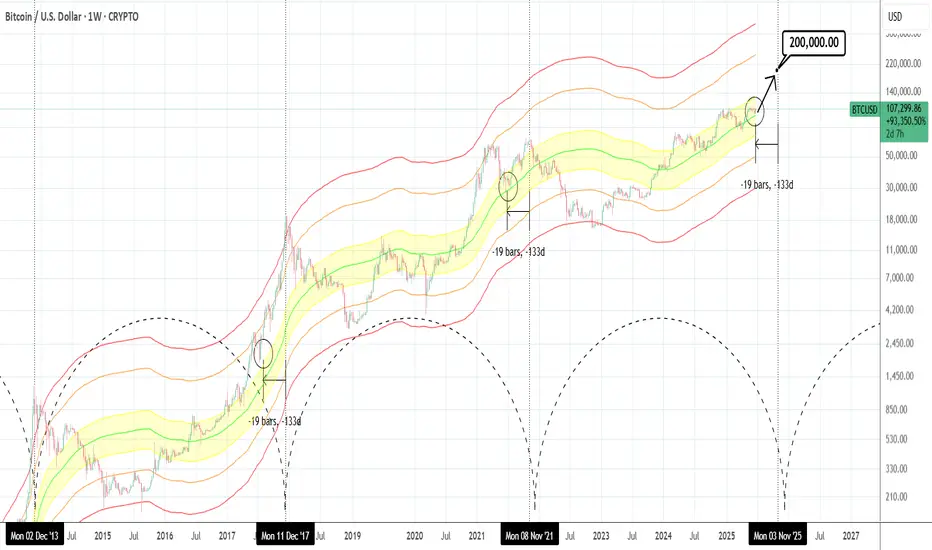
BTCUSD: Hasn't gone parabolic yet.Bitcoin is just now re-entering the bullish state on its 1D technical outlook (RSI = 55.820, MACD = 291.960, ADX = 15.180), being correcting/consolidating in the past 30 days. According to the Mayer Multiple Bands, it's stil inside the range (upper band) of the 1 Stdev Below-Mean-1 Stdev Above (yellow range). This suggest significant upside potential as being roughly 19 weeks before the Cycle tops, it matches the late June 2021 bottom inside that zone as well as the July 2017 bottom just over the top of that zone. The orange trendline has been the minimum target on every Cycle but looks unlikely to hit it by the end of the year. If however it goes parabolic as all Cycles had at this stage, $200,000 isn't at all far fetched before the Cycle tops.
## If you like our free content follow our profile to get more daily ideas. ##
## Comments and likes are greatly appreciated. ##
Bitcoin-btcusd-btc
BITCOIN Just wait until OIL turns bullish!Bitcoin (BTCUSD) has a unique long-term relationship/ correlation with WTI Oil (USOIL) and this charts shows why.
In the past 11 years, when Oil started to decline sharply, Bitcoin formed a market bottom before Oil did. When Oil started to rise again, Bitcoin was out of its bottom and has initiated its Parabolic Rally stage (green Rectangle). Then Oil peaked after BTC has already priced its own Cycle Top.
Based on this correlation, we can assume that we haven't yet seen BTC's Parabolic stage as Oil hasn't yet started to rise. If we assume that the late April Low on Oil was its market bottom, then only now it has started its rise, so at best BTC has just started the Cycle's Parabolic Rally. If that turns out o be true, then the upside potential is huge for BTC. Needless to say other key macroeconomic factors have to assist e.g. higher adoption, ETF inflows, FED Rate Cut, but that's what the current chart says!
So do you think that Oil can be the driver behind a new Bitcoin parabolic rally? Feel free to let us know in the comments section below!
-------------------------------------------------------------------------------
** Please LIKE 👍, FOLLOW , SHARE and COMMENT if you enjoy this idea! Also share your ideas and charts in the comments section below! This is best way to keep it relevant, support us, keep the content here free and allow the idea to reach as many people as possible. **
-------------------------------------------------------------------------------
💸💸💸💸💸💸
👇 👇 👇 👇 👇 👇

BITCOIN Cup & Handle completed! Technical Target $169k!Bitcoin (BTCUSD) is about to complete the Handle of a Cup and Handle (C&H) pattern. This comes only days after breaking below its 1D MA50 (blue trend-line) buy holding the 1D MA200 (orange trend-line) and rebounding.
Well the 1D MA50 has been recovered and on top of that, the 1D MACD just formed a Bullish Cross. This (isolated) Bull Flag, which is the Handle, technically targets the 2.0 Fibonacci extension at $169000.
Do you think that's realistic or a little excessive within thin time-frame? Feel free to let us know in the comments section below!
-------------------------------------------------------------------------------
** Please LIKE 👍, FOLLOW ✅, SHARE 🙌 and COMMENT ✍ if you enjoy this idea! Also share your ideas and charts in the comments section below! This is best way to keep it relevant, support us, keep the content here free and allow the idea to reach as many people as possible. **
-------------------------------------------------------------------------------
💸💸💸💸💸💸
👇 👇 👇 👇 👇 👇

BITCOIN Major Pivot bounce eyes $140000!Bitcoin (BTCUSD) has started off the week with a huge 1W candle bounce on the former Lower Highs trend-line (that started on its All Time High), which has now turned into a Pivot. That trend-line held both last week and 3 weeks ago.
The very same Pivot test took place (October 2024) at the start of the previous Bullish Leg, resulting into a massive rebound that peaked upon a +108.08% rise. That was even higher than the Bullish Leg before it (+92.12%), which also started after a 1.5 month consolidation (Dec 2023 - Jan 2024).
Interestingly enough those Legs show an amazing frequency as the Time Cycles show on their bottoms. Assuming the current Bullish Leg will follow the 'bad case' scenario of +92.12%, we should be expecting to see at least $140000 before the next pull-back/ consolidation.
Do you think such Target is feasible by the end of August? Feel free to let us know in the comments section below!
-------------------------------------------------------------------------------
** Please LIKE 👍, FOLLOW ✅, SHARE 🙌 and COMMENT ✍ if you enjoy this idea! Also share your ideas and charts in the comments section below! This is best way to keep it relevant, support us, keep the content here free and allow the idea to reach as many people as possible. **
-------------------------------------------------------------------------------
💸💸💸💸💸💸
👇 👇 👇 👇 👇 👇

BITCOIN Is this just a giant Bull Flag??Bitcoin (BTCUSD) saw a strong sell-off yesterday in the aftermath of the U.S. strike in Iran and fears of retaliation, but in later hours recovered some of the lost ground. The recovery is being extended into the Asian and early E.U. hours today and the emerging Channel Down pattern already draws strong similarities with the one in December 17 2024 - January 13 2025.
Both broke below their respective 1D MA50 (blue trend-lines) to form a Lower Low, which in the case of Jan 2025, it initiated a rebound that tested the All Time High (ATH) Resistance. See also how similar their 1D RSI patterns are, testing the same Support level too (41.20).
Given that this time the uptrend has been much shorter since the April 07 2025 Low, this Channel Down may be nothing but a giant Bull Flag in the middle of a standard Bull Cycle Leg. Until confirmed with a 1W candle closing above the ATH Resistance though, the medium-term Target is $111900.
Notice also the formation today of a 1D MA100/200 Bullish Cross, the first since November 13 2024.
So what do you think? Is $111900 your short-term Target? Feel free to let us know in the comments section below!
-------------------------------------------------------------------------------
** Please LIKE 👍, FOLLOW ✅, SHARE 🙌 and COMMENT ✍ if you enjoy this idea! Also share your ideas and charts in the comments section below! This is best way to keep it relevant, support us, keep the content here free and allow the idea to reach as many people as possible. **
-------------------------------------------------------------------------------
💸💸💸💸💸💸
👇 👇 👇 👇 👇 👇

Bitcoin Break: Watch 100K Revesal Or Test Of 95K.Bitcoin broke 100K support without any type of retrace attempt (YET). This move which is attributed to global events should not be entirely surprising. Most importantly do not OVERREACT, especially with all the nonsense hype this will generate. Here is a more effective way to process the current situation.
Avoid bias and pay attention to the bigger picture. In terms of wave count, Bitcoin can technically retest the 85K area and STILL be considered within a broader Wave 4. This implies the broader structure is still BULLISH (Wave 1 overlap). A swing trade or investing buying opportunity can develop in the 95K area or lower (see illustration).
The short term momentum is bearish as per break of 100K. This should guide shorter time frame strategies like day trades. A new bearish trend line is in play (see arrow). At this point without any meaningful reversal pattern in play (4H or above) look for bearish continuation patterns like consolidations (triangles) inside bars, etc. The 95K support would be a price objective to consider if you are open to aggressive short strategies. Keep in mind, shorting into such a low is HIGHLY risky and best suited for those who have adequate experience.
This situation proves once again, "expert" opinions mean nothing. A few short weeks ago, Bitcoin was poised to break out and everyone was going to be rich again (remember the Bitcoin conference?). So much for that. The market does NOT care what you, me or Michael Saylor thinks. It reflects the perception of the future, whether or not that future plays out.
This is precisely why CHARTS can offer value in terms of measuring potential and RISK. You don't even need to be that technical, just take a look at the weekly time frame. The previous week's bearish pin bar low was broken signaling weakness, NOT Bitcoin 100 million K.
Thank you for considering my analysis and perspective.

BITCOIN Free Signal! Buy!
Hello,Traders!
BITCOIN is retesting a
Horizontal support level
Around 101,288$ from
Where we will be expecting
A local rebound so we can
Go long with the Take Profit
Of 104,324$ and the Stop
Loss of 100,300$
Buy!
Comment and subscribe to help us grow!
Check out other forecasts below too!
Disclosure: I am part of Trade Nation's Influencer program and receive a monthly fee for using their TradingView charts in my analysis.

Symmetrical Triangle: Volatility Squeeze Before Breakout?Bitcoin (BTCUSD) is currently trading within a well-defined symmetrical triangle pattern on the daily chart. This formation is characterized by converging trendlines—higher lows and lower highs—indicating a period of consolidation and decreasing volatility.
Price action is tightening, suggesting a potential breakout is imminent. Symmetrical triangles can break either way, but in this case, the pattern follows a strong prior uptrend, hinting at a possible bullish continuation. Still, traders should watch closely for a confirmed breakout with volume.
⚠️ Key levels to watch:
Upper resistance: ~$111,000
Lower support: ~$96,000
A decisive break above or below these boundaries could set the tone for BTC’s next major move.

BITCOIN This is the long-term picture. Don't get distracted.Bitcoin (BTCUSD) has been consolidating lately after making a new All Time High (ATH) last month and this is already making part of the market nervous over whether that's the Cycle Top or not.
This is one of those times when it would be best to ignore the short-term noise/ volatility and stick to the long-term picture. And that's exactly what's shown on this chart, with BTC on the 1M time-frame showing the incredible symmetry among its 4-year Cycles, with Bear Markets lasting 12 - 13 months and Bull Markets 35.
Based on that, this Cycle's Top is expected to be priced by October (2025). This also matches the Sine Waves as implied by the 1M RSI, which as been trading within a Channel Down (diminishing returns) since Bitcoin's inception.
So do you also think that we have around 4 months before the market tops? Feel free to let us know in the comments section below!
-------------------------------------------------------------------------------
** Please LIKE 👍, FOLLOW ✅, SHARE 🙌 and COMMENT ✍ if you enjoy this idea! Also share your ideas and charts in the comments section below! This is best way to keep it relevant, support us, keep the content here free and allow the idea to reach as many people as possible. **
-------------------------------------------------------------------------------
💸💸💸💸💸💸
👇 👇 👇 👇 👇 👇

BITCOIN Is exactly where it should be this time on every Cycle!Bitcoin (BTCUSD) has made a new All Time High (ATH) last month, following the April 2025 rebound on the 1W MA50 (blue trend-line). No matter how odd this price action may look to some, BTC is simply replicating the pattern it has during every past Cycle around this time of its final year.
As you can see, besides April 2025, it made 1W MA50 pull-backs and rebounds on June 2021, July 2017 and July 2013. The consistency is remarkable and since we are already now half-way through June, historically Bitcoin only went upwards!
In fact, those pull-backs have been the strongest the market saw before the Cycles peaked on each and every occasion. Two Cycles peaked just above the 2.0 Fibonacci extension while in 2017 it peaked a little below the 5. Fib ext. This indicates that the minimum Cycle Top we can be expecting towards the end of the year is $160000 (marginally below the 2.0 Fib ext).
Many studies point towards the same Target. Do you think it's inevitable? Feel free to let us know in the comments section below!
-------------------------------------------------------------------------------
** Please LIKE 👍, FOLLOW ✅, SHARE 🙌 and COMMENT ✍ if you enjoy this idea! Also share your ideas and charts in the comments section below! This is best way to keep it relevant, support us, keep the content here free and allow the idea to reach as many people as possible. **
-------------------------------------------------------------------------------
💸💸💸💸💸💸
👇 👇 👇 👇 👇 👇

BITCOIN Cup and Handle making double bounce on the 1D MA50.Bitcoin (BTCUSD) is about to complete a Cup and Handle (C&H) formation, having consolidated for almost a month since the May 22 All Time High (ATH). What makes the bullish potential even stronger is that it is rising after making a Double Bottom on the 1D MA50 (blue trend-line) for the first time since October 10 2024.
Given that the long-term pattern is a Channel Up and the 1D MA50 is acting as its natural support trend-line, the Cup and Handle can provide a short-term Target on its 2.0 Fibonacci extension at $122000. On the long-term the Channel Up still has the potential to lead it much higher.
So do you think that 122k is achievable after this Cup and Handle making double bounce on the 1D MA50? Feel free to let us know in the comments section below!
-------------------------------------------------------------------------------
** Please LIKE 👍, FOLLOW ✅, SHARE 🙌 and COMMENT ✍ if you enjoy this idea! Also share your ideas and charts in the comments section below! This is best way to keep it relevant, support us, keep the content here free and allow the idea to reach as many people as possible. **
-------------------------------------------------------------------------------
💸💸💸💸💸💸
👇 👇 👇 👇 👇 👇

Bitcoin Consolidation: Easy, Walk Away.Bitcoin consolidation in progress. The easiest thing to do in these situations is avoid taking any trades until a new trend is established. Even smaller time frames will be harder to trade unless you are employing mean reversion strategies. At some point the market will choose which way it wants to go but trying to guess in advance is a coin flip. The broader trend is bullish but the 110K and 113K area is a tough resistance. If price struggles to break this area over the next few weeks, then a broader retrace may be more likely.
In this situation it pays to wait for specific levels to take any action at all. What type of action you take will depend on your risk tolerance and time frame. In my opinion, the higher probability scenarios will be a test of the 102K area supports, followed by reversal patterns. Even if they don't follow through to new highs, at least there will be some attempt to maintain the support since Bitcoin is still generally strong.
IF Bitcoin breaks the support (anything is possible) that will confirm the broader corrective scenario which can see price testing 95K at minimum. There is no way to know the certainty of this scenario, it is all about how price action unfolds and confirms.
This time of year is typical of lower volume, lower momentum and less follow through. Often it is better to just sit it out and wait until the season shows clear signs of improvement. Seasonal volume does not typically get back to consistently high momentum levels until November. This does not mean there will be no opportunities at all, it just means if there is going to be a time to purposely be more selective, the next couple of months would be that time.
Thank you for considering my analysis and perspective.

BITCOIN is only now starting the final Cycle rally!Bitcoin (BTCUSD) took a hit overnight following the Israel attack on Iran and at the moment the consequences of that action can't be quantified in great detail but on the long-term the bullish trend seems intact.
In fact it remains below the historic Pivot Growth Curve (PGC) that has separated BTC's peak pattern (green Arcs) from bottom and accumulation (red Arcs), and could be tested by next month.
Once broken, the real rally towards the Cycle's peak can start, with most previous studies we conducted showing that $150000 is a fair (if not modest) estimate.
Are you worried about the latest geopolitical conflict or this chart is enough to give you long-term assurances? Feel free to let us know in the comments section below!
-------------------------------------------------------------------------------
** Please LIKE 👍, FOLLOW ✅, SHARE 🙌 and COMMENT ✍ if you enjoy this idea! Also share your ideas and charts in the comments section below! This is best way to keep it relevant, support us, keep the content here free and allow the idea to reach as many people as possible. **
-------------------------------------------------------------------------------
💸💸💸💸💸💸
👇 👇 👇 👇 👇 👇
BITCOIN Is 'Bullish June Seasonality' about to kick-in?Bitcoin (BTCUSD) has started June on a very promising note, recovering most of last week's losses and is potentially headed for a new All Time High (ATH). This however, should be no surprise as BTC has exhibited amazing strength during the month of June and onwards since 2013.
As this chart shows, the market has historically rallied on June, in fact it is the month that kick-started Bitcoin's final rallies towards the Top on its last three Cycles.
Based on the 2W RSI, which is ranging within the 0.236 - 0.618 Fibonacci levels, we can argue that the price action is closer to June 2017 than other Cycles. As to how high it can get to, we've analyzed that on other studies, the current analysis only serves to show you that historically we are set for a strong 'Bullish June Seasonality' effect.
Do you agree that this is about to kick-in? Feel free to let us know in the comments section below!
-------------------------------------------------------------------------------
** Please LIKE 👍, FOLLOW ✅, SHARE 🙌 and COMMENT ✍ if you enjoy this idea! Also share your ideas and charts in the comments section below! This is best way to keep it relevant, support us, keep the content here free and allow the idea to reach as many people as possible. **
-------------------------------------------------------------------------------
💸💸💸💸💸💸
👇 👇 👇 👇 👇 👇

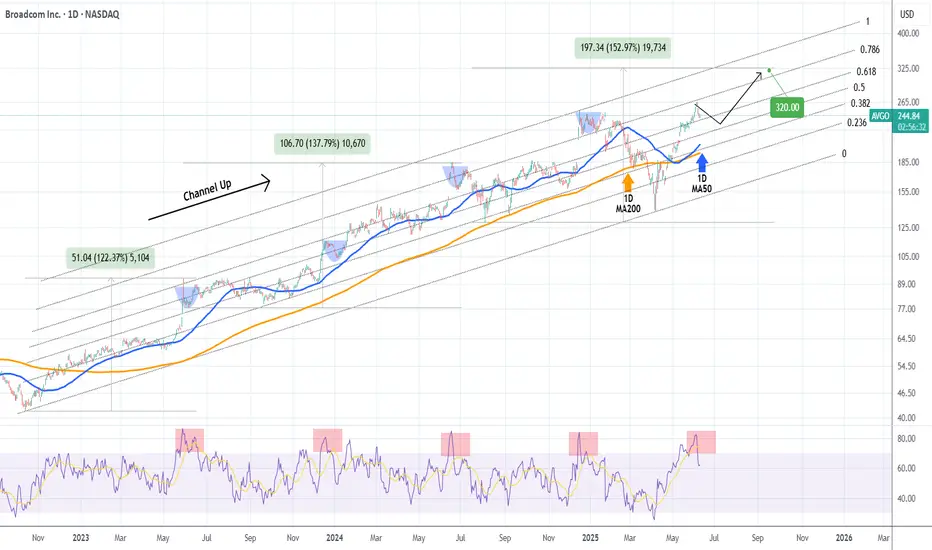
BROADCOM Pull-back to demand zone possible before new High.Broadcom Inc. (AVGO) is currently on a 3-day pull-back that started right on the 0.786 Fibonacci level of the 2.5 year Channel Up. The 1D RSI got heavily rejected from deep inside the overbought zone (>70.00) to back down below it and the only times that happened within this pattern, was during short-medium term pull-backs towards its 1D MA50 (blue trend-line).
As a result, the current pull-back can extend a little more towards the 1D MA50 and then rebound. Given a +15% added increas on each Bullish Leg of the Channel Up, we expect to see $320 next.
-------------------------------------------------------------------------------
** Please LIKE 👍, FOLLOW ✅, SHARE 🙌 and COMMENT ✍ if you enjoy this idea! Also share your ideas and charts in the comments section below! This is best way to keep it relevant, support us, keep the content here free and allow the idea to reach as many people as possible. **
-------------------------------------------------------------------------------
💸💸💸💸💸💸
👇 👇 👇 👇 👇 👇
Inverse Head and Shoulders Now Clear On Bitcoin ChartTrading Fam,
It has now become apparent that Bitcoin has formed an inverse head and shoulders pattern on the daily. This is very bullish and should the pattern follow through, it gives some good long-range targets to shoot for by the end of this year and potentially, well into the next.
Calculating our first target is relatively simple. We draw a measurement from the bottom of the head (that largest dip) to the neckline. We then move that measurement line to an approximated breakout area. This then gives us an estimated target of around 150k. I will say that this is a fairly sure target before the end of the year if and when that neckline is broken to the upside.
Target number two should be that 350 DMA in my opinion. Bitcoin likes to kiss that 350 DMA in bullish markets. So, where ever that ends up being pricewise during this next upwards movement is a good target #2. I would estimate it will be at least 175-180k.
But if we break that 350 DMA to the upside, then you will know the end of our bull cycle is drawing close. Bitcoin may blow-off here and generally would stay above that 350 DMA for at least another month or two. In our last bull cycle it remained above the 350 DMA for 5 and a half months. Selling anytime we are significantly above that 350 DMA pricewise and timewise is not a bad strategy because you will know we are nearing the end of our bull cycle at this point.
I hope this post gives you some good long-term targets and trading strategies going forward. Personally, I will be looking to sell much if not most of my holdings once Bitcoin breaks above that 350 DMA. Of course, as always, I will keep you all posted when that time comes.
Best,
Stew

BITCOIN The beauty of structured patterns. $150k is next.Bitcoin (BTCUSD) has invalidated all bias calling for a deeper pull-back after May's new All Time High (ATH), as yesterday it broke above the previous ATH Resistance, invalidating the short-term Head and Shoulders pattern, while rebounding last week exactly on the dashed Lower Highs trend-line, confirming it as a Support level.
Within BTC's 3 year Channel Up pattern, we have seen this price action structure another 3 times. The minimum rise on such pattern has been +101% and that wasn't even a Lower Highs rebound. The other two that were exactly like the current formation, increased by a lot more.
As a result, we expect Bitcoin to complete a minimum +101% rise from the April 07 bottom, which translates to a clean $150000 Target.
Do you think the structure ill continue to hold up to $150k and possibly beyond? Feel free to let us know in the comments section below!
-------------------------------------------------------------------------------
** Please LIKE 👍, FOLLOW ✅, SHARE 🙌 and COMMENT ✍ if you enjoy this idea! Also share your ideas and charts in the comments section below! This is best way to keep it relevant, support us, keep the content here free and allow the idea to reach as many people as possible. **
-------------------------------------------------------------------------------
💸💸💸💸💸💸
👇 👇 👇 👇 👇 👇

BITCOIN LOCALLY OVERBOUGHT|SHORT|
✅BITCOIN will soon retest a
Key resistance level of 112,000$
Which is an all-time-high
And the coin is locally overbought
So I think that the price will make a pullback
And go down to retest the demand level below at 109,000$
SHORT🔥
✅Like and subscribe to never miss a new idea!✅
Disclosure: I am part of Trade Nation's Influencer program and receive a monthly fee for using their TradingView charts in my analysis.

BTCUSD: H&S neckline invalidated! Heavily bullish.Bitcoin turned bullish again on its 1D technical outlook today (RSI = 58.910, MACD = 1101.600, ADX = 21.447) as it crossed over the neckling of the Head and Shoulders pattern and invalidated the bearish sentiment. This now targets the 2.0 Fibonacci extension to the upside on the short term, TP = 123,500.
## If you like our free content follow our profile to get more daily ideas. ##
## Comments and likes are greatly appreciated. ##

Bitcoin: Break Out Or Fake Out Can Be Long.Bitcoin has adhered to my previous week's anticipated scenario almost exactly. While this may be a coincidence, I have called similar scenarios like this numerous times just see my previous articles, I left the illustration on the chart. From here, there are two scenarios to consider, one offering greater probability than the other. Let me explain.
First consider that the Bitcoin trend has never changed. The broader tend is bullish and the previous weeks only saw a brief corrective structure which found support in the 102K AREA )see my previous article). A reversal developed and confirmed and now we are in the process of rallying back toward the highs.
Scenario 1 The Breakout: IF the high 106's are cleared, it is possible price can break out to potentially test the next resistance around the 110K area. Since this environment is typically a lower volume time of year, I believe there is a greater chance of fake out. How you manage the risk all depends on the time frame you operate on. Smaller time frames can pin point more accurate signs of follow through while maintaining tighter risk while taking the breakout on this time frame exposes you to more risk. If taking the breakout on this time frame, consider mitigating risk with smaller size or being prepared to exit IF a conflicting signal appears like a bearish pin bar.
Scenario 2 The Retrace: IF price rejects the 106K area (fake out possibility) then I will be watching for a retest of the 104K area minor support. This is the level where I would be looking for confirmation patterns like bullish pin bars etc. This would not only constitute a higher low but also establish a classic inverted head and shoulders pattern. I do not put a lot of emphasis on the broader pattern, but it can help foster a self fulfilling prophecy. This reversal offers a greater probability since it is coming from a pullback within a broader bullish trend. Also the profit objective is greater since the 110K resistance would still be the same.
How you mange this again depends on the type of strategies you employ. My analysis is meant to provide an overall roadmap of the possibilities that I anticipate and nothing more. If you are a day trader this information will not be used the same way compared to if you are a swing trader. The key is how you define the risk and the confirmations. If the market rejects both scenarios, then we simply have to readjust to the new information that becomes available.
Thank you for considering my analysis and perspective.

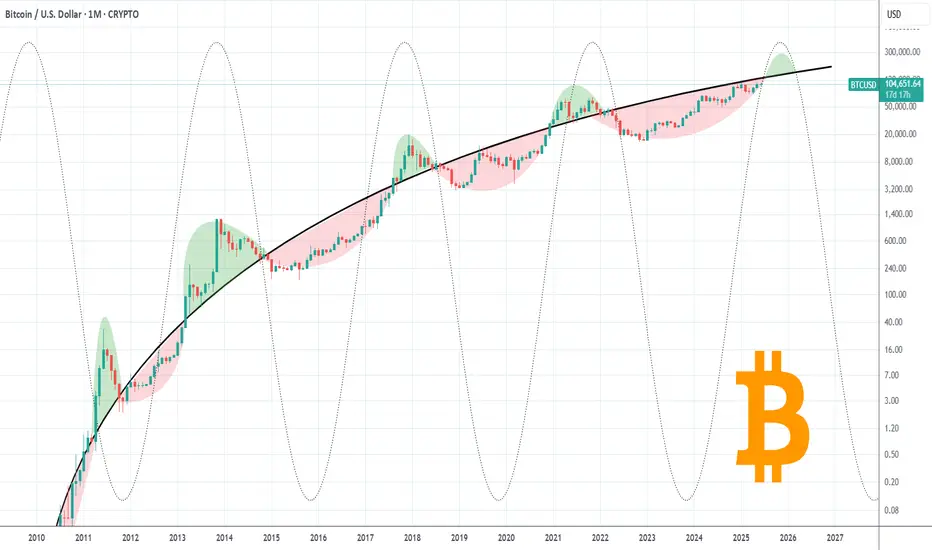
BITCOIN Log Channel and Waves show we're nowhere near the top.This is Bitcoin (BTCUSD) on its Logarithmic Growth Channel with the use of Rainbow Waves on it. This model accounts for the Halvings (light blue vertical lines) and with the use of Fibonacci Time extensions, it estimates the potential Cycle Bottoms (green vertical lines) and Tops (red vertical lines) within the Parabolic Growth Curve.
A fair value is estimated around the purple trend-line (zone top and bottom) as well as a maximum (red trend-line) and minimum (light blue trend-line) wave.
Interestingly enough, BTC hit that minimum wave trend-line on the April 07 2025 Low for the first time since June 17 2017, making it the strongest buy signal we could get at this stage of the Cycle.
So based on all the above, Bitcoin is nowhere near the top of its Cycle and this isn't just because it hasn't yet touched the next red vertical line (Time Fib 4.382) which is on October 27 2025, but also because it is currently trading below the Fair Value Zone (even below its bottom half).
Both previous Cycles topped considerably above that Fair Value Zone and almost hit the maximum wave. Even if by October 27 2025, Bitcoin 'only' hits the purple (Fair Value) trend-line, it would have reached $135000 and if earlier it can even hit $145000. That is the bare minimum based on that model. If it hits the top of the Fair Value Zone by October 27, then we can see prices as high as $180000 even.
Which price do you think we are more likely to see? Feel free to let us know in the comments section below!
-------------------------------------------------------------------------------
** Please LIKE 👍, FOLLOW ✅, SHARE 🙌 and COMMENT ✍ if you enjoy this idea! Also share your ideas and charts in the comments section below! This is best way to keep it relevant, support us, keep the content here free and allow the idea to reach as many people as possible. **
-------------------------------------------------------------------------------
💸💸💸💸💸💸
👇 👇 👇 👇 👇 👇

1️⃣ Bitcoin. Analysis of US Treasury DocumentsHello, crypto enthusiasts, decentralization adepts, and those who still believe in "financial freedom". Get ready, because what you are about to read might shatter your template, but it will clarify where your beloved market is heading.
In June 2016, the blockchain world witnessed an unprecedented event – the hacking of The DAO , which called into question the fundamental principles of decentralization and smart contract security. This incident not only led to Ethereum's historic hard fork but also became a powerful impetus for the development of safer and more reliable solutions in DeFi and DAOs. This article is dedicated to that event.
Now, we won't be talking here about "future technology," "blockchain revolution," or how your shitcoin will fly to the moon. No. First, we'll talk about how the "system" is preparing to digest and rebuild the crypto market to suit its needs, using everything from Forbes covers to global economic crises. Here, the author shares not just predictions, but presents in an accessible form a broad understanding of the interconnected global processes, where crypto is just one 🧩 puzzle piece of the overall picture of the future digital "brave new world" of cyberpunk . This scenario is not someone's wishful thinking, but the most plausible course of events. You may like it, you may not, it doesn't matter; what matters is what you will do with this information next.
The article will be divided into three separate ideas:
1️⃣ Main Idea: Analysis of US Treasury Documents
2️⃣ Who's Next? Or: Operation "Saving Private Saylor"
3️⃣ Altcoins and the US Crypto Reserve
Get ready, the article will intentionally be long to immediately filter out all "clip-thinking" gamblers. In general, everything as you love it, written with love in a rebellious style, with a 🤏"touch" of cynicism, sarcasm, and tragicomedy. If you are interested in continuing any of the topics, follow the links (which will be below), and then return to this root idea. So, let's go!
1️⃣ Main Idea: Bitcoin and Crypto. Analysis of US Treasury Documents
For a long time, the world of cryptocurrencies was the "Wild West" – a place where anonymity, quick money, and the dream of complete independence from traditional banks and governments reigned. Bitcoin, with its idea of "digital gold," became a symbol of this freedom, promising refuge from inflation and manipulation by fiat currencies. But, as they say, the "Wild West" doesn't stay wild for long, especially when trillions of dollars and a threat to global financial stability – which is, of course, always "national" – loom on the horizon.
It's no longer a secret that US authorities and major financial institutions are carefully studying and analyzing the digital asset market. In this article, we will uncover a multi-step scenario where the "invisible hand of the market" is actually controlled by quite visible structures. We will show how a series of seemingly independent events – from the media's "Forbes curse" to an inevitable financial crisis – perfectly fits into a plan to create a US "crypto-reserve" and fully integrate (read: subjugate) digital assets into the traditional, centralized financial system.
Prepare for the harsh truth. This is not a story about crypto saving the world from fiat slavery. This is a story about how the fiat system, when faced with a challenge, adapts and absorbs the threat, using its own ideas. And, unfortunately for some, it will do so at the expense of those who believed in unlimited growth. Let's dive into the details of this cunning plan, where Michael Saylor is not just an investor, but a key figure in this spectacle of life unfolding before our eyes.
📜 Our "sacred scriptures" – this is an analysis of three crucial documents published on the US Treasury website:
1. The Future of Money and Payments (FM&P, September 2022): This is like Grandpa's first tentative step into using a smartphone. "Oh, what's this interesting thing you have here? Fast? Cheap? And here we old folks are still rustling with checks..."
2. Digital Assets and the Treasury Market (DA&TM, October 2024): Here Grandpa already figured out that the smartphone can count money. "So, these 'stablecoins' of yours – they're buying our bonds? That's even better than the Chinese!"
3. Digital Money (DM, April 2025): And here Grandpa is confidently tapping the screen and even seems to be trying to take a selfie. "Alright, stablecoins are our new MMFs, and if anything happens – I'll arrange a 'run' for you, like in 2008! And your Bitcoin is just 'digital gold' for nervous investors who run from our inflation to it, and then back to us for a hedge!"
Forget about conspiracy theories – they're writing it themselves! Documents like those presented by the Treasury Borrowing Advisory Committee (TBAC) clearly outline their views on "Digital Assets" and "Digital Money." In these reports, Bitcoin is no longer a "speculative toy," but a "store of value, aka 'digital gold' in the decentralized world of DeFi". And if it's "gold," then, by their logic, it should belong to the state, shouldn't it? Prepare yourselves, because today we're going to look under the hood of how serious gentlemen from the American financial elite suddenly "fell in love" with digital assets.
❓ So, what are these US financial authorities really trying to achieve? By studying and analyzing this open information, one can understand the scope and plans of the US financial elites. The main aspects extracted from those three documents are highlighted below:
1. The dollar is the world's drug, and we will control the dose, even in digital form!
Stablecoins? They're our "digital servants"! In DA&TM and DM, they are no longer just "digital assets," but "ubiquitous cash on the blockchain". And most importantly – these naive crypto-enthusiasts (without even knowing it) are buying short-term US Treasury bonds as collateral! This is a goldmine! We're already printing debt, and now the crypto market is financing it. "Thank you for using our services to ensure your unstable stability!"
"Wildcat banknotes" vs. "real dollar": DM doesn't hesitate to draw direct historical parallels. "Remember those 'wildcat banknotes' in the 1800s? Poorly collateralized, constant runs... And then the government came and said: 'Want reliability? Here's our dollar!'" It's the same story with stablecoins: "Your USDT and USDC are nice, of course, but only if they are 100% backed by our T-bills. Otherwise – no offense, but we remember the Terra/Luna story (and can repeat it if necessary), and you certainly don't need such happiness!"
"Your 'stable' coins must be our stable coins!" DM explicitly states: "Stablecoins will be regulated as narrow banks or money market funds!" This means: no more shenanigans with 'algorithmic' wonder-coins, like Terra! Now you will be backed only by highly liquid, risk-free assets... guess which ones? That's right, our own, American Treasury bonds ! Hello, Tether, you are now officially our best client!
"Our CBDC is not 'Bitcoin for the people,' but a 'prison blockchain' for control!" FM&P cautiously hints at CBDC as a "safe" alternative. But let's be honest: they don't just want a "convenient" digital currency. They want complete control. To know where every cent went, so that no Uncle Vasya can conduct a suspicious transaction without oversight. It's as if the NSA released its own crypto in 2008 – super-duper secure and decentralized, but every sneeze you make on the blockchain is recorded and tracked.
2. "We're for innovation! But only if it's on our platform, under our control, and preferably – on a private blockchain where you won't stick your curious nose!"
"Blockchain is cool! But not the one you're on!" DA&TM clearly states: "Public, permissionless blockchains? Oh, no, that's a nightmare! Scalability is lame, security is questionable, and let's not even talk about money laundering! We don't want every John Doe to be able to anonymously transfer millions. We need 'private and permissioned blockchains' where we know who's doing what, and can control everything."
"Tokenization is not a revolution, it's just a new Word for old documents!" Yes, they talk about "increasing efficiency" and "atomic settlements". But, in essence, they want to take their old, dusty Treasury bonds, slap a "token" on them and say: "Look, we're trendy too! Now you can 'instantly' exchange our bonds!" It's like buying a new iPhone but installing Windows 95 on it. Looks trendy, but works old-school. Tokenization of Treasury bonds is not for your pet hamster to buy a share in a T-bill, it's for "atomic settlements" and "improved collateral management" between large banks and institutions. If anything gets faster, it's their corporate ⚙️ gears, not your small transactions.
3. "Financial stability means your money is with us, not on some DeFi protocol!"
"We remember 2008 and 2020! And your stablecoins are MMFs on steroids!" DM very clearly shows that "runs" on stablecoins are exactly the same as "runs" on money market funds during a crisis. And the consequences? "Fire sales" of Treasury bonds, falling prices, chaos. "So, folks, if you want to be 'stable,' be like our MMFs – backed only by our government's risk-free securities!"
"Banks are sacred, and don't encroach on their deposits!" DM expresses unambiguous concern that these "interest-bearing stablecoins" could draw deposits away from banks. And this, begging your pardon, "could negatively affect banks' ability to attract deposits and make loans". That is, on bank profits. And we cannot allow that, because banks are the pillars of our system!
Thus, the "US financial authorities" are not just a group of boring accountants. They are strategists who play the long game. They cannot (or do not want to) stop the crypto revolution, but they can direct it into a channel that is beneficial to them. They want to:
"Regulate" stablecoins so they are simply a digital embodiment of their Treasury bonds.
Use blockchain for their own infrastructure, but with such centralization and control that Satoshi Nakamoto would turn over in their anonymous grave.
Ultimately, issue their own "digital dollar" (CBDC), which will be both "innovative" (in words) and "controlled" (in practice), so that no "private digital currency" infringes on their monopoly.
This is not about "freedom," it's about "controlled dominance". They are not chasing the crypto train – they are buying it, repainting it in the colors of the American flag, renaming it the "Financial Stability Express," and selling tickets that you will buy with your own, strictly regulated, stablecoins. Our three documents are not just bureaucratic papers. They are, in essence, a strategic plan to "tame the beast" and redirect its energy in the right direction. Or, as some official would say, "optimization of national interests". And in our language – "how not to lose global financial hegemony while these hipsters play with their numbers".
In the end, the US financial authorities are engaged in a kind of "digital colonialism". They cannot ignore blockchain and crypto, because it's no longer just "internet money for geeks," but a multi-trillion dollar market. Therefore, their goal is not to fight windmills, but to build their own, much more efficient windmills on the wind of digital innovations. And at the same time, ensure that all these windmills grind flour for their loaf of bread, that is, for the US dollar.
They want you to continue using the dollar, even if it's "digital".
They want your "stable" assets to generate income for them by buying their bonds. They want any "effective" blockchain solutions to be under their watchful eye, so that no one escapes into the "wild, unregulated" world of anonymity and decentralization. This is not about "freedom of financial innovation," it's about "innovation under strict supervision". Or, if you prefer, "controlled digital expansion". After all, what's the point of new technology if it doesn't serve the interests of good old hegemony?
🔍 Let's examine in more detail what is stated in the document: "Digital Money" (DM, April 2025). Or "The American Pump: Why Washington Wants 2 Trillion of Your 'Stablecoins' (and what they'll get for it)"
Imagine, our bureaucratic friends from TBAC (a club of clever people who whisper with the US Treasury) held a secret meeting in April 2025. And what did they see there? A prophecy! 💥 A prophecy that the stablecoin market, currently hovering around $234 billion, will soar to $2 trillion by 2028! That's an 8.5x increase, if you can count! A typical crypto bro would say: "Whoa, pump! We're making x's!" But a serious uncle from the Treasury would say: "Excellent structural demand for our Treasury bonds! Finally, these 'digital monies' are working for us!" So, how is the US government going to arrange this "pump" without admitting it?
📝 The "Digital Milking Machine" Scenario (or why your stablecoin is their new wallet):
"Our Dollar – Your Problem!"
▫️ "Stablecoins? They're our best friends!" At first, they frowned, saying, "anonymous, decentralized, risky." But then they saw that 99% of stablecoins are just digital dollars, pegged to their own paper! And they are used as "cash on the blockchain," meaning people in the crypto world are already actively using them. "Aha," they thought, "so the world has already accepted our dollar in digital form, even without our direct involvement. Excellent! Now we need to ride this and monetize it."
▫️ "Hey, stablecoins, buy more of our bonds!" The cherry on top from DA&TM: "Stablecoins hold $120 billion in Treasury bonds!" And if the market grows to $2 trillion, imagine: how much will that be in our precious, ever-deficient T-bills? It's just a celebration! "Please, keep issuing your stablecoins, the more the better! And we will give you paper with interest. And you, naive ones, will think it's 'collateral,' and we will think it's 'a new source of financing our debt'!"
"Regulation is Love (for our interests)!"
▫️ "We will regulate you to death... so you can be 'stable'!" TBAC explicitly states: "If history teaches anything, stablecoins must be regulated like 'narrow banks' or 'money market funds'". This is not for your safety, folks, it's for theirs. "We don't want you playing with 'algorithmic stability' and crashing markets like Terra/Luna. No, no, now you will walk the line, backing every dollar of yours with OUR Treasury bonds. Because only that is 'real' risk-free collateral, right?"
▫️ "But your 'interest-bearing' stablecoins... we don't really like them!" Why? Because they can "compete with bank deposits" and "undermine banks' ability to make loans". That is, if your stablecoins start earning you real interest, you'll run from the banks! And that's an assault on the sacred. "Propaganda for 'Tokenization' is a new 'quantum leap' (for our national debt)!"
▫️ "Tokenization? What's that? Oh, it's just our new way to sell bonds!" FM&P and DA&TM talk about "increasing efficiency of clearing and settlement" through tokenization. Sounds boring, but the meaning is this: "We want to make our national debt even more liquid and accessible. If these crypto-guys love tokens so much, then let our bonds be tokens too! And then, who knows, retail might follow, through these 'tokenized Treasury bond funds'!"
▫️ "Forget 'decentralization' for bonds, that's only for 'us'!" DA&TM clearly states: "Public blockchains are garbage for Treasury bonds". They need "private, permissioned blockchains". This means: "Blockchain is cool, but only if it's controlled by us, our banks, and you sit there like mice and don't make a peep. No anonymous movements!"
So yes, the US government will indeed "pump" the crypto market, but not in the way you think. It won't buy Bitcoin or Ethereum (at least not openly). It will "pump" the stablecoin market because it's:
A brilliant way to finance its own national debt by attracting capital from the crypto world.
An ideal tool to expand the global influence of the dollar, making it convenient "digital cash" in decentralized ecosystems, but under its control.
A method of "taming" the wild crypto-west, forcing it to play by its rules of financial stability, lest any glitch should harm their "traditional" system.
It's as if a casino decided to "pump" its players by saying: "We'll let you play with chips that are backed by our own debts. The more chips you make, the more of our debts you buy! And if your chips crash, that's your problem, because we warned you it was 'risky'!" So, yes, expect stablecoin capitalization to grow by at least $2 trillion by 2028.
🎮 All right, if you want to delve deeper into these documents yourself, follow the links above, and we'll move on. Now let's play a guessing game with you. The task: by elimination, figure out who on this list are "their guys" for the US government, who is a "stranger," and who cannot be touched, and who can or even should (from the US perspective) be "taken advantage of"?
📊 Largest Known BTC Holders (as of May 2025):
1. US Government: ~200,000 BTC (confiscated during investigations)
2. Satoshi Nakamoto: ~1.1 million BTC (not moved since mining)
3. BlackRock (iShares Bitcoin Trust - IBIT): ~650,000 BTC
4. Fidelity (Fidelity Wise Origin Bitcoin Fund - FBTC): >200,000 BTC
5. MicroStrategy (MSTR): ~576,000 BTC (as of May 2025)
6. Grayscale Bitcoin Trust (GBTC): ~187,000 BTC (outflows occurring)
7. Coinbase (reserves): >600,000 BTC (exchange balance, including client funds)
8. Binance (reserves): >500,000 BTC (exchange balance, including client funds)
9. Bitfinex (reserves): ~400,000 BTC (exchange balance, including client funds)
10. Gemini (reserves): >127,000 BTC (balance including client funds)
11. Tether (USDT, own reserves): ~100,000 BTC (in addition to fiat reserves)
🧮 Who are "their guys" and who is a "stranger"? Distribution of influence in the crypto market. In the grand game for control over the future financial landscape, especially in the digital asset sphere, the US government and its affiliated traditional financial institutions act strategically. Their goal is not to destroy cryptocurrencies, but to integrate and subjugate them on their own terms , creating a "National Crypto Reserve" and a new, controlled digital financial infrastructure. This process implies a clear distinction: who is "one of us" (a useful or tamed element of the system), and who is a "target" (a source of assets or a potential object for threat elimination). There are also unique cases that fall outside this dichotomy. Let's analyze the list of the largest BTC holders as of May 2025 from this perspective:
"Their Guys" (fully integrated, tamed, or cooperating): These players are already deeply embedded in the traditional US financial system or are actively striving for full regulatory compatibility. For the US government, they are either direct partners or "tamed" assets that contribute to achieving strategic goals. They are not touched, but used as tools or components.
1. US Government (~200,000 BTC): Status: absolute "their guy" and main player. They are the ones who will "take advantage" of others. They are the ones who set the rules and collect dividends. Their Bitcoins are confiscated assets, a "free" replenishment of the future "National Crypto Reserve".
2. BlackRock (iShares Bitcoin Trust - IBIT: ~650,000 BTC) and Fidelity (Fidelity Wise Origin Bitcoin Fund - FBTC: >200,000 BTC): Status: key institutional "their guys" from traditional finance. These are Wall Street giants who have received SEC approval for their spot Bitcoin ETFs. Their massive BTC accumulations are not speculation, but a strategic integration of cryptocurrencies into the existing system. They act as main gateways for institutional capital, channeling it into a regulated stream. They are actively involved in shaping the new financial architecture, for example, BlackRock with the BUIDL fund for tokenized Treasury bonds, which fully aligns with the TBAC vision. They cannot be touched; they are part of the control mechanism.
3. Grayscale Bitcoin Trust (GBTC: ~187,000 BTC): Status: tamed "their guy." After the trust's conversion to an ETF and massive outflows, GBTC came under direct SEC control. Despite asset losses, the remaining assets are now in a regulated product. Grayscale was forced to fully adapt to the system's rules. There's no need to touch it – it's already in the system.
4. Coinbase (reserves: >600,000 BTC): Status: key "their guy" in the US crypto market. This is the largest regulated American crypto exchange that actively cooperates with authorities. Coinbase serves as the "main entrance" for retail and institutional investors in the US. Its transparency and compliance make it indispensable for the system as a tool for data collection and control over fund movements. It will not be touched, but will be used as part of the regulated infrastructure.
5. Tether (USDT, own reserves: ~100,000 BTC): Status: "tamed" and useful "their guy." Tether, being the largest holder of US Treasury bonds, is already deeply integrated into the financial system. The system does not seek to destroy it, but to fully subjugate it to regulatory control. For the government, it is a source of demand for their debt (Treasury bonds) and a potential tool for controlling digital flows. It will be "regulated" in the sense of "finally brought to heel," so that it becomes absolutely transparent and controllable, essentially a private digital dollar under supervision. (See DA&TM pp. 4, 17, 25).
6. Bitfinex (reserves: ~400,000 BTC): Status: "their guy" through affiliation with Tether. Since Tether is already recognized as "their guy" and is under regulatory pressure, its affiliated structures, such as Bitfinex, also automatically fall under this logic. If Tether is "tamed," then Bitfinex, as part of the same ecosystem and holding significant assets, will also be forced to comply with the same standards of transparency and compliance. This is not a "stranger" in the full sense, but rather a "younger brother" controlled through the elder.
7. Binance (reserves: >500,000 BTC): Status: already "regulated." Lawsuits, multi-billion dollar fines, and CZ's removal are classic examples of how the system forced the largest global, but previously less regulated, player into submission. Now Binance, although still a powerful force, is forced to operate within the given rules. It no longer needs to be "touched" in the same sense – it has been "tamed" and included in the sphere of influence.
8. Gemini (reserves: >127,000 BTC): Status: "their guy," but with caveats. Gemini is an American exchange actively striving for compliance. Despite past regulatory difficulties (e.g., with the Earn program), it remains part of the regulated American crypto infrastructure. It will be used to control flows, but also kept under constant supervision.
Neutral Player (not participating in the game): This anonymous entity is outside the system of control and is neither "their guy" nor a "target" in the traditional sense. Satoshi Nakamoto (~1.1 million BTC): Status: Neutral, not participating in the game, and untouchable. These Bitcoins remain untouched and symbolize true decentralization and uncontrollability. The US government cannot touch them , unless "Satoshi" himself decides to move funds to a regulated platform or an incredible cryptographic vulnerability is found.
So, the only major target that can be 'taken advantage of' is, 🥁 drumroll: Micro Strategy (MSTR: ~576,000 BTC) Status: 🎯 Main Target. Although Michael Saylor is a prominent Bitcoin supporter, and Micro Strategy is a public company, their aggressive accumulation strategy (often through debt) makes them extremely vulnerable to the price of Bitcoin. In the event of a serious market crash, Micro Strategy will face enormous pressure (margin calls, debt obligations). In such a scenario, their significant assets could become targets for forced liquidation or acquisition by organizations with deeper pockets and government backing. Their "high-beta" nature (as described in TBAC documents) makes them vulnerable.
For the continuation of Michael's story, see the separately published idea:
2️⃣ Operation: "Saving Private Saylor." Or how Uncle Sam "nationalizes" Bitcoin while Michael is busy with micro-strategies.
🎼 "History doesn't repeat itself, but it often rhymes" – and for Michael Saylor, this rhyme echoes with unsettling persistence.
In 2000, he, the shining dot-com hero, faced the prose of numbers when the Securities and Exchange Commission (SEC) knocked on his door . The overstatement of revenue by MarginCallStrategy MicroStrategy and non-compliance with "Generally Accepted Accounting Principles" (GAAP) – all this led to a restatement of financial results and a stock collapse of -60% in a day, and then almost -90% in a few weeks. But this episode was just the first line in a long poem.
Two decades later, Michael Saylor re-emerged on the scene, now as a prophet of "digital gold," transforming his company into the largest corporate holder of Bitcoin. His passionate belief in decentralization and the unique nature of BTC is striking. He claims that Bitcoin is a hedge against inflation, an eternal store of value, immune to the manipulations of the fiat system. But the louder his sermons about Bitcoin, the more they rhyme with the past: excessive confidence, public bravado, and disregard for fundamental risks.
History does not repeat itself literally, but it rhymes. Michael Saylor in 2000 and Michael Saylor today are two lines of the same poem, where the final chord will belong not to "digital gold" in its pristine, decentralized form, but to "tokenized government bonds" and CBDCs, which will become the foundation of a new, controlled financial order. Bitcoin, of course, will survive another -70% collapse, but in a completely new role that better suits Washington's needs than the dreams of crypto-anarchists.
Let's delve deeper. To avoid overloading the article, it has been decided to publish the section on altcoins and the scenario for replenishing the US "Crypto-Reserve" separately from the main root idea. If you are interested in learning how the government intends to make the US the "crypto capital of the world," and the fate of altcoins with a forecast for 2025-2028, follow the link:
3️⃣ Altcoins and the US "Crypto-Reserve"
Excellent, let's continue. Now we are on the home stretch! Connecting all the dots: the Forbes curse, the inevitable crash, the insidious plans of the US government, and finally, the final mega-pump.
Washington's Grand Crypto-Gambit: How they will crash the market to orchestrate a 'Final Pump' (and why they need your altcoins at dirt-cheap prices for this)
My previously published basic crypto forecast is not just relevant – it is becoming even more ominously realistic; it's just (as usual) slightly shifted in time. Because the "big guys" in Washington are not some Elon Musks who pump with tweets. They work on a schedule, and their schedule is called "global economic recession," which the Democrats have stubbornly delayed until Trump's presidency since 2023.
◻️ Part 1: "Pre-Pump Cleanse" – Why a crash is coming (and why Bitcoin won't hold up either) 2025-2026.
While you rejoice that Bitcoin is demonstrating "phenomenal resilience," trading around $75,000 - $100,000 (thanks to Bitcoin ETFs and migrating Chinese, at least some demand!), I'll tell you straight - it's an illusion. It's like the last dance before the fall.
▫️Bitcoin – king, but on a shaky throne: Yes, demand from ETFs and "fleeing capital" from China have kept the price around $100k for the last three quarters. But, let me remind you what TBAC said (and that, by the way, is the voice of the Treasury!): Bitcoin is a "high-beta asset." This means it amplifies market movements. If the stock market sneezes pretty hard (down -30-40%), Bitcoin will catch pneumonia (down -60-70%).
▫️Alts – it's already a "bloodbath": While Bitcoin is setting its historical highs (essentially drawn on the enthusiasm of new funds), alts are already howling in pain. The altcoin index CRYPTOCAP:OTHERS is already -40% lower since the beginning of the year, with its capitalization falling from $450 billion to $260 billion.
The Impending (US-Managed) Armageddon in the Markets:
"Debt market? What's that?" The absence of buyers in the debt market (hello, USA, Japan, EU!) – this is not just a "small problem," it's a systemic crack. Who will finance all these government expenditures if no one wants to buy bonds?
"Liquidity? What liquidity?" The liquidity problems in the global "Eurodollar" financial system are no longer a joke. When the world's largest financial arteries become clogged, blood stops flowing.
US stock market (SP500 and NDQ100) crash of -30-50% from their ATH in 2025. This is not just a "scare," it's a controlled demolition of an old building to construct a new one. And in the still "very small cryptocurrency market" (by traditional market standards, of course), this will result in a further -60-80% drop from current levels!
Buckle up, Bitcoin to $30,000 - $50,000! Yes, my forecast is harsh, but realistic. Before a new phase of growth for the entire cryptocurrency market (yes, not just Bitcoin, but your beloved altcoins too), we are obliged to see a final sell-off.
◻️ Part 2: "Final Pump: When Uncle Sam Becomes Your Crypto-Manager" (2026-2028)
This is where it gets really interesting. After the market is flushed out, "weak hands" are eliminated, and Michael Saylor's (and many others') "digital gold" is "nationalized" at a bargain price, they will enter the stage – the US authorities.
"Our dollar – your digital wallet!" Remember TBAC's forecasts that the stablecoin market will grow to $2 trillion by 2028? This is no coincidence. It's a plan. They don't want to "pump" Bitcoin; they want to "pump" their stablecoins, which, of course, will be 100% backed by their own Treasury bonds. This is the ideal mechanism for financing their bottomless debt!
"Regulation? No, it's controlled growth!" They will "regulate" the market to make it safe... for them. Stablecoins will become "narrow banks," and private blockchains – "permissioned." This means: "Use our 'digital currency' (stablecoins), buy our bonds with them, and everything will be fine. And if you want 'innovations,' only on our centralized infrastructure!"
"Tokenization of all America": When traditional markets are in ruins, they will announce a "new era" – the era of tokenization! Tokenized Treasury bonds (convenient for buying with your stablecoins!), tokenized stocks (after the crash, they will become very "attractive" for buying via blockchain!), tokenized real estate... And all this under the supervision of "reliable" centralized structures.
"Final explosive growth" (under control): It is precisely this controlled growth, this inflow of liquidity through stablecoins and the tokenization of traditional assets, provoked and financed by the US authorities, that will be the "final explosive growth" for the entire crypto market in 2027-2028. Crypto will grow not because it is "decentralized," but because it has finally been "tamed" and integrated into the global financial system, but on Big Brother's terms.
📉 Periodic Crashes – A Tool for Capital Redistribution
Many current fresh gamblers "investors" don't understand a simple thing: periodic crashes in financial markets, be it stocks or cryptocurrencies, are not a "bug" or an accident, but a built-in "feature" of the system itself. This is a powerful tool for redistributing capital, constantly transferring wealth from some to others. At each turn of the economic cycle, when "bubbles" inflate (be it dot-coms, mortgages, or crypto), and then deflate with a resounding crash, a massive redistribution of wealth occurs. This is not a natural disaster, but rather a well-oiled mechanism.
Accumulation of assets by "dumb money": During periods of rapid growth, when markets are overheated and assets are rising rapidly, "dumb money" enters the game – that is, ordinary retail investors, small speculators, newcomers without a deep understanding of risks. Inspired by stories of successful success and the fear of missing out (FOMO), they pour their savings into the market at its peak, often using borrowed funds or buying the most volatile and overpriced assets. They buy "hype," not value. It is here that MicroStrategy, aggressively buying Bitcoin with borrowed funds, becomes a symbol of this vulnerability, albeit on a larger scale.
Shaking out weak hands: For the "system," there are two main methods to get rid of "excess passengers" and "weak hands" in the market. The first is sharp, panic-driven crashes, when fear forces investors to sell assets at a loss, just to "get out of the game." The second, no less effective, is the exhaustion of enthusiasm over time (prolonged periods of stagnation). These are months or even years of boring "sideways" trading (trading in a narrow range) or slow but steady price declines. At such moments, the belief in quick profits fades, and investors, especially those who invested in altcoins without fundamental understanding, lose patience and leave, abandoning their assets at throwaway prices. Both methods effectively "clear out" inexperienced or insufficiently patient participants.
Creating "liquidity" for institutions: Crashes and price declines, as well as periods of stagnation, create what is called "liquidity" – an opportunity for large players to buy assets at significantly discounted prices. When the market is "bleeding," or when "hamsters" get tired of waiting and sell everything in despair, that's the "meat" that the "falling knife" provides for "smart money."
Benefits for "smart money": Giants like BlackRock, Fidelity, Vanguard, or legendary investors like Warren Buffett, do not invest in "hype." They create trends and wait. They possess enormous capital reserves, access to insider information (analytics, government plans, such as TBAC documents), and, most importantly, iron discipline and patience. They do not succumb to panic; they create it when needed! When markets are bleeding and "ordinary mortals" sell everything in a panic, these "sharks" of the financial world go hunting, buying quality assets (be it stocks, real estate, or even Bitcoin, which is already recognized as "digital gold" in certain circles) at prices inaccessible to small players.
Centralization of wealth: As a result of each such cycle, a further centralization of wealth occurs. Capital flows from less informed, less disciplined, and more emotional market participants to those who play by the rules of the "big game," having access to resources, analytics, and, possibly, even a certain influence on the system itself. Market crashes are not system errors, but its key redistribution function, allowing capital to remain in the hands of the elite and constantly increasing their share of the overall wealth pie. This is a brutal but extremely effective mechanism of "natural selection" in the world of finance.
And these are not some "conspiracy theories" but the harsh truth, whether someone likes it or not. According to 2022 data, people with capital over $1 million, making up only 1.1% of the world's population, own ~50% of the world's wealth, while the richest 12.2% of people own over 85%. At the same time, the poorest 55% of the planet's population controls only 1.3% of the world's wealth. Between these two poles, about half of the global wealth is (for now) dispersed. And in 2026-2028, you will have the last chance to enter this "middle class," which is systematically being destroyed by those at the top of the pyramid.
✴️ Your place in the "New World Crypto-Order" (or why freedom is an illusion)
We live in an era when even the seemingly most "decentralized" and "independent" market, like crypto, ultimately finds itself under the close scrutiny of those who hold the strings of the global financial system. Documents like TBAC (which you will hopefully now read with double attention) are not just bureaucratic reports; they are roadmaps to how "Big Brother" intends to integrate, and essentially subordinate, the "wild" world of digital assets to its interests. So, we have established that:
The upcoming stock market crash and, consequently, crypto crash in 2025-2026 – this is not just an "unexpected market correction," but an inevitable managed stage of "cleansing" that will allow the "system" to get rid of "weak hands" and acquire assets at a discount. Your altcoins, which are already bleeding, will become even cheaper before they are picked up by those who know what they are doing.
"Pump" of stablecoins to at least $2 trillion by 2028 – this is not a sign of your victory, but a brilliant way for the US government to find a new, bottomless source of financing for its ever-growing national debt. Your "stable" money will become their "stable" bonds, as most stablecoins, especially USDT and USDC, are backed by US Treasury bonds, which creates direct and massive demand for US debt obligations. "Continued growth of stablecoins... will create structural demand for short-term US Treasury obligations." (DA&TM, p. 16)
The narrative "Bitcoin – digital gold" – this is not just a marketing ploy by crypto enthusiasts, but a convenient concept that the government can use to "nationalize" large crypto assets at a bargain price and use them for its own benefit. The hidden, but key goal of this narrative is to create a new, global tool for absorbing and refinancing part of the colossal US national debt. The higher the recognition and price of "digital gold" controlled by the state, the more financial leverage it will gain to manage its obligations, turning a decentralized asset into a new pillar of the fiat system .
❓ What does this mean for us, mere mortals, trapped in this crypto-matrix?
This means that the next six months are a time not for euphoria and not for buying a "strategic reserve," but for strategic retreat and patient waiting. While "Big Brother" squeezes the market and prepares for the "nationalization" of crypto assets through defaults and margin calls, we should:
Keep a finger on the pulse of the global economy: Attention to the debt market, Eurodollar liquidity problems, and the predicted stock market crash in 2025 – this is not background noise, these are the main indicators of the upcoming "cleansing."
Forget about FOMO for Bitcoin at $100k: These are just the death throes of a "bull market," supported by artificial demand. The target range of $30-50k is an entry point that "their boys" are preparing for themselves.
Aim for altcoins: Your favorite altcoins, which have already fallen by -40% since the beginning of the year and still have room to fall (by -60-80% from current levels) – this is where the real "bloody auction" will be. It is these assets that, after the crash, will become most attractive to those who understand what will follow the market "cleansing" and which coins will end up in that very US "crypto-reserve."
🏁 Final Act: Controlled Explosive Growth (2026-2028) When the dust settles, and Michael Saylor's (and many others') Bitcoins are in the hands of the "State Crypto-Reserve" at a large discount, the real "pump" will begin. But this will not be a pump of "decentralization" or "freedom." This will be controlled, institutional, government-funded growth, based on:
Excess liquidity created by banksters. Growth in the broad cryptocurrency market, especially on such a massive scale, is impossible without an influx of "cheap" money into the global financial system. For this excess liquidity to appear, appropriate conditions must be created: low-interest rates (close to zero) and a reactivated "printing press" (Quantitative Easing – QE). To achieve this, the stock market (and, consequently, the traditional economy) must first be sharply crashed to force the Fed to abruptly "change course" and begin "saving" the economy by injecting trillions of dollars into the system. This "flood" of liquidity will be the fuel for a new wave of crypto market growth, but strictly under the control of their guys institutions.
Trillions of stablecoins, backed by US national debt. These stablecoins, as we already understand, create structural demand for short-term US Treasury obligations, becoming a powerful tool for managing national debt.
Mass tokenization of traditional assets on "private, permissioned blockchains" managed by banksters. This will create huge new markets and capital flows that will be controlled by their players.
And, of course, a legitimized Bitcoin as "digital gold," which will now be in safe government hands, not with some "alchemists" or "micro-strategists."
💡 Be smart, not emotional.
The cryptocurrency market – is not just a set of charts and technologies. It's a battlefield where the interests of decentralization and centralized control clash. In the coming years, we will see how the last "wild" frontier of digital assets will be integrated into the traditional financial system.
Your task is to understand this scenario, step aside while the "elephants dance," and prepare to enter when "blood is flowing in the streets." Only then will you be able to become part of this final explosive growth, which, ironically, will be provoked and financed by the very forces that are now trying to herd crypto into a corral.
⚠️ See you in 2026! And remember: knowledge and understanding – this is your only superpower in this zero-sum game, as everyone, to the extent of their understanding, works for themselves, and to the extent of their misunderstanding – for those who know and understand more.
🚀 As a token of gratitude, don't forget to hit the rocket under this unique work.
🙏 Thank you for your attention.
📟 Stay in touch.

BITCOIN Risky Long! Buy!
Hello,Traders!
BITCOIN keeps falling down
And the coin is almost 9%
Down from the recent highs
So BTC is oversold and
After it hits a horizontal
Support of 100,800$
We will be expecting a
Local rebound and a move up
Buy!
Comment and subscribe to help us grow!
Check out other forecasts below too!
Disclosure: I am part of Trade Nation's Influencer program and receive a monthly fee for using their TradingView charts in my analysis.
