BITCOIN It's blue-print is Gold and it is a bullish one.Bitcoin (BTCUSD) is displayed on this 1W chart alongside Gold (XAUUSD) by the black trend-line. The text will be short as the chart is pretty much self-explanatory.
Every time Gold breaks its Lower Highs trend-line, BTC is past its bottom and well into its Bull Cycle, starting an aggressive rally. Right now Gold is dangerously close to that Lower Highs trend-line, while Bitcoin is already posting an impressive rally this first month of the year.
If Gold breaks its trend-line again, will you take it as an additional signal that the new BTC Bull Cycle has officially started? Feel free to let me know in the comments section below!
-------------------------------------------------------------------------------
** Please LIKE 👍, FOLLOW ✅, SHARE 🙌 and COMMENT ✍ if you enjoy this idea! Also share your ideas and charts in the comments section below! This is best way to keep it relevant, support me, keep the content here free and allow the idea to reach as many people as possible. **
-------------------------------------------------------------------------------
💸💸💸💸💸💸
👇 👇 👇 👇 👇 👇
Bitcoin-btcusd-btc

AT CryptoScan: BTCUSD to retraceSince the last post on BTC, it surged to 23,815 and is consolidating in a range at the interim top. Breakdown for a retracement is expected, and 20,633 is the support that should hold for a bounce and then a continued rally higher. Else, 19,000 is the base support to not break below.
Watching these levels...

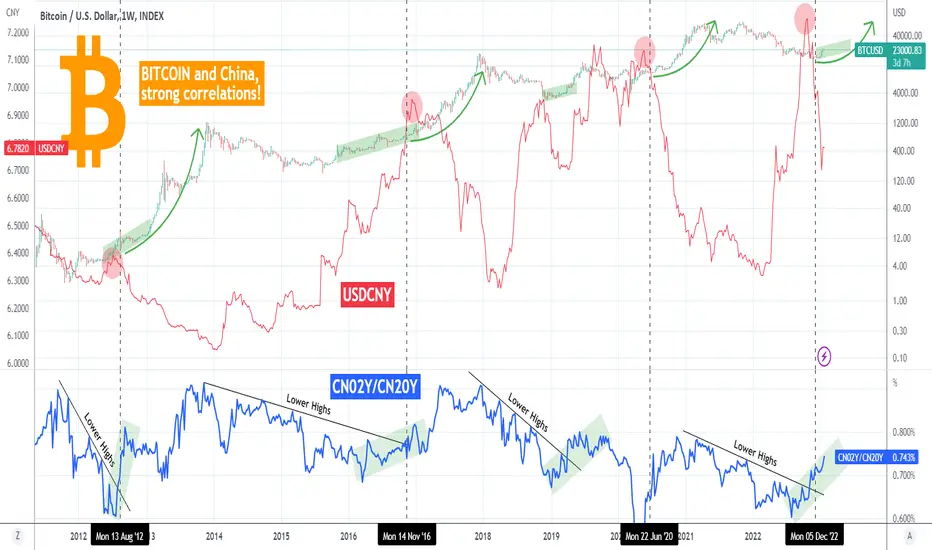
BITCOIN Yuan and China bond yields point to a mega rally!This is not the first time we emphasized the strong correlation of Bitcoin (BTCUSD) with Yuan (USDCNY) and the Chinese Bond Yields (CN02Y and CN20Y). We made an analysis right in the aftermath of the FTX crash, indicating why those indicators have all aligned, paving the way for BTC's new Bull Cycle.
As you see that happened and this time we incorporate the element of CN02Y/CN20Y. This shows that every time the ratio's Lower Highs broke in the past, Bitcoin started the first phase of the Bull Cycle. For shorter or longer periods, this was achieved within a Channel Up (green). Right now we have started the new one.
Adding the fact that every time the USDCNY topped and dropped as aggressively as it has been doing since October 24, Bitcoin has started the most aggressive part of the Bull Cycle, the parabolic rally.
This mix is incredibly bullish for Bitcoin technically and it prompts to a mega rally next, the likes of which we may have not seen in the past. Do you agree? Feel free to let me know in the comments section below!
-------------------------------------------------------------------------------
** Please LIKE 👍, FOLLOW ✅, SHARE 🙌 and COMMENT ✍ if you enjoy this idea! Also share your ideas and charts in the comments section below! This is best way to keep it relevant, support me, keep the content here free and allow the idea to reach as many people as possible. **
-------------------------------------------------------------------------------
💸💸💸💸💸💸
👇 👇 👇 👇 👇 👇
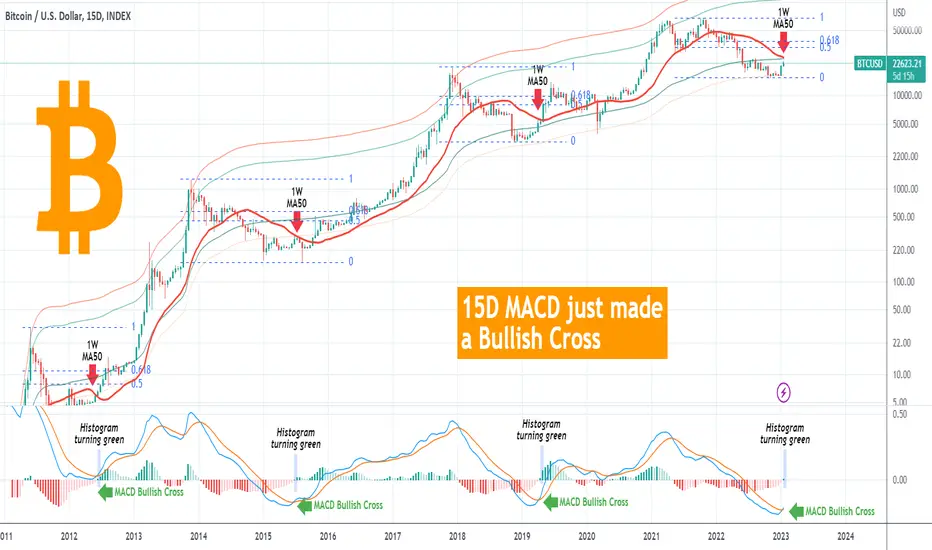
BITCOIN This is the Bullish Cross that will take it to $33kBitcoin (BTCUSD) just made a hugely important and unique Bullish Cross on its LMACD. Those who follow us regularly over the years, know that we like looking into assets (and Bitcoin in particular) from different time-frames that provide a more spherical overview of the market and the direction. This time we analyze the 15D chart as it just formed a Bullish Cross on its LMACD indicator.
This is a very rare pattern which below the 0.00 (LMACD) level has always formed straight after a Bear Cycle Bottom. Even during Bitcoin's first Cycle (2011/12) and the March 2020 COVID crash, the Bullish Cross was formed marginally above the 0.00 level.
Now the 1W MA50 (red trend-line) comes into the spotlight, as it is the Resistance to beat. Every 1W MA50 break following a 15D LMACD Bullish Cross, hit at least the 0.5 Fibonacci retracement level in a maximum of two weeks. We can make a case about the 0.618 Fib as well, which failed to get hit only marginally on October 28 2015.
As a result, with the 1W MA50 currently at 25615, we can expect another sharp 2-4 week rally once BTC breaks it, that will target at least the 0.5 Fib at $32900 with a riskier extension being the 0.618 Fib at $38900.
What do you think? Has this 15D LMACD Bullish Cross shaken your last bearish bias and if so, will you buy the 1W MA50 break-out confirmation? Feel free to let me know in the comments section below!
-------------------------------------------------------------------------------
** Please LIKE 👍, FOLLOW ✅, SHARE 🙌 and COMMENT ✍ if you enjoy this idea! Also share your ideas and charts in the comments section below! This is best way to keep it relevant, support me, keep the content here free and allow the idea to reach as many people as possible. **
-------------------------------------------------------------------------------
💸💸💸💸💸💸
👇 👇 👇 👇 👇 👇
BITCOIN LOOKING STRONG AF!The increasing volume is a clear indication that buyers are stepping in and pushing the asset up. And it's not just any buyers, it's miners! The Hash Ribbons indicator is flashing a buy signal, which has been a historical indication of miner capitulation and big bull runs in the past. This is a rare and powerful signal, one that we haven't seen in a while. The asset has also just broken out of a descending wedge pattern, further confirming the bullish momentum. All these signs are pointing towards a potentially massive price movement in the near future. Don't miss out on this opportunity, the time to act is now!

Bitcoin short-term update - next targets 👀🐂🐻Bitcoin short-term update
(a) BTC reached and even broke my target of $22,210 easely👀
(b) next bullish target at $23,127🐂
(c) bearish target at $21,913🐻
Have a great day dear Crypto Nation😎
Let me know your thoughts in the comments🤗
⬇️⬇️⬇️
Likes and Follow for updates appreciated🤗
Disclaimer:
Not financial advice
Do your own research before investing
The content shared is for educational purposes only and is my personal opinion

IMPORTANT BTCUSDT SOON CRASH?,❗️IMPORTANT BTCUSDT SOON CRASH?,
On our 1 Hour timeframe chart, and
after forming a Head and Shoulders Pattern, we are currently consolidating on the trend that it has formed, broke a structure to the downside, right now we are currently retesting its POI (Point of interest)

BITCOIN Transition from a Wedge to an Inverse H&S showing 33.5k?Bitcoin (BTCUSD) is up +40% since the start of the year and did so by breaking above its former Falling Wedge pattern that was holding since the June 18 2022 Low. On this 1D time-frame, we see that there is a high probability of the Wedge break-out to transition BTC into the next pattern that could be an Inverse Head and Shoulders (IH&S).
Such patterns are technically market bottom formations and initiate sharp recoveries. Right now the price is forming the Right Shoulder and could range within it as it did on the Left Shoulder. The rise after the completion of the Head until Saturday's High is around +44%. After BTC breaks above its Right Shoulder, we can measure another +44% to find out the target of the IH&S pattern. At the moment that is a little over $33500.
By the time it reaches that level, it may coincide with a test of the all important 1W MA100 (green trend-line), which has been the last long-term Support that Bitcoin broke on May 06 2022.
If you are looking for confirmation of this move, keep an eye on the potential 1D Golden Cross (blue 1D MA50 crossing above the orange 1D MA200) and a break above the 1W MA50 (red trend-line), which has been untouched since April 05 2022.
So what do you think? Will we hit $33.5k that fast after the Inverse Head and Shoulders break? Feel free to let me know in the comments section below!
-------------------------------------------------------------------------------
** Please LIKE 👍, FOLLOW ✅, SHARE 🙌 and COMMENT ✍ if you enjoy this idea! Also share your ideas and charts in the comments section below! This is best way to keep it relevant, support me, keep the content here free and allow the idea to reach as many people as possible. **
-------------------------------------------------------------------------------
💸💸💸💸💸💸
👇 👇 👇 👇 👇 👇

BITCOIN - Using the CCI and RSI Indicators to Predict DumpsThis was a cool trick I learned a while back and I thought I would share. The Commodity Channel Index (CCI) is very similar to the Relative Strength Index (RSI), but the CCI tends to be more sensitive. As a result, the CCI tends to drop when there is weakness in comparison to the RSI and the divergence in the two indicators becomes evident. I've highlighted to previous instances when the CCI dropped significantly in comparison to the RSI. Had you seen this, you could have exited your position and saved yourself a lot of money. The CCI is currently showing a strong bearish divergence to the RSI, which may very well be a foreshadowing of a coming BTC dump. As a result, I'm going to be in USD to be safe until I see the direction the market decides to go. I hope this trick helps you as much as it has helped me.

BITCOIN ahead of 1st 1W Death Cross in history! End of rally?Bitcoin (BTCUSD) has started 2023 with a relentless +40% rally, completing a +50% rise from the November Low. But perhaps the biggest technical development of the upcoming days is the emergence of the Death Cross formation on the 1W time-frame. This is when the 1W MA50 (blue trend-line) crosses below the 1W MA200 (orange trend-line) and on Bitcoin in particular this will be the first such pattern in history.
It is inevitable and it will be formed in the next or 2 weeks maximum. Being a technically bearish formation, will it affect the price negatively and restore the bearish trend long-term? Well we need a examine a few more parameters in order to determine this.
** Up by 50% **
Like we said, BTC is up +50% from its November Low. Throughout in history, every time the price rose by +50% or more after hitting the 1W MA200, it was a Cycle bottom, with the exception of the January - March 2015 rise.
** The RSI > 60.000 factor **
The one condition however that when fulfilled, always indicates that the Cycle bottom is in, is when the 1W RSI breaks above 60.000 after hitting the 1W MA50. We can see that typically, those take place at the same time. The January 2020 break doesn't fall into that category as, not only did it take a once in 100 years event to crash the price (COVID lockdowns March 2020) but also BTC wasn't on a rally rebounding on the 1W MA200 (previous condition we set). As a result, the RSI > 60.000 is a Market Bottom rule.
** Where are we now? **
At the moment, the 1W RSI is at 56.520 and the 1W MA50 around 25620. As mentioned, we are in a peculiar spot, largely uncharted territory for Bitcoin ahead of this inevitable 1W Death Cross, as in addition this time the rebound is being done way below the 1W MA200 and not on it. However, a simultaneous RSI 60.000/ 1W MA50 break, being at more than +50% from the Low, checks all the boxes for being past a Cycle Bottom, effectively starting the 1st rally of the new Bull Cycle.
Do you think the 1W Death Cross has the power to eventually invalidate the Bull Cycle? Feel free to let me know in the comments section below!
-------------------------------------------------------------------------------
** Please LIKE 👍, FOLLOW ✅, SHARE 🙌 and COMMENT ✍ if you enjoy this idea! Also share your ideas and charts in the comments section below! This is best way to keep it relevant, support me, keep the content here free and allow the idea to reach as many people as possible. **
-------------------------------------------------------------------------------
💸💸💸💸💸💸
👇 👇 👇 👇 👇 👇

Bitcon BTCUSD - Possible Bullish moveBitcon is currenty respecting support level of 22500 . Possible movement is upto next resistance level as marked in the chart.
In second scenario , if support is broken, then next support level of 20800 is reachable in the coming days.
Chart will be updated daily based on the market movement.

Bitcoin - BTC next Fisher breakout ahead with trial no 6🟢❓Bitcoin
Next Fisher breakout ahead with trial no 6🟢❓
It might occur NOW🚨🚨🚨👀
March 2015 and 2019 those breaks led to a huge bullish run dear BTC and Crypto Nation 🐂😎
Let me know your thoughts in the comments🤗
⬇️⬇️⬇️
Likes and Follow for updates appreciated🤗
Disclaimer:
Not financial advice
Do your own research before investing
The content shared is for educational purposes only and is my personal opinion

Bitcoin short-term update - BTC in rising triangleBitcoin short-term update
(a) BTC with a perfect bounce at my drawn price resistance at $21,595👀
(b) bullish breakout of rising triangle would lead us to target $22,210🐂
(c) bearish breakout and we meet 2017 ATH at $19,892🐻
Let me know your thoughts in the comments🤗
⬇️⬇️⬇️
Likes and Follow for updates appreciated🤗
Disclaimer:
Not financial advice
Do your own research before investing
The content shared is for educational purposes only and is my personal opinion

BITCOIN 1D Important ResistanceAccording to the chart, the upward trend has reached an important resistance range, if it does not break this area, the downward trend will continue, otherwise we expect the price to increase to $24,000.
Its not Buy or Sell SIGNAL
DYOR
BY : M.TeriZ - @AtonicShark

BITCOIN's Adam & Even was spot on! What to look for next.Bitcoin's (BTCUSD) rise last week took many by surprise but what few noticed is that it basically made the theory into practice. The application of the Adam and Even (A&E) pattern that started forming since the November FTX crash went under the radar but was spot on with its target.
As you see Wednesday's peak wasn't just a consequence of the 21500 Resistance that was formed by the November 05 top but also completed a +18.00% rise from the December 14 High, which was a proportional rise (18%) from the November 21 Low. Like we said, the application couldn't have been more precise!
So what to look for right now? Well BTC is now sideways and about to test the 4H MA50 (blue trend-line) for the first time since January 06. A break can seek the 4H MA200 as its last Support. You should look for confirmations that will either lead to that correction or the extension of the rally.
First keep an eye on the 4H MACD. A Bullish Cross will be a signal to buy into round 2 of the rally. The 4H RSI has a clear Higher Lows trend-line as its Support and a Lower Highs trend-line is leading it there. A break above the Lower Highs earlier, will again be a buy signal.
-------------------------------------------------------------------------------
** Please LIKE 👍, FOLLOW ✅, SHARE 🙌 and COMMENT ✍ if you enjoy this idea! Also share your ideas and charts in the comments section below! This is best way to keep it relevant, support me, keep the content here free and allow the idea to reach as many people as possible. **
-------------------------------------------------------------------------------
💸💸💸💸💸💸
👇 👇 👇 👇 👇 👇

Bitcoin Stalling At Key Resistance... Or Is It The "NEWS?If you've been trading and investing long enough... (For me 25 years)
You know that the 'News' conveniently gets released, to support market moves that have already happened.
Not always, but more often than not.
This news headline today makes me laugh, because we clearly shot up to technical resistance.
People who say TA 'Doesn't Work' also make me laugh, because TA is the visualization of the news being disseminated (Usually before it reaches the public).
That, and the group psychology of the masses, or the 'Composite Man' as Richard Wyckoff originated.
We caught that nice market pump over the past week and a half, and it doesn't take a brain surgeon to see that we're due for a short-term pullback.
Likely then bouncing higher, along with the stronger Weekly cycle.
But of course, it's all about the news and fear surrounding the 'rates and DOJ action'...
Which of course gets priced in almost in real-time, once the bigger players, whales and hedge funds get this information first.
Who else has watched the Netflix show Billions?
"Are you certain?"
"I am not uncertain"
The world of investing...

Bitcoin and the Philly Fed Manufacturing Indexive 🔴☑️⭐️🟢Update
Bitcoin and the Philly Fed Manufacturing Index
possible bullish scenario when...
1. Index is negative🔴☑️
2. Index breaks trendline⭐️
3. enjoy the BTC bull run🟢
Today bad value -13.8⬆️more patience necessary🚨
Let me know your thoughts in the comments🤗
⬇️⬇️⬇️
Likes and Follow for updates appreciated🤗
Disclaimer:
Not financial advice
Do your own research before investing
The content shared is for educational purposes only and is my personal opinion

BITCOIN The Bollinger Bands delivered when no-one expected!Exactly 2 months ago right after the FTX aftermath, we posted an alternative analysis using a not so popular indicator, the Bollinger Bands Width (BBW):
For a broader perspective, that was in combination with the Fib MAs as the MA350 (green trend-line) offered Support. As this held and the BBW rebounded, we mentioned then (which was a time of fear and panic in the market) that this was a sign of a bottom formation, similar to all prior Cycles (indicated by the circles).
The BBW delivered this beautifully and now Bitcoin has broken all the Bear Cycle Resistances and has technically entered its new Bull Cycle.
This time we add a few extra elements to the BBW. Number (2) is where the BBW starts to rise and picks, which officially starts the first rally of the Cycle. This means that you should keep an (very) close eye to the BBW in the next few weeks, as a potential surge will be the 2nd best buy entry that the new Bull Cycle will offer.
Are you waiting for this or any other signal to buy or are have you already in? Feel free to let me know in the comments section below!
-------------------------------------------------------------------------------
** Please LIKE 👍, FOLLOW ✅, SHARE 🙌 and COMMENT ✍ if you enjoy this idea! Also share your ideas and charts in the comments section below! This is best way to keep it relevant, support me, keep the content here free and allow the idea to reach as many people as possible. **
-------------------------------------------------------------------------------
💸💸💸💸💸💸
👇 👇 👇 👇 👇 👇

BTC - First target reached, what's next ?So far, BTC moved (almost) where we expected
First target was 19k5 (200 daily MA) so maybe we will be able to see another leg up before some kind of retracement.
Moving out the channel we are would be a good signal (upper black line)
Our target is still 24k from my last post
16k must hold

We’ve bottomedI copied the chart from the 2012 halving to the 2016 halving which is what you see above the current chart. I also copied the area between the 2016 halving and the 2020 halving which is what you see under the current chart. I then placed them exactly at the start of the 2020 halving and stretched them to the next approximate date of the next halving. Done.
Yes, it can be this simple. No fancy trend lines or over-analyzing the chart. As the old saying goes, “History doesn’t repeat, but it does rhyme.” I’m sure everyone is sick of hearing it, but it’s true. See you at the top.

BITCOIN Three mega rally indicators flashing green all at once!This is not the first time we look at Bitcoin (BTCUSD) on the 3D chart , but it is the first time that three major trend indicators all give a big long-term buy signal at the same time:
1) The Super Trend indicator, which we have used extensively to maintain perspective during the Bear Cycle, just waved a green flag for the first time since December 2021.
2) The price broke inside the Ichimoku Cloud for the first time since December 27 2021.
3) The Mayer Multiple broke above its MA period for the first time since November 2021.
The last times all those indicators aligned their buy parameters at the same time was at the end of Bear Cycle bottom sequences, right before the first rally of the new Bull Cycle started: January 04 2012, July 09 2015, April 04 2019 (note Mayer MA data don't data before September 2012)).
This mix of green flashes make up a strong buy signal for the long-term and the real question now is how aggressive this new first rally of the new Bull Cycle will be. Will it be as aggressive as April - June 2019 or February - August 2012 or less aggressive as August - November 2015?
Feel free to let me know in the comments section below!
-------------------------------------------------------------------------------
** Please LIKE 👍, FOLLOW ✅, SHARE 🙌 and COMMENT ✍ if you enjoy this idea! Also share your ideas and charts in the comments section below! This is best way to keep it relevant, support me, keep the content here free and allow the idea to reach as many people as possible. **
-------------------------------------------------------------------------------
💸💸💸💸💸💸
👇 👇 👇 👇 👇 👇

Bitcoin & DXY weekly - EMA20🟢🔴Bitcoin weekly needs to stay above EMA20 with constant bounces🟢while DXY should get rejected 🔴and find another leg down👀
That might lead to a bullish rally 2023
Let me know your thoughts in the comments🤗
⬇️⬇️⬇️
Likes and Follow for updates appreciated🤗
Disclaimer:
Not financial advice
Do your own research before investing
The content shared is for educational purposes only and is my personal opinion

BITCOIN rhymes perfectly with previous Cycle bottoms. 25k next!Bitcoin (BTCUSD) on Friday above its 1D MA200 (orange trend-line) for the first time since December 31 2021, which is the level we have rendered all this time as the one that will start the new Bull Cycle. On this analysis on the 1D time-frame, we compare BTC's current Cycle bottom to those of 2018/19 and 2014/15.
As you see, during those Bottoms, when the price broke above the 1D MA200, it quickly hit the 1W MA50 (red trend-line) within 3-4 weeks, always having the 1D MA50 (blue trend-line) as Support. On the April 02 2019 1D MA200 break-out in particular, the 1D RSI hit the 89.00 level before retracing, just as it did today. These RSI retracements don't indicate trend reversals, just a re-balancing of the enormous buying pressure.
It is interesting to add that on both previous bottoms, the 1W MA50 was hit on a Resistance level (red zone) made by a previous Lower High during the Bear Cycle. This time the strongest candidate for this level appears to be 25300 (August 15 2022 Lower High).
What could happen after that? Well, as long as the 1D MA50 supports, Bitcoin can continue the rally past the 1W MA50, as it happened in May-June 2019. A break below the 1D MA50 though, could deliver one last major pull-back to the 19k-20k or even 17k supply zones, similar to what happened on August 2015.
Feel free to let me know in the comments section below!
-------------------------------------------------------------------------------
** Please LIKE 👍, FOLLOW ✅, SHARE 🙌 and COMMENT ✍ if you enjoy this idea! Also share your ideas and charts in the comments section below! This is best way to keep it relevant, support me, keep the content here free and allow the idea to reach as many people as possible. **
-------------------------------------------------------------------------------
💸💸💸💸💸💸
👇 👇 👇 👇 👇 👇
