BITCOIN Happy New Year! 2023 the Year of Recovery?First and foremost on this second trading day of 2023, the TradingShot team would like to wish everyone on this community a Happy New Year, may each and everyone's goals be achieved!
2022 ended, took a whole of negative fundamentals with it (war, LUNA, FTX) and closed the yearly candle in (deep) red. As you see on this 12M (12 month) time-frame, Bitcoin (BTCUSD) had another two red 12M candles throughout its history and naturally those were the Bear Cycle years. Three green yearly candles followed after 2014 just as another three after the 2018 Bear Cycle candle.
Technically, the year that follows the red 12M candle is a recovery candle that hits and closes around the 1W MA100 (yellow trend-line). That level is currently at 37627.10 and running flat (sideways). Do you expect history to repeat itself following the 2022 Bear Cycle candle and close 2023 around $37k before the Bull Cycle really takes off?
Feel free to let me know in the comments section below!
-------------------------------------------------------------------------------
** Please LIKE 👍, SUBSCRIBE ✅, SHARE 🙌 and COMMENT ✍ if you enjoy this idea! Also share your ideas and charts in the comments section below! This is best way to keep it relevant, support me, keep the content here free and allow the idea to reach as many people as possible. **
-------------------------------------------------------------------------------
You may also TELL ME 🙋♀️🙋♂️ in the comments section which symbol you want me to analyze next and on which time-frame. The one with the most posts will be published tomorrow! 👏🎁
-------------------------------------------------------------------------------
💸💸💸💸💸💸
👇 👇 👇 👇 👇 👇
Bitcoin-btcusd-btc

BITCOIN, Wyckoff Dynamics to Setup HUGE ALTERATION!Hello Community,
the year 2022 has finished and the start of 2023 has been initiated. The year 2022 was a year of extremely volatile market conditions showing the results of a longer series of economic events like fallouts in supply chains and partial sectors on the verge of a completely new way of overthinking their place in the economy causing the financial markets to reiterate the positions of assets and showing massive disruptions within the financial markets and so also in the cryptocurrency market, huge chain-reaction events triggered massive volatility within the markets and caused the central banks to intervene against inflationary pressures spreading with the roots in several factors which fuel the heavy inflation like energy shortage, monetary expansion, and supply chain disruptions. And in all of this market turmoil remain Bitcoin and the Cryptocurrency market while the price action was highly volatile with many peaks and valleys continuously through the year 2022 the technological adoption and preparedness of Bitcoin and Cryptocurrency to be adopted on a mass scale have not declined to pre-levels seen before 2022. Now with these given factors established in 2022 the question of how the dynamics will develop through the next times moving forward into 2023. With this lineup, it is preeminent to consider the technical analysis components as I have done it in my Wyckoff analysis put together the puzzle pieces of fundamentals and market behavior in the visual element of technical price action.
In my chart, you can watch the underlying Wyckoff dynamics within the Bitcoin price action and I am going to discuss them in the following, where Bitcoin is standing now out of the Wyckoff perspective and what movements are likely to be expected when applying the Wyckoff projections during the current market phase.
Completed Phases
Phase A:
Within the first phase of the Wyckoff accumulation dynamics to be watched with Bitcoin massive selling pressure hit the market and Bitcoin moved into important support zones to first establish the PS- Preliminary Support point where Bitcoin moved into previous supports and an initial inner price action bounce has showed up indicating that the area between $19,500 and $20,500 can be a good point of support for a potential reversal. Once Bitcoin completed the PS Bitcoin moved into the final SC- Selling Climax point where the most selling pressure in the whole structure unloaded in the price action and Bitcoin reached the initial low of $17,700 from where the first bounce emerged. Now the AR- Automatic Rally was driven by investor's and trader's silver lining to see a fast and strong recovery in the whole cryptocurrency market and a relief rally because of faster Web3, Metaverse, and NFT adoption and developments, this rally has been partially fulfilled with some solid volume coming in to establish new highs that preceded the PS lows.
Phase B:
The second phase B has been the phase in which the market literally prepared on the FTX collapse that caused Bitcoin and Cryptocurrencies to dump sharply. The significant factor here is the 40- Moving Average of Bitcoin because the price action the whole time stayed below the 40-MA marked in blue in my chart this was the first important indication for Bitcoin to dump more sharply as Bitcoin did not managed to form new highs and indeed this was also a difficult time as the market also struggled because of the Luna, Celsius, and Voyager Digital crashes aftereffects. And then the final trigger for the massive dump and sharp decline to the downside has been the final FTX collapse with the information of misuse of customer funds in the FTX exchange the market reacted immediately on this news and Bitcoin as well as the whole Cryptocurrency price plummeted heavily to initiate the phase C in the Wyckoff accumulation dynamic.
Phase C:
This is the most determining phase in the whole Wyckoff accumulation dynamic to watch in my Bitcoin price chart because after the heavy FTX collapse the market managed to hold crucial support below the previous support level at the $15,500 zone and do not break below this level which was an important sign of strength within the market and Bitcoin showing that there is still potential for a reversal after the market crashes. while data showed that Bitcoin holders accumulate further Bitcoin and smart money market operator's open interest also increases in Bitcoin this caused the main stabilization in this area and Bitcoin initially rallied to test the previous support which is now still resistance at the $18,000 level. what is important in this phase C is also that right after the market crashed major volume moved into the market and caused the initial price rally, higher volume at such lower prices is always an central indicator of price stabilization.
Upcoming Phases
Phase D1:
Now as Bitcoin initiated the final test of the spring which is the most determining part of the whole Wyckoff accumulation dynamic this is a phase where Bitcoin is finally in the end-stage of the decision phase and when Bitcoin managed to bounce in this test area again and show a solid support dynamic from where Bitcoin breaks out above the $18,200 level this will be the sign that Bitcoin has the abilities to continue further and finish the whole Wyckoff accumulation dynamic as it is appropriate. Also a really paramount factor, in this case, will be the fact that when Bitcoin bounces above the $18,200 level this will be a setup from where Bitcoin also bounced above the 40-MA marking a final reversal of the 40-MA as the resistance and confirming it as support. With this setup, Bitcoin will provide the final cornerstone of a further completion of the whole Wyckoff accumulation dynamic.
Phase D2 and Phase E:
As phase D is the phase in which Bitcoin shows the final completion of the whole accumulation the second stage of phase D is where the initiation process into a new volatility area is going to emerge. Once Bitcoin has finalized the test and the breakout above the $18,200 zone together with the 40-MA this will be the point where Bitcoin is likely to bounce above the $21,400 resistance and above this area forming an LPS- Last Point of Supply in which Bitcoin will have good chances to stay above the previous resistance and confirm it as support, also a goos factor, in this case, will be when Bitcoin increases the volume moving forward to offer a final bounce into the upper areas and showing an SOS- Sign of Strength in which the volatility, price action, and volume should bounce massively to complete the whole Wyckoff accumulation with the final breakout into the phase E and continuation of the established positive trend dynamics.
Now as I described the underlying factors of the Bitcoin Wyckoff accumulation dynamics going on here we can already see that Bitcoin is moving into a really interesting and amazing decision phase in which Bitcoin will decide if the ability to convert into a massive expansion potential despite seemingly negative macroeconomic developments will unfold again as it happened several times in the past. What has to be mentioned is that this is not the first time Bitcoin is in such a market phase and it always turned out to be a silver lining as Bitcoin and the Cryptocurrency market always managed to come back stronger as established before and return to new heights. Especially as inflation is on a way to lower levels than established during 2022 and the FED looking to slow down more aggressive rate hikes this has good potential to be an additional positive factor contributing to the fact that Bitcoin completes the Wyckoff accumulation dynamic as it is projected. I am going to monitor the dynamic and see how the developments move in the further trading sessions.
In this manner, thank you everybody for watching. Hopefully, everybody of you had a good start to the New Year of 2023 and in this manner let us move into the New Year together and celebrate a New Year also for Bitcoin and Cryptocurrency.
The information provided is only educational and should not be used to take action in the markets.

BITCOIN always rallied when these 3 indicators alignedThis is our last Bitcoin (BTCUSD) chart for 2022 and brings together the CN10Y (purple line), the U.S. Dollar Index (green trend-line) and the LTCBTC pair (orange trend-line). We've mentioned countless times in the past the importance of the DXY on Bitcoin and the strong effect that Litecoin (LTC) has as a leading indicator. Recently we've also made cases of the strong correlation of China's Bond Yields with BTC.
This cross study brings together all three and compares their price action against BTC. As you see, since BTC's early days, every time the CN10Y made a V-shaped reversal and started to rebound breaking its Lower Highs trend-line, while the DXY started to fall after a rejection on its Higher Highs trend-line and the LTCBTC pair broke above its Falling Wedge, Bitcoin was in the early stages of a hyper aggressive rally.
With the stock markets not at their best but having posted a 2 month recovery, while the cryptocurrency market's credibility viciously hammered by the FTX and LUNA collapses, will this strong 3 indicator emergence be enough to put Bitcoin back into long-term bullish territory?
Feel free to let me know in the comments section below!
-------------------------------------------------------------------------------
** Please LIKE 👍, SUBSCRIBE ✅, SHARE 🙌 and COMMENT ✍ if you enjoy this idea! Also share your ideas and charts in the comments section below! This is best way to keep it relevant, support me, keep the content here free and allow the idea to reach as many people as possible. **
-------------------------------------------------------------------------------
You may also TELL ME 🙋♀️🙋♂️ in the comments section which symbol you want me to analyze next and on which time-frame. The one with the most posts will be published tomorrow! 👏🎁
-------------------------------------------------------------------------------
💸💸💸💸💸💸
👇 👇 👇 👇 👇 👇

Bitcoin mid-term view - watch out for $16,960 and $16,530🚨🚨$16,960 and $16,530🚨🚨
THAT are THE nearest mid-term volume profile levels to watch out for dear Bitcoin and Crypto Nation
That simple - that clear‼️
If we fall below further huge BTC discount might come into play💸
Let me know your thoughts in the comments🤗
⬇️⬇️⬇️
Likes and Follow for updates appreciated🤗
Disclaimer:
Not financial advice
Do your own research before investing
The content shared is for educational purposes only and is my personal opinion

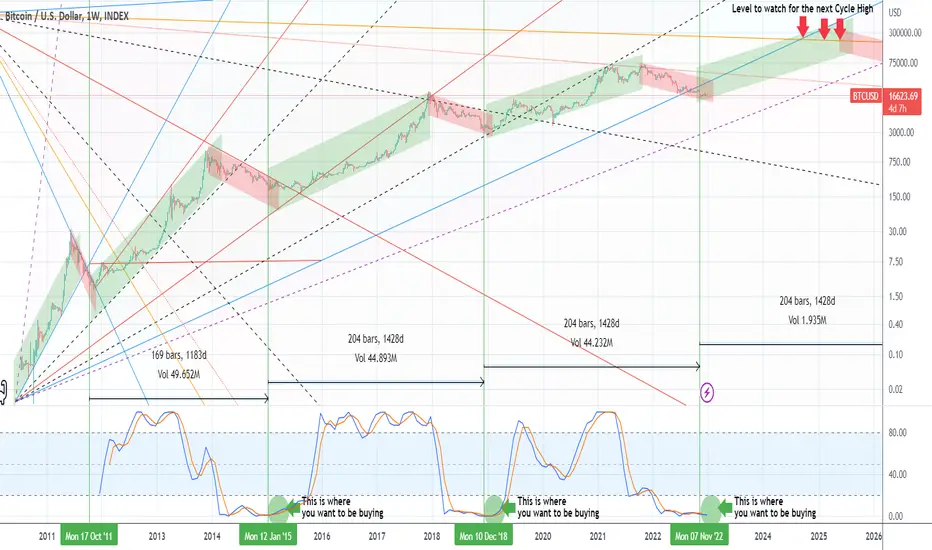
BITCOIN The complete Cycle mapping. Will you miss out on this?This is Bitcoin (BTCUSD) on the 1W time-frame. The current and past Cycles have been classified into Bull (green Channel) and Bear (red Channel). With an (unorthodox) use of the Pitchfan we identified the key trend-lines that have historically shaped both Bull and Bear Cycles and might continue to do so in the future.
The recent Bear Cycle has been driven by the 0.7 Pitchfan F (dotted). The new Bull Cycle should evolve around the 1.0 PF (solid blue) as the last two have mostly traded below their respective lines but peaked exactly after hitting them. This is of particular interest to us as the 1.0 (Bull Cycle) blue line leads to the 0.8 (Bear Cycle) orange line. Long-term investors should consider their crossing as the High of the next Bull Cycle may form there.
As to when to buy? Well where couldn't be a better time than now. The recent FTX low has been 1428 days since the bottom of the 2018 Bear Cycle, which is the exact same time as it took itself from the previous (2014) Cycle. Moreover the STOCH RSI is at the level where BTC historically bottomed and started the new Bull Cycle.
Do you think this is a unique long-term buy opportunity for Bitcoin and if so can the next top be near 200k? Feel free to let me know in the comments section below!
-------------------------------------------------------------------------------
** Please LIKE 👍, SUBSCRIBE ✅, SHARE 🙌 and COMMENT ✍ if you enjoy this idea! Also share your ideas and charts in the comments section below! This is best way to keep it relevant, support me, keep the content here free and allow the idea to reach as many people as possible. **
-------------------------------------------------------------------------------
You may also TELL ME 🙋♀️🙋♂️ in the comments section which symbol you want me to analyze next and on which time-frame. The one with the most posts will be published tomorrow! 👏🎁
-------------------------------------------------------------------------------
💸💸💸💸💸💸
👇 👇 👇 👇 👇 👇
Will #BTC see 9K to 12K or What ?By examining Bitcoin in the Weekly TF (Logarithmic), we can see that the price has created an FVG that caused by a liquidity void in the last week with a sharp fall and penetrated to the 50% fibo level of the bullish rally of the last 2 years! There is a medium-term scenario that increases the possibility of the price falling to the levels of $11,600 and $9,000, but be careful, this scenario will not be activated until the price consolidates below $15,500! The next scenario is an upward movement to $20,000 as the first target, the condition of this short-term scenario is the formation of a weekly Bullish candle in the current week! All other important things are more clearly on the chart!
Follow me for more analysis & Feel free to ask any questions you have, I'm here to help.
⚠️ This Analysis will be updated ...
👤 Arman Shaban : @ArmanShabanTrading
📅 11.15.2022
⚠️(DYOR)
❤️ If you apperciate my work , Please like and comment , It Keeps me motivated to do better ❤️

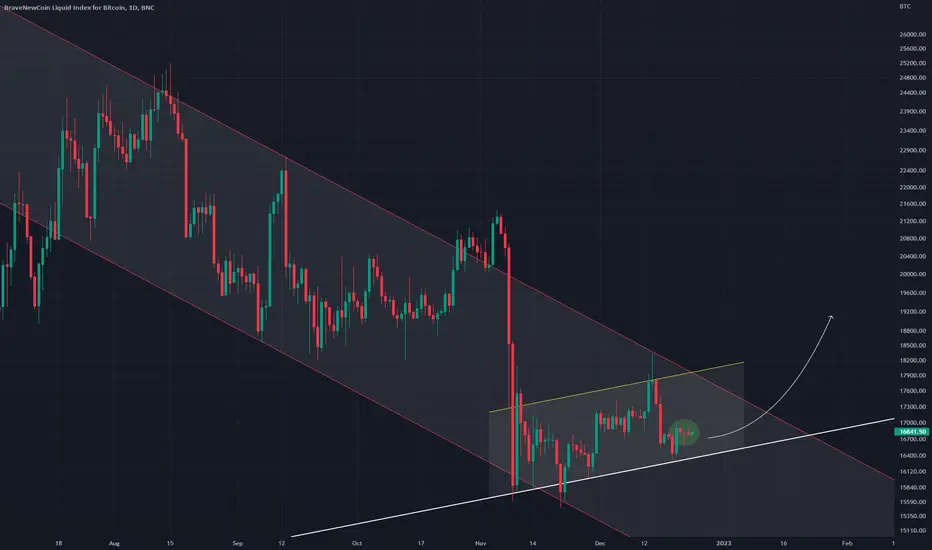
BTC - 1D Not bullish yetThe BTC Price broke the support zone, but it didn't fall a lot. So, the selling pressure is reducing, it hasn't finished though.
That resistance zone is quite important. If it breaks upward, the next bull run will be more likely.
Bitcoin Weekly RSI AnalysisI see a pattern in RSI crossing RSI's Moving Average.
In 2018, there were 5 Down Crosses before bottom was in. After the last down cross, BTC went down 50%.
In 2022, 5th Down Cross happened on 5th Dec, 2022. We can expect a similar move.
Let's see how this goes.

Bitcoin short-term view - $16,960 insurmountableBitcoin short-term update
(a) BTC still hanging below $16,960 - FIB golden pocket - SMA+EMA
(b) bearish visit of $16,530 get's likely IMO🐻
(c) bullish bias when breaking $16,960 - target $17,500🐂
Let me know your thoughts in the comments🤗
⬇️⬇️⬇️
Likes and Follow for updates appreciated🤗
Disclaimer:
Not financial advice
Do your own research before investing
The content shared is for educational purposes only and is my personal opinion

BTCUSD trading planThe pattern is set, waiting to break out. But this will not be happening soon.
Trading volume and movement are likely to continue being low. On the economic calendar, there is not much worth mentioning.
In my opinion, BTC will stay in this range for a while, or maybe the same as yesterday, at 16k9. Nothing changed with BTC. Still, the price structure points toward lower prices. But as we know, in the crypto market, price action could go very unpredictable, so it is not worth the risk. Are we at the bottom yet? Yes, we might be, but it could go lower and lower. One thing is for sure, we are closer to the bottom than ever, and I still have my bet on the 12-13k. The best advice I can give here is to stay off the market for a while.
At this time of the year, we should sit down and reflect on what we have learned.
Me, I have learned three things:
1. Never predict or forecast what will happen, no one knows the future. All we can do is list the possibilities and plan to act when the situation arises.
2. Minimize distraction and Focus on what is important, whether it is a trend, a piece of news, or a fundamental.
3. Love the process, even if you are losing some money or even when the price did not move at all. Trading is a journey, the soon you learn to love the journey, the happier you will be.
I wish you and your family a happy holiday, stay safe. Peace.

Bitcoin Holiday: 3 Suggestions.While my swing trade short idea in Bitcoin has not reached its break even stop since I suggested the adjustment, I have suggested that people in the position close it at market (16,850 area at the time). While the profit (approx +755) was not able to justify the risk, it is better to mitigate risk rather than hope for big wins in this environment. In other words, if its green, and a conflicting signal shows up, take the money and run.
The conflicting signal came earlier in the week (large green candle) which missed my profit target by less than 100 points. I have been warning followers about the type of price action to expect around weeks three and four of December. A lot of nothing and that is what we are getting.
Here is what else I suggest around this time of year:
1. AVOID the nonsense forecasts and irrelevant opinions about where markets will be in the future. If you haven't learned your lesson from the same nonsense that we were seeing a year ago, then I don't know what to tell you. NO ONE knows the future (unless you are an insider). Technical analysis sheds light on some possibilities maybe a few weeks out, maybe a month at best.
2. FOCUS on information and events that are FACTUAL. For example, we know that in January, a new senate will take over in the U.S. This means it is reasonable to expect some changes in legislation. What exactly I don't know. We also know the regulatory agencies will be very active this year, they were very public about their intentions. We also know there will be events and preparations for the next U.S. presidential election. These things can affect markets.
3. Use this quiet time to plan your investments and educate yourself more about how the industry works. Learn to account for risks and stop chasing dreams. There is no such thing as fast money in this game. Those who believe the "images" of this lifestyle are ignorant. Stop focusing on gimmicks, charting, etc, and instead take the time to consider where you fit in from the industry perspective. The sooner you figure this out, the better you will be able to judge the information that you are constantly presented with.
Over the next week, volume and activity is likely to continue to be light. There's not much on the economic calendar even worth mentioning. I suggest taking the time off, ESPECIALLY if you are on smaller time frames. While NOTHING has changed in Bitcoin, price structure still points to lower prices. Without a catalyst though, price action can be VERY random and full of false movements. It's not worth the risk and BETTER to WAIT for an environment that can drive prices with more momentum.
Thank you for considering my analysis and perspective. I sincerely wish you a happy holiday and hope you enjoy with your families. Thank you for being a great community and for your support.

Bitcoin Reversal Hopes BLX trend line in solid white that needs to hodl for price to reverse to the upside
If this structure breaks down and it is no longer a higher low price may continue downward within the channel
Hopes
Bitcoin🟠and the Trimmed Mean PCE⚫️inflation rate👀The Trimmed Mean PCE inflation stable
See the reverse of Bitcoin🟠and the Trimmed Mean PCE⚫️inflation rate👀
Do we see the next Top in PCE and a following #bullish momentum for BTC dear Crypto Nation😎
Let me know your thoughts in the comments🤗
⬇️⬇️⬇️
Likes and Follow for updates appreciated🤗
Disclaimer:
Not financial advice
Do your own research before investing
The content shared is for educational purposes only and is my personal opinion

Bitcoin short-term view - and Marry Christmas 🎅Bitcoin short-term update
(a) BTC still in the range between $16,530 - $16,960
(b) bearish if we break below
(c) bullish if we break above
That simple - don't expect that during Christmas dear Crypto Nation
Have a great time🤗😎🎅
Let me know your thoughts in the comments🤗
⬇️⬇️⬇️
Likes and Follow for updates appreciated🤗
Disclaimer:
Not financial advice
Do your own research before investing
The content shared is for educational purposes only and is my personal opinion

BITCOIN 3D Bearish Pattern UpdateAccording to the chart, the important downward support area has been broken in the 3-day time frame, and if we lose the support area, we expect a fall. Otherwise, to reverse the upward trend, it is necessary to break the upward trend line.
Its not Buy or Sell SIGNAL
DYOR
BY : M.TeriZ - @AtonicShark

Bitcoin short-term view - cloud of resistancesBitcoin short-term update
(a) BTC with a short break below $16,530 but back at FIB golden pocket again
(b) bullish if we break the resistance cloud (trendline + SMA + EMA + $16,960) will be hard to achieve IMO
(c) bearish at lower lows
Have a great Day dear Crypto Nation
Let me know your thoughts in the comments🤗
⬇️⬇️⬇️
Likes and Follow for updates appreciated🤗
Disclaimer:
Not financial advice
Do your own research before investing
The content shared is for educational purposes only and is my personal opinion

BITCOIN 30MIN next move According to the chart, if the support zone is broken, we will have more fall in the next hour, and otherwise, an increasing trend will be formed.
Its not Buy or Sell SIGNAL
DYOR
BY : M.TeriZ - @AtonicShark

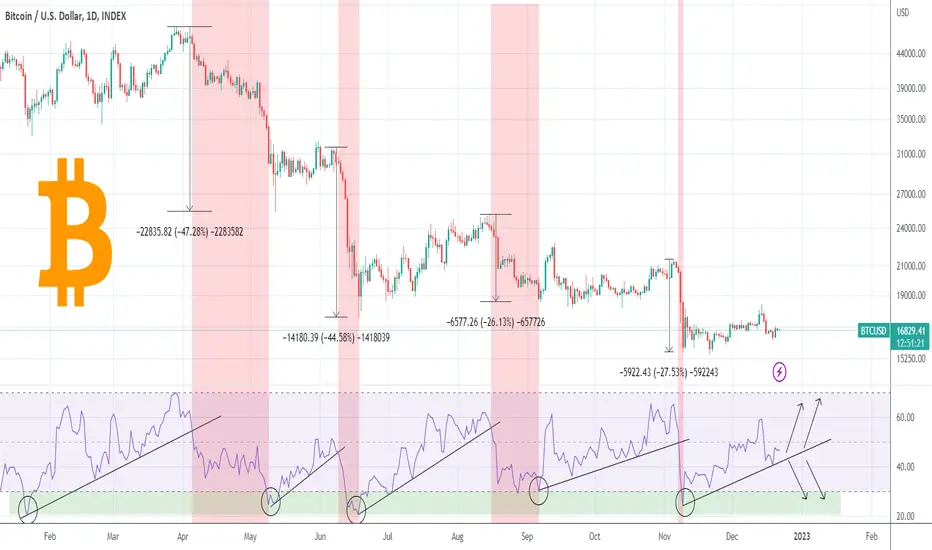
BITCOIN The RSI is the key and is hanging from a thread.Bitcoin (BTCUSD) on the 1D time-frame is consolidating while the RSI just bounced on its Higher Lows trend-line that started after the FTX crash (November 09). This is as tight as it can get in terms of a Support as throughout the whole year, when the RSI broke below its Higher Lows, the price dropped aggressively (red zones).
Right now we are on a hold or break point. Do you think this pattern will continue and a break below the RSI Higher Lows will deliver a new drop of at least -26% (that would push the price to around 13500) or this time is different?
Feel free to let me know in the comments section below!
-------------------------------------------------------------------------------
** Please LIKE 👍, SUBSCRIBE ✅, SHARE 🙌 and COMMENT ✍ if you enjoy this idea! Also share your ideas and charts in the comments section below! This is best way to keep it relevant, support me, keep the content here free and allow the idea to reach as many people as possible. **
-------------------------------------------------------------------------------
You may also TELL ME 🙋♀️🙋♂️ in the comments section which symbol you want me to analyze next and on which time-frame. The one with the most posts will be published tomorrow! 👏🎁
-------------------------------------------------------------------------------
💸💸💸💸💸💸
👇 👇 👇 👇 👇 👇
Bitcoin, 15minOur priority scenario in Bitcoin is the rise in wave b to $17300-17500. It is very important how the movement will develop at these levels. In case of growth above $17,500, our markup will change.

BITCOIN Has a mountain to climb but theres light down the tunnelIndeed Bitcoin (BTCUSD) is far from being at its best shape as not onlt was it rejected last week on the 2D MA50 (blue trend-line) but the RSI did so also on a Resistance Zone holding since last March.
The pattern since the June low is a Falling Wedge and that won't seen to be able to break to the upside unless the price breaks above the 1D MA200 (red trend-line) which by the first week of January should enter the Falling Wedge. Only then, after breaking this trend-line that has been intact since December 31 2021, can we expect Bitcoin to turn bullish long-term. Until then, the top (Lower Highs trend-line) of the Falling Wedge poses as the next rejection point/ Resistance.
The only indication showing that there may be light down the tunnel for Bitcoin is the U.S. Dollar Index (DXY). This has been dropping significantly since September 26 and even though as you see on the chart they have a negative correlation, Bitcoin broke this after the FTX crash. With the Dollar continuing to drop, it would appear that when the crypto market gets past this fundamental effect of fear and uncertainty it left, it will shoot up aggressively to cover the lost ground to the upside.
Do you think the market is far from getting back to normal again and capitalize the Dollar drop? Feel free to let me know in the comments section below!
-------------------------------------------------------------------------------
** Please LIKE 👍, SUBSCRIBE ✅, SHARE 🙌 and COMMENT ✍ if you enjoy this idea! Also share your ideas and charts in the comments section below! This is best way to keep it relevant, support me, keep the content here free and allow the idea to reach as many people as possible. **
-------------------------------------------------------------------------------
You may also TELL ME 🙋♀️🙋♂️ in the comments section which symbol you want me to analyze next and on which time-frame. The one with the most posts will be published tomorrow! 👏🎁
-------------------------------------------------------------------------------
💸💸💸💸💸💸
👇 👇 👇 👇 👇 👇

NASDAQ100 equal Bitcoin equal NASDAQ equal BTC 👀👀NASDAQ100 equal Bitcoin equal NASDAQ equal BTC 👀👀
Both assets at the important FIB golden pocket on the 12 hourly chart🚨
Will we see a support rejection soon dear Crypto Nation❓
Give ♥️ if you ♥️
Let me know your thoughts in the comments🤗
⬇️⬇️⬇️
Likes and Follow for updates appreciated🤗
Disclaimer:
Not financial advice
Do your own research before investing
The content shared is for educational purposes only and is my personal opinion

Bitcoin and the $16,500 mark👀Bitcoin and the $16,500 mark👀
Not only an important price level on my current short-term charts I share with you
Look at the BTC reaction 2 YEARS ago👀🚨
A daily close above the yellow wick limit line would excite me - you to dear Crypto Nation❓
Let me know your thoughts in the comments🤗
⬇️⬇️⬇️
Likes and Follow for updates appreciated🤗
Disclaimer:
Not financial advice
Do your own research before investing
The content shared is for educational purposes only and is my personal opinion

Bitcoin shorting opportunity This is a BTC shorting opportunity with target at 6700/6800.
Reasons that I follow:
1) 3M macd negative crossover and stochastic negative crossover heading is pointing towards a large range sideways move.
2) 1M macd negative is below signal line and below xero line. Stochastics in oversold zone.
3) 1w macd in negative territory does not reap any bullish signs of buying sentiment.
4) prices is below all averages on D,w.
5) many FUD news on the block.
