Bitcoin: New Sell Signal 20,250.Bitcoin played catch up over the previous week and went from what appeared to be relatively weak to a dramatic short squeeze that has tested the low 21K area (thanks to a strong S&P). Is the bottom in? Are you going to be lured into this "bull market" as a result of the emotional appeals made by all of your favorite fake gurus? Before you succumb to the fear of missing out, here are some points to think about.
I keep repeating this regularly: NOTHING has changed on the economic front in terms of technical levels or structure. Interest rates appear to be poised to continue to rise and the Dollar appears to be at a range low support within a bullish trend on the larger time frames. As long as this trend stays intact, rallies (in Bitcoin or S&P) have VERY LIMITED potential. Markets are irrational, especially bear market rallies. Buying into a resistance level after a bear market rally is a low probability behavior.
Resistance levels tend to stick in a bear market. Notice Bitcoin now: there is a sell signal that is active from 20,250, followed by another sell signal potentially developing (current candle), in a location (failed high resistance area) where selling activity is likely to appear. The 18,500 area (a support) was less than ideal to be looking for shorts, but 21K is the ideal location in terms of probability and reward/risk. If the lower high is established, then the lower low is more likely to follow (concept of price structure).
Keep in mind, it is important to consider the argument from both sides. As the market provides new information, it is possible that the current bearish argument can lose merit. This is why it is important to maintain an open mind, but to evaluate information OBJECTIVELY, not emotionally. IF Bitcoin can clear 22K, and establish a clear higher low, then the 25K resistance becomes a reasonable expectation. IF NOTHING changes in terms of rates and the Dollar, it is important to note that even upon a more dramatic bullish move, its sustainability is low. At some point the economics will change and begin to favor bullish outcomes, but until the evidence is clear, it is better to be in line with the market intent. Bitcoin does not carry the same weight as the bond market, it is a follower.
I recently shared a short signal from 18,850 that got stopped out. I have since shared a new short signal based on the break of 20,250. The first signal was aggressive because of the less than ideal location. The second signal is the higher probability or more ideal location for such a position. There is NO WAY to know if this trade idea will play out (I do not short Bitcoin, but I share the signals). It is based on the probability of the location which is more favorable compared to a support level. This is also affected by the S&P and Nasdaq. If those markets rally, Bitcoin tends to follow. Both of those markets are also at notable resistances. Do they pull back from here? Only the market can answer that question. The only question you can answer is: are you willing to take the risk?
Thank you for considering my analysis and perspective. I hope you find it helpful.
Bitcoin-btcusd-btc

Bitcoin - No weekly candle close🔑below $18,435 since💯weeks 🚨Update:
Bitcoin
No weekly candle close🔑below $18,435 since💯weeks 🚨when next 15 hours are done
What are your thoughts on that weekly mark dear BTC and Crypto Nation❓
Likes, comments & Follow appreciated🤗
Disclaimer:
Not financial advice
Do your own research before investing
The content shared is for educational purposes only and is my personal opinion

BNBusdt 12H Break Resistance Well, as we can see in the chart, the resistance range is broken and we expect the price increase after pullback. Otherwise, with the failure of this area, the process will form.
Its not Buy or Sell SIGNAL
DYOR
BY : M.TeriZ - @AtonicShark

BITCOIN The winning signal for the new Bull Cycle!This is Bitcoin (BTCUSD) on the 1W time-frame, where we will be basically adding elements and making an extension of our June 17 idea that projected the bottom on the 1W MA300 (red trend-line):
As you see, BTC hit the 1W MA300, the Ultimate Support Band as we called it and since then traded sideways in our designated Bottom Phase. On the current analysis, we are taking a slightly different approach, still focusing around the Halvings but also introducing new key Resistance trend-lines as well as the the element of the Vortex Indicator (VI).
** The ATH Lower Highs and 1D MA50 test **
The price is having a bullish week so far that took a stop yesterday. Still, we don't have a major break-out yet, as it is not only below the 1D MA200 (orange trend-line) but the 1D MA50 (blue trend-line) as well. The chart shows that the first major bullish break-out in Bitcoin's past Bear Cycles occurred when the price broke above the All Time High (ATH) Lower Highs trend-line, after which it immediately tested the 1D MA50. The 1D MA50 typically broke after some consolidation.
** The Vortex Indicator signal **
A critical indicator that basically confirmed the ATH Lower Highs break-out was when the 1W Vortex Indicator (VI) made a Bearish Cross (red line crossing below the blue). In past Cycles this Cross took place right on the LH break-out, practically calling for the 1D MA50 test next. We can see that the past two Cycles made the LH break-out 55 weeks on average before the next Halving. The next Halving (no 4) will be in early March 2024. That gives us a projected range for the LH break-out and 1D MA50 test within the Jan 30 2023 and Feb 27 2023 1W candles. With the VI diverging from a Cross, it confirms so far this scenario.
Do you agree with the above model? Is a break above the ATH Lower Highs the roadmap to follow into the new Bull Cycle and if yes will it come when the model predicts or earlier if the VI makes a Bearish Cross? Feel free to let me know in the comments section below!
-------------------------------------------------------------------------------
** Please LIKE 👍, SUBSCRIBE ✅, SHARE 🙌 and COMMENT ✍ if you enjoy this idea! Also share your ideas and charts in the comments section below! This is best way to keep it relevant, support me, keep the content here free and allow the idea to reach as many people as possible. **
-------------------------------------------------------------------------------
You may also TELL ME 🙋♀️🙋♂️ in the comments section which symbol you want me to analyze next and on which time-frame. The one with the most posts will be published tomorrow! 👏🎁
-------------------------------------------------------------------------------
👇 👇 👇 👇 👇 👇
💸💸💸💸💸💸
👇 👇 👇 👇 👇 👇

BITCOIN 4H New channel update As we can see in the chart, Bitcoin is in a 2 -hour frame time in a uptrend channel that if we respond to the channel, the price is likely to rise to the channel ceiling. Otherwise, the channel will form a decline.
Its not Buy or Sell SIGNAL
DYOR
BY : M.TeriZ - @AtonicShark

Bitcoin: Number of Large Transactions increasingIntoTheBlock labels the large transactions those where an amount greater than $100,000 USD was transferred.
In this case, the Number of Large Transactions indicator aggregates the total number of transactions that had a value greater than $100,000.
The number of large transactions is a relevant metric tracking the count of transactions greater than $100,000.
Since this sum of money is not available to the average retail trader on-chain, the indicator acts as a proxy to the number of whales’ and institutional players’ transactions.
More info: resources.intotheblock.com
An increase in the quantity of these large transactions is accompanied by an increase in price.
This indicator follows a symmetrical triangle, tending to break up.
Perhaps there is one last bear trap to finally reverse into an uptrend.

Smell of short liquidation $OONAs the volume speak on they’re own, I believe we’re going to see volatility this days,
And for some reason I smell short liquidation
;)

Bitcoin is right now breaking down to our first price target!Right now we can see that Bitcoin is trying to break down. Breaking this rising wedge would bring us to our first price target we spoke about yesterday of 19,750k! Let's see if this plays out.
Trade safe!

#ICP #btcstarburst 1600%…Was this a rug? Was this bad timing? I think people should DYO and see what they are working on… I believe they are still building in the background… This just a study Dca safely Gann theory

The Bitcoin Grand Finale Before The RecessionMy EW counts and cyclical tools suggest there is one more rally in Bitcoin left before things get bad out there for all assets and we see a Great Devaluation event.

BITCOIN Close to invalidating the doomsday scenario!Bitcoin (BTCUSD) is having an impressive two-day bullish stretch as it is up +8.00% from yesterday's Low. The first key development that this price action gave us is that it broke above the Lower Highs trend-line that started on the August 15 High and as we mentioned 2 weeks ago on the following post, was dictating the pace of this corrective wave:
Now the price broke above even the 20600 Symmetrical Resistance and is about to test the 1D MA100 (green trend-line) for the first time since September 13. This alone is a major buy signal.
** The Doomsday Scenario **
What is perhaps the most important outcome of this 2-day rise, is that Bitcoin diverged from the bearish pattern of the 2018/19 Bear Cycle (black trend-line) that was what we called the 'Doomsday Scenario' as it suggested that the price action since the mid-June 2022 Low was a sideways movement similar to July - November 2019 that eventually led to the final Bear Cycle flush that formed the mid-December 2018 Bottom.
** The 1D MA100 **
The chart on the right is the 2018/19 price action and the one on the left is the 2021/22 period. As you see, we've plotted the 2018/19 fractal on the 2022 sequence and up until yesterday's rise, the pattern were almost an exact match. If the current divergence closes the week above the 1D MA100, then most likely than not, the Doomsday Scenario is invalidated and BTC won't make a 2018 type collapse.
** The 1D RSI **
It is worth paying attention to the 1D RSI, which broke today its Lower Highs trend-line. The same Lower Highs break on February 08 2019, was followed with a break above the 1D MA100. After that, the 1D MA200 (orange trend-line) was hit in 5 weeks and a very aggressive rally started until late June 2019 that was supported by an unbroken 1D MA50 (blue trend-line).
Do you think that Bitcoin's divergence from the 2018/19 fractal is an early signal that the Doomsday Scenario got invalidated and a closing above the 1D MA100 will confirm it? And if yes, will it start a similar 4 month rally? Feel free to let me know in the comments section below!
-------------------------------------------------------------------------------
** Please LIKE 👍, SUBSCRIBE ✅, SHARE 🙌 and COMMENT ✍ if you enjoy this idea! Also share your ideas and charts in the comments section below! This is best way to keep it relevant, support me, keep the content here free and allow the idea to reach as many people as possible. **
-------------------------------------------------------------------------------
You may also TELL ME 🙋♀️🙋♂️ in the comments section which symbol you want me to analyze next and on which time-frame. The one with the most posts will be published tomorrow! 👏🎁
-------------------------------------------------------------------------------
👇 👇 👇 👇 👇 👇
💸💸💸💸💸💸
👇 👇 👇 👇 👇 👇

Bitcoin gets the "all clear" from VIX and Dollar dump!So, I've been pretty clear that disinflationary data has been coming in hot and heavy, and that at some point, the fed will have to reconsider its current extremely hawkish strategy, pivot, and become more dovish. QT will become QE.
Inflation has topped.
The dollar has topped.
The VIX will drop.
The markets will pop.
For one last blowoff top.
Somebody bust that rhyme for me!
Most of the above appear to be taking place. Now we wait for the Fed to pivot and the blowoff top to come to fruition.
In the meantime, let us take a look at Bitcoin from a technical perspective. Triangles, triangles, triangles.
You will observe that after breaking out of our year-long descending wedge, the price action remained underwhelming, as it has since June. From a technical standpoint, there are two big reasons for this:
#1 - Since June (with the exception of a few weeks) we have remained rangebound between $18,700 and $22,000.
#2 - We hit a resistance trendline (BLACK descending TL) that also started in June AND formed the topside of another triangle we existed inside of since the beginning of September. Now, many traders were claiming this triangle was bearish with a probability ratio of 54/46 to the downside. Typically, this might be the case. My objection to this statistic became that this particular triangle poked through our RED resistance zone (now support) and outside of the year-long descending wedge; therefore, I was bullish this triangle instead of bearish.
Fast forward to today. BTC has, in fact, broken to the upside and the target appears to be that descending 200 day ma.
Now, if you are a follower of mine, you'll know that I entered a 5x long position at $18,300. I've adjusted my SL once to $18,500 putting me quickly in the green for this trade even with my SL triggered. I will now be moving this up again to our critical support area of $18,700. Should we remain above our 50 day ma tomorrow (RSI must also cooperate - see chart), I will move it yet again to around the $19,200 level.
Congrats to those of you who are following me in this trade!
Stew

One more SPOOK for Halloween?Looks like an inverse H&S Potentially forming here.. into downward diag resistance..
Likely another spook for Halloween, to form the right shoulder, then a thrust up for November.. "Upvember"

BITCOIN Can this pattern that has never failed before, fail?This chart represents Bitcoin (BTCUSD) on the 1W time-frame. With the price action sideways for a whole month, holding the 1W MA300 (red trend-line) as Support, comparisons with past Cycles in order to determine whether we've priced the bottom or not, are inevitable.
The comparison of the current Bear Cycle to the past two, leaves us with one main impression: how similar they've been (so far). The 'so far' narrative may be coming to an end as the only thing that BTC has left to do to complete the full package of similarities is break above the 1W MA50 (blue trend-line). Apart from that, the 1W MA300 (as mentioned) is holding, which did in both previous Cycles and more importantly, the LMACD is past its Bullish Cross formed in late September and has started to open the gap and trend upwards. Notice how all LMACD crossed were formed while the MA50 crossed below the MA100 (green trend-line) to form a Bearish Cross and how the 1W RSI Historic Support Zone was once again respected. As you see during all Cycles, the RSI has bounced on that Support Zone right after Bitcoin formed its bottom.
For a more accurate illustration of the comparison between all three Cycles, I have plotted the past two Bear Cycles (Grey = 2014/15 and Black = 2018/19) on the current one (Blue = 2021/22). The symmetry on the pattern followed is evident. The cyclical correlation tends to become stronger right before the Final Drop and straight after the bottom is formed. Then the Cycles diverge again as some are more aggressive than others (fundamentals involved). This graph shows that the current Cycle is lagging a bit as it has been consolidating for too long but still holds a tight resemblance especially with the 2014/15 Cycle.
Does this mean that Bitcoin is ready to rebound hard towards the 1W MA50? What do you think? Feel free to let me know in the comments section below!
-------------------------------------------------------------------------------
** Please LIKE 👍, SUBSCRIBE ✅, SHARE 🙌 and COMMENT ✍ if you enjoy this idea! Also share your ideas and charts in the comments section below! This is best way to keep it relevant, support me, keep the content here free and allow the idea to reach as many people as possible. **
-------------------------------------------------------------------------------
You may also TELL ME 🙋♀️🙋♂️ in the comments section which symbol you want me to analyze next and on which time-frame. The one with the most posts will be published tomorrow! 👏🎁
-------------------------------------------------------------------------------
👇 👇 👇 👇 👇 👇
💸💸💸💸💸💸
👇 👇 👇 👇 👇 👇

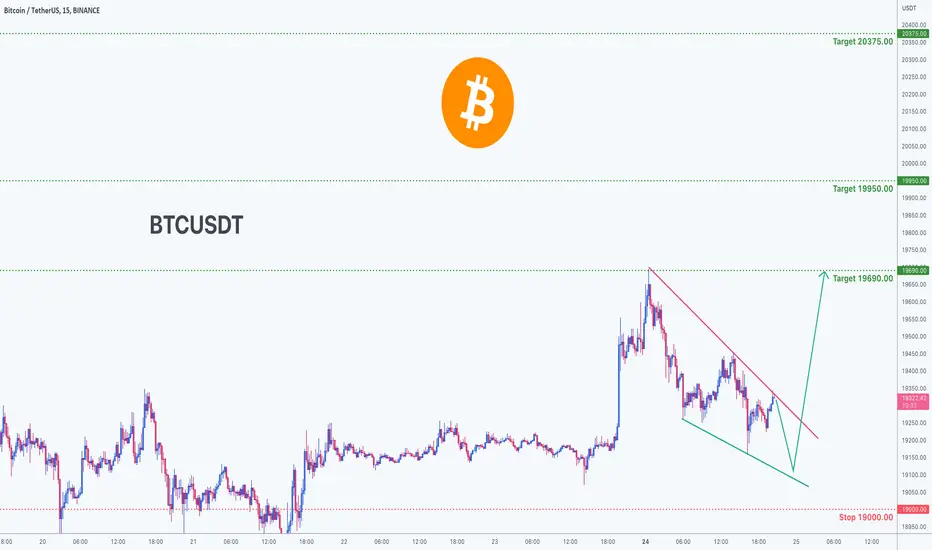
Trading opportunity for BTCUSDT BitcoinBased on technical factors there is a Long position in :
📊 BTCUSDT Bitcoin
🔵 Long Now or by Breakout
🧯 Stop loss 19000.00
🏹 Target 1 19690.00
🏹 Target 2 19950.00
🏹 Target 3 20375.00
💸RISK : 1%
We hope it is profitable for you ❤️
Please support our activity with your likes👍 and comments📝
Bitcoin: Where's The Squeeze?The stock market (S&P) put in a dramatic bullish reversal on Friday (it does NOT matter why). Bitcoin is generally correlated to the S&P, and while it has tried to follow (tested 18,600 area low, then produced bullish pin bar), it's performance is subpar. Where is the squeeze? Where is the short covering? This lack of participation can be interpreted as RELATIVE WEAKNESS. Why does this matter?
For those who are consumed with "why?", you need to realize that "why?" does not matter. Markets are driven by irrational forces, so instead of trying to point to a reason that a market moved, instead just accept the move. Trying connect logic will NOT help you anticipate moves like this in the future. Learn to trust PRICE.
So lets accept the fact that markets reversed. All markets: forex, stocks, bond market. This move appears to be a function of the U.S. Dollar retrace (obviously a reaction to news). Before you accept financial entertainment at face value, REALIZE that NOTHING has changed in terms of the broader trends or price structures. While the Dollar is showing 1 bearish candle, it has yet to take out a multitude of support levels BEFORE any economic arguments can be made for sustainable rallies across other markets. One bullish candle does NOT signal a market bottom.
So what does all this mean for Bitcoin? Relative to the magnitude of the reversal, Bitcoin should have at least pushed into a notable resistance like 19,500 or 20,500. Instead it can't even get out of its own way, stuck in the low 19K area. This lack of performance is likely to be a sign that no one is covering shorts, and any buying is being absorbed. IF this is true, and Dollar rallies and S&P pulls back again, Bitcoin is likely to pull back FASTER. This is the concept of relative strength or in this case weakness.
And for shorts, this is a good sign. In fact, I shared a short swing trade idea recently which became active at 18,850. The trade is red at the moment, but nowhere near its stop. Based on this relative weakness, it is within reason to continue to give this trade a chance. IF a bearish catalyst comes along, it is still possible for Bitcoin to test the 17Ks or lower, especially if the S&P works its way back toward the lows. Until the broader context changes, I will continue to maintain the outlook that any rallies are not sustainable.
For those who trade on hope or opinions and think this is the bottom of t he market: understand that a market bottom is not an event, it is a process. Trying to buy "the bottom" is EXTREMELY expensive. By the time the actual bottom is confirmed, price is often much higher. Being on the right side of the structure is more effective than buying at the best prices. And right now, as long as rates continues to rise, the bottom has yet to begin its process.
Thank you for considering my analysis and perspective. I hope you find it helpful.

BITCOIN All bullish signals aligned but one last crucial remainsBitcoin (BTCUSD) has been consolidating throughout the whole month of October so far and as the short-term direction is neutral, it is useful to look again on the long-term charts to get a better understanding of where we might be at compared to previous Cycles.
** The 2W MA150 supporting **
This time I bring you this analysis on the 2W time-frame. Key points here to create a framework: The 2W MA150 (yellow trend-line) has made contact with the price and supported the Bear Cycle since the 2014/15 Bear Cycle. As you see the candles that have made contact so far are Jan 05 2015, Aug 17 2015, March 02 2020 and the current one. Basically this trend-line has been providing an almost flat Support since the crash of early June.
** The MA10 & MA50 **
It is common on both 2 previous Bear Cycles as well as the current one so far, that the price trades below the 2W MA10 (red trend-line), throughout the whole Cycle. In the past two, when it broke above it, a strong (initial) Bull Cycle rally took place.
The 2W MA50 (blue trend-line) also plays its part. Every time the 2W MA10 crossed below the 2W MA50 (Bearish Cross), the market formed its Bottom. That happened on the recent price flush in June. When the opposite cross took place (MA10/MA50 Bullish Cross), Bitcoin had already confirmed the start of its new Bull Cycle.
** The final crucial signal that remains **
At the moment, the price has been practically stuck within the 2W MA10 and 2W MA150 since the mid-August High. A break above the 2W MA10 would be an early rally sign. In the past two Cycles, this MA10 break-out has coincided with the LMACD forming a Bullish Cross. Basically that tends to confirm the new Bull Cycle and we can claim that it is the final signal that remains. At the moment it would appear that BTC is a minimum of 2 months away from an LMACD Bullish Cross. However, it would be hard to imagine the price staying flat for such a long time but the RSI, as long as it stays on Higher Lows, shows that the price action can tolerate this.
Do you think history will repeat itself and make Bitcoin rally with a break above the 2W MA10 and an LAMCD Bullish Cross? Or a break below the 2W MA150 will invalidate this cyclical pattern for good? Feel free to let me know in the comments section below!
-------------------------------------------------------------------------------
** Please LIKE 👍, SUBSCRIBE ✅, SHARE 🙌 and COMMENT ✍ if you enjoy this idea! Also share your ideas and charts in the comments section below! This is best way to keep it relevant, support me, keep the content here free and allow the idea to reach as many people as possible. **
-------------------------------------------------------------------------------
You may also TELL ME 🙋♀️🙋♂️ in the comments section which symbol you want me to analyze next and on which time-frame. The one with the most posts will be published tomorrow! 👏🎁
-------------------------------------------------------------------------------
👇 👇 👇 👇 👇 👇
💸💸💸💸💸💸
👇 👇 👇 👇 👇 👇

BITCOIN 1H next move in the ChannelWell, as we can see in the chart, in the one-hour time frame, the price is in the downward channel, where we expect the support of the set range, if this support breaks, the fall to the bottom of the channel is not far from expected.
Its not Buy or Sell SIGNAL
DYOR
BY : M.TeriZ - @AtonicShark

Bitcoin - It can go either wayThis is a long-term Bitcoin idea.
So many people asked me to talk about Bitcoin's chart with the log scale.
We have two possible trends on the logarithmic price scale.
Noise. We have noise in the $4K price range. The reason we can't be sure about counting this as a factor or not is that on different timeframes, this area isn't noise.
So, either we still have a chance to pump the price back up, or this support trend is broken.
For those Bulls, 100K is the resistance level which isn't impossible in the log scale.
And for the bears, the following support is around the 13K levels, which is also vital; I will discuss it once we get there.
Now let's see your ideas. Let's have a discussion.
Let me know if you guys have any questions;
I will be more than happy to help.
Good luck, and thank you.

BITCOIN The Cyclical Bearish signal of the RSI*** ***
For this particular analysis on Bitcoin we are using the BTCUSDT symbol on the OKX exchange.
*** ***
The idea is on the 1D time-frame where Bitcoin ( BTCUSD ) is about to confirm or invalidate a very accurate signal provided by the RSI throughout the whole 2022.
As you see, the RSI is currently supported on a Higher Lows trend-line that started on the September 06 Low. Throughout the year, when the RSI broke below similar Higher Lows structures, Bitcoin's price dropped sharply. What is even more interesting is that the previous two RSI break-outs happened exactly 64 days since the previous one. This is the first difference from that (otherwise) very consistent pattern: Bitcoin is currently 5 days past that 64 day strike level (October 15).
This could be an early sign of a potential invalidation of this Cyclical pattern. I call it Cyclical because see how harmonically the Sine Waves guide the price action. But let's not draw the attention away from the RSI which is the key of this pattern. As long as it trades above the Higher Lows trend-line, the probabilities of invalidation get stronger. Perhaps for a pattern change a strike level can be used and this might be if the price closes above the 1D MA100 (green trend-line), which has been the Resistance since early April. If on the other hand, the RSI breaks below the Higher Lows trend-line, then the Cyclical Bearish pattern is confirmed and we should be expecting a considerably lower price.
For comparison purposes I have plotted the previous three sharp drops (grey, yellow and blue trend-lines) after the RSI break-down on the current price action. Pick your poison in that case. By the way, the LMACD indicator also gives an early sell warning on this Cyclical pattern and that is when the histogram attempts to get narrower. We have started such a sequence in the past 10 days.
So how useful do you think this RSI Cyclical pattern is? Do you think it will be confirmed for the 4th time in a row or invalidated above the 1D MA100 and practically establish the new Bull Cycle? Feel free to let me know in the comments section below!
-------------------------------------------------------------------------------
** Please LIKE 👍, SUBSCRIBE ✅, SHARE 🙌 and COMMENT ✍ if you enjoy this idea! Also share your ideas and charts in the comments section below! This is best way to keep it relevant, support me, keep the content here free and allow the idea to reach as many people as possible. **
-------------------------------------------------------------------------------
You may also TELL ME 🙋♀️🙋♂️ in the comments section which symbol you want me to analyze next and on which time-frame. The one with the most posts will be published tomorrow! 👏🎁
-------------------------------------------------------------------------------
👇 👇 👇 👇 👇 👇
💸💸💸💸💸💸
👇 👇 👇 👇 👇 👇

BITCOIN 3D Update! Bullish or Bearish?According to the chart, in the three-day time frame, the trend line is broken in the important support area, and if this area is maintained, it can form an upward trend. If this range is lost, we will expect a drop to lower prices.
Its not Buy or Sell SIGNAL
DYOR
BY : M.TeriZ - @AtonicShark

BTC Detailed Top-Down Analysis - Day 87Hello TradingView Family / Fellow Traders. This is Richard Nasr, as known as theSignalyst.
87 out of 500 days done.
I truly appreciate your continuous support everyone!
Let me know if you like the series, and if you would like me to change or add anything.
Always follow your trading plan regarding entry, risk management, and trade management.
Good Luck!.
All Strategies Are Good; If Managed Properly!
~Rich

BTC only a matter of timeIt's only a matter of time, BTC will likely break through the down trending resistance line exiting the bear market soon.
