BITCOIN Will this historic level break too?Bitcoin (BTCUSD) remains supported on its 1W MA50 (blue trend-line), which is its main Bull Cycle Support, despite the recent volatility. As mentioned numerous times, in periods of uncertainty it helps you maintain an objective long-term perspective if you zoom out and look on the wider time-frames.
On this 1W chart, we can see that so far all of BTC's Cycle's have followed the same pattern. The Bear Cycle bottoms and the first bounce of the Bull Cycle aims at breaking above the ATH Lower Highs trend-line (blue Arc). It is what we call the 'Growth Channel' that guides the market from its Cycle bottom to break above the ATH Lower Highs and when it does the Parabolic Rally Phase (green Rectangle) starts. The most aggressive part is when the price breaks also above its Growth Channel.
This is the only Resistance level that has yet to be broke on this Cycle. If it does, the market will explode to Targets above $200k that will start putting it to capitalization levels that would require earth shattering catalysts in terms of adoption. A continuation of expansion within the boarders of the Growth Channel however can easily target $150k. Notice that throughout the whole process of the Growth Channel expansion on all Cycles historically, the 1W MA50 (blue trend-line) tends to hold and support.
So what do you think will happen this time? Will Bitcoin break above the Growth Channel and offer us another proper Parabolic Rally or will it be a more standard rise within it? Feel free to let us know in the comments section below!
-------------------------------------------------------------------------------
** Please LIKE 👍, FOLLOW ✅, SHARE 🙌 and COMMENT ✍ if you enjoy this idea! Also share your ideas and charts in the comments section below! This is best way to keep it relevant, support us, keep the content here free and allow the idea to reach as many people as possible. **
-------------------------------------------------------------------------------
💸💸💸💸💸💸
👇 👇 👇 👇 👇 👇
Bitcoin-btcusd-btc

BITCOIN The Ultimate Cycle Model calls for $160k!Bitcoin (BTCUSD) is rebounding following yesterday's Fed Rate Decision. Technically the rebound has already started 10 days ago after the market nearly bottomed on the 1W MA50 (red trend-line). This is the strongest long-term Support level, as it is where BTC priced Lows and rebounded on August 05 2024 and September 11 2023, but it is not the only one.
With the current 2023 - 2025 Bull Cycle pattern being a Channel Up, this is the absolute and ultimate model that has been guiding the price action and can help estimate any future moves. Given that, it's also the 0.382 Fibonacci retracement level that supported both Lows (as well as the current one) on the 1W MA50 mentioned above. As a result, we are so far on a double Support cluster.
The 1W RSI comes in as the 3rd Support, as it hit and is rebounding now on its 2-year Support level, where the bounces of September 07 2024 and September 11 2023 happened. It is also important to mention that the Channel Up can be divided into two phases, Phase 1 (green Channel Up), which traded within the 0.0 - 1.0 Fibonacci range and Phase 2 (blue Channel Up), which trades within the 0.5 - 1.5 Fibonacci range.
The symmetry within those patterns are so high that the two Bullish Legs of Phase one have both rallied by +100.64%. If Phase 2 follows the same dynamic, and there is no reason to assume it won't as the Bearish Legs have been almost identical, we can assume that the Bullish Leg that has just started will rise by +121.48%, same as the previous one (Aug - Dec 2024). That gives us a Target estimate of $160000.
So do you think that BTC has bottomed on this Triple Support Cluster and if so, can it reach $160k by the end of this Cycle? Feel free to let us know in the comments section below!
-------------------------------------------------------------------------------
** Please LIKE 👍, FOLLOW ✅, SHARE 🙌 and COMMENT ✍ if you enjoy this idea! Also share your ideas and charts in the comments section below! This is best way to keep it relevant, support us, keep the content here free and allow the idea to reach as many people as possible. **
-------------------------------------------------------------------------------
💸💸💸💸💸💸
👇 👇 👇 👇 👇 👇

BITCOIN The 2021 Pivot trend-line that is coming to its rescue.Bitcoin (BTCUSD) has stayed stable after last week's rebound on the 1W MA50 (blue trend-line), which has been the level that offered support on the Bull Cycle Channel's previous Higher Low (August 05 2024).
Technically however, that is not the only major Support level that may be coming to BTC's rescue as we've identified the Pivot trend-line that started on the April 12 2021 High as a Resistance and since then made another 2 contacts (as rejections). This is the first time now that is being tested as Support.
During the previous Cycle (2018 - 2021) a similar Pivot trend-line was the level that supported Bitcoin during the last year of its parabolic rally on January and June 2021. The June 2021 contact in particular tested the 1W MA50 as well, which is the exact situation we're in right now. That double support hold initiated the final rebound towards the Cycle's new All Time High (ATH).
Check also how similar the 1W CCI patterns between the two fractals are and based on that, a 1W CCI reading at 200.00 would be a solid level to sell and take profit. As a result, we expect this Cycle's Channel Up to accelerate the current rebound, technically its Bullish Leg and make a new ATH, which would be the Cycle's new Top, ideally with a CCI at 200.00.
So do you think this cyclical Pivot trend-line is coming along with the 1W MA50 to BTC's rescue? Feel free to let us know in the comments section below!
-------------------------------------------------------------------------------
** Please LIKE 👍, FOLLOW ✅, SHARE 🙌 and COMMENT ✍ if you enjoy this idea! Also share your ideas and charts in the comments section below! This is best way to keep it relevant, support us, keep the content here free and allow the idea to reach as many people as possible. **
-------------------------------------------------------------------------------
💸💸💸💸💸💸
👇 👇 👇 👇 👇 👇

BTCUSD: This isn't the Top by any meansBitcoin remains slightly bearish on its 1D technical outlook (RSI = 41.137, MACD = -3097.700, ADX = 33.471) as even though it appears its trading on a macro bottom, just over the 1W MA50 (1W RSI = 45.068), it hasn't broken out yet. The market undoubtedly took a psychological hit with February's drop but despite the voices calling for a new bear market, we are here to show you why this Cycle hasn't topped yet and is still far from doing so.
This metric measures BTC's temporary stops/ tops during a Bull Cycle. It is a Halving-to-Halving method, starting on the most recent Halving and ending on the next one. Stop 1 is where the starting Halving takes place and the market pulls back. Stop 2 is the next pullback on the 0.236 Time Fibonacci level. The 0.382 Fib prices Stop 3 and basically the Cycle Top. This has been happening on both previous Cycles exactly as described and on the 2012-14 Cycle it just had to be adjusted a little before the 1st Halving due to the Cycle being much shorter since it was the earliest. Nevertheless, it fits the Stop points perfectly.
Note also that distance from the Halving (Stop 1) to Stop 3 has always been 76/78 weeks. This suggests the we can have a new Cycle Top by October 20th 2025 the latest.
## If you like our free content follow our profile to get more daily ideas. ##
## Comments and likes are greatly appreciated. ##

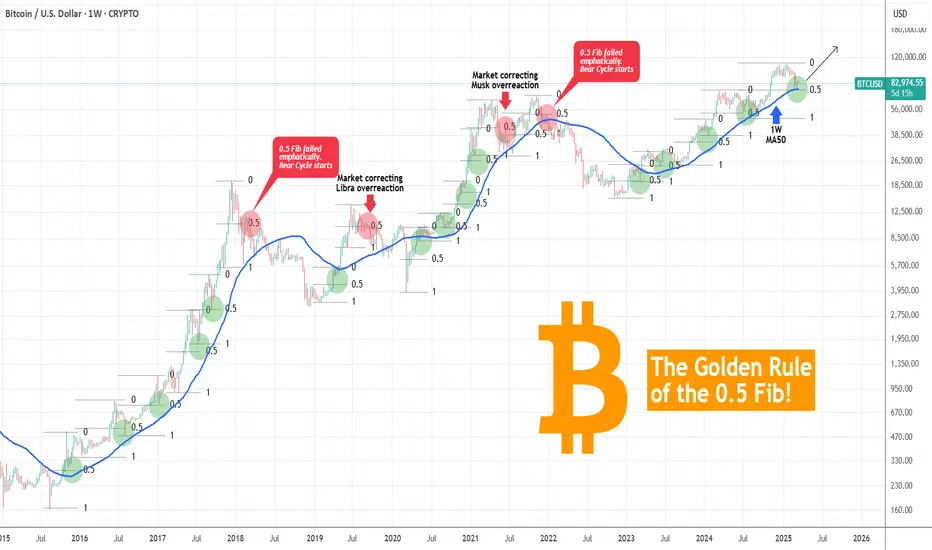
BITCOIN The 0.5 Fib Golden Rule! This is not a Bear Market yet!Bitcoin (BTCUSD) shook the bullish market sentiment last month, as late February saw it drop aggressively not just from the 109k All Time High (ATH) but also below the key psychological Support of $90000. We have discussed already how the 1W MA50 (blue trend-line) coming to its rescue, is the critical Support and rightfully so, but there is also another critical condition that is currently showing incredible strength, keeping BTC into Bull Cycle territory (for now).
That is the 0.5 Fibonacci retracement level Golden Rule. This suggests that BTC's corrections/ pull-backs up to the 0.5 Fib level are technical and perfectly systemic, especially with the 1W MA50 supporting. If anything, such pull-backs during a Bull Cycle are the most optimal buy opportunities. We are currently on an exact such opportunity as the price hit last week both the 1W MA50 and the 0.5 Fib.
In the past 10 years since the August 2015 Bear Cycle bottom, every correction up to the 0.5 Fib was a buy. In the 4 cases it broke, 2 were the signals of the 2018 and 2022 Bear Cycles and the other 2 signals of the market correcting the bullish overreaction to the Libra (2019) and Musk (2021) rallies. The latter though was still contained above the 1W MA50 and so would the 2019 one if it wasn't for the March 2020 COVID crash.
As a result, we still see no cause for concern (yet) and so far this is the best buy opportunity for Bitcoin since last year and the August 05 2024 Low.
But what do you think? Is this 0.5 Fib Golden Rule coming to push Bitcoin higher to its next ATH? Feel free to let us know in the comments section below!
-------------------------------------------------------------------------------
** Please LIKE 👍, FOLLOW ✅, SHARE 🙌 and COMMENT ✍ if you enjoy this idea! Also share your ideas and charts in the comments section below! This is best way to keep it relevant, support us, keep the content here free and allow the idea to reach as many people as possible. **
-------------------------------------------------------------------------------
💸💸💸💸💸💸
👇 👇 👇 👇 👇 👇
This is a 4-hour chart of Bitcoin (BTC/USD)This is a 4-hour chart of Bitcoin (BTC/USD) showing a key resistance level around $86,527 and a potential bearish move towards lower support zones.
Analysis:
Price is currently trading near the resistance zone, struggling to break above it.
A sell setup is suggested, expecting rejection from resistance.
The first target is around $78,500, with an extended downside target at $75,869 and possibly $71,580 if momentum continues.
A stop-loss level is placed above resistance at $86,527, indicating a risk management strategy.
The overall structure suggests bearish sentiment unless price breaks above resistance.
Potential Trading Plan:
📉 Bearish Scenario:
Short below resistance confirmation.
Targets at $78,500, $75,869, and $71,580.
Stop-loss above $86,527.
📈 Bullish Scenario:
A break and close above $86,527 could invalidate the bearish setup.

BITCOIN Is this the 'most normal' Cycle of them all ??This is not the first time we use a Convergence/ Divergence approach to Bitcoin (BTCUSD) Cycles and certainly not the last one. On the previous one, it helped us to succesffuly predict the end of 2022 bottom but what we couldn't anticipate is how smooth the new/ current Cycle 5 (orange trend-line) would be.
As the title says, this is probably the 'most normal' Cycle of them all, as BTC has been trading within a Channel Up (orange) since the Bear Cycle's bottom more than 2 years ago.
To get a better understanding of this claim, we compare Bitcoin's (BTCUSD) Cycles from their previous top to the next one (with the exception of the first), on this complete mapping analysis, having them all displayed on top of another: Cycle 1 (green trend-line), Cycle 2 (red), Cycle 3 (blue), Cycle 4 (black) and the current one Cycle 5 (orange).
** Diminishing Returns **
As you see, first of all, this showcases the Theory of Diminishing Returns, which suggests that as the market grows and higher adoption is achieved, BTC will show less and less returns in each Cycle. Every Cycle Top has been lower from the previous one.
** Cycle Convergence - Divergence **
Secondly, all Cycles particularly during their Bear Phase and for a short time after, tend to follow a common path. The illustration on this analysis is very clear as it starts with each Cycle's Bear Phase and you can see that when they diverge, they converge again quickly. The most recent Bear Phase was not surprisingly as long as Cycle 4 and almost Cycle 3, which was to be expected as the market has shown an amazing degree of symmetry in the past 10 years. Note that this is also the model that helped as determine very early in 2023 that Cycle 3 would be the best fit for the new Cycle in terms of price action and without a doubt, BTC has been mostly replicating that Cycle.
** What's next for the current Cycle? **
If we compare the current Cycle (5) with Cycle 3 we can see that the Convergence - Divergence Model is holding. So far when Cycle 5 converged, it immediately diverged. And this is exactly what it has been doing since the December High and the marginal January All Time High (ATH). It has started to diverge significantly from Cycle 3 so what the recent pull-back to the 1W MA50 achieved is to normalize it and is about to touch it.
Now that the price hit the bottom of its +2 year Channel Up, we expect to rise, which will achieved convergence and contact with both Cycles 3 and 4, which is what they both did in their last 150 days of their respective Bull Cycles. Technically, this can take Cycle 5 to around $150k.
As we've first mentioned in the crypto space, regarding the last Bear Market being the 'smoothest' in history, we can securely say now that the current Bull Cycle is also the 'most normal' ever.
So what do you think? Does this Cycle regression model offer any useful conclusion as to where Bitcoin might top and if so, is this Cycle indeed the 'most normal' in the history? Feel free to let us know in the comments section below!
-------------------------------------------------------------------------------
** Please LIKE 👍, FOLLOW ✅, SHARE 🙌 and COMMENT ✍ if you enjoy this idea! Also share your ideas and charts in the comments section below! This is best way to keep it relevant, support us, keep the content here free and allow the idea to reach as many people as possible. **
-------------------------------------------------------------------------------
💸💸💸💸💸💸
👇 👇 👇 👇 👇 👇

BTCUSD: Phase 4 of Bull Cycle just started.Bitcoin is about to turn neutral again on its 1D technical outlook (RSI = 44.562, MACD = -3343.000, ADX = 34.423) as it is making a big 1W comeback on this week's candle following a nearly perfect touch of the 1W MA50. Every test of the 1W MA50, as well as every test of the S1 1W RSI level, has been a straight buy opportunity inside the Bull Cycle's Channel Up since the very begining of the November 2022 bottom.
As first the price action was concentrated on the lower half of the Channel Up (green zone) but since February 2024 it has been primarily on the upper half (blue zone) as the rallies got more aggressive, with the only exceptions being the 1W MA50 tests such as the current one (green Arcs). Every bottom rebound has increased by at least +98.76%, so that gives us a peak estimate of TP = 150,000. An temprary high around 120k and pullback to 100-90k is a possible scenario based on all previous rallies/ Phases. Phase 4, which should technicall be the final of the Bull Cycle, has just started.
## If you like our free content follow our profile to get more daily ideas. ##
## Comments and likes are greatly appreciated. ##

BITCOIN Is this a Falling Wedge bottom formation?Bitcoin (BTCUSD) is trading since the February 28 Low within a Falling Wedge pattern, below the 1D MA50 (blue trend-line) and at the same time supported by the 1W MA50 (red trend-line).
Throughout its dominant Bull Cycle pattern, the +2 year Channel Up, it has formed another 6 such Falling Wedges, all below the 1D MA50 and all turned out to be market bottom formations, which paved the way for an immediate bullish break-out. On all occasions, the 1D CCI has been almost as low as on the February Low.
The shortest rebound it made before another break below the 1D MA50, was +26.68% and the highest was +106.96%. As a result this gives us a minimum immediate potential Target of $96800 and a maximum of a little more than $150000. Given that the price has touched the bottom of the long-term Channel Up, like the bottom formations of September 06 2024 and September 11 2023, it is quite likely to see the stronger rebound probability taking place.
But what do you think would be the case? Is this a classical Falling Wedge bottom break-out formation and if so what may be the Target? Feel free to let us know in the comments section below!
-------------------------------------------------------------------------------
** Please LIKE 👍, FOLLOW ✅, SHARE 🙌 and COMMENT ✍ if you enjoy this idea! Also share your ideas and charts in the comments section below! This is best way to keep it relevant, support us, keep the content here free and allow the idea to reach as many people as possible. **
-------------------------------------------------------------------------------
💸💸💸💸💸💸
👇 👇 👇 👇 👇 👇

BITCOIN Money Supply, Dollar and Bonds pushing for MEGA RALLY!This is not the first time we publish a Bitcoin (BTCUSD) analysis in relation to the U.S. Dollar Index (green trend-line) or Chinese Bonds (red trend-line) and Global Liquidity (blue trend-line). In fact we have been doing this since the late 2022 bands in China and like the highly bearish sentiment that was in the market then, we decided to dive into this cross-asset analysis yet again in order to put the current sentiment in perspective.
Well it couldn't be more relevant. What we discovered is that all the financial assets mentioned above have yet again aligned to offer the strongest bullish confirmation for BTC since the November 2022 Bear Cycle bottom!
More specifically, we are a little past the point where the DXY peaks and declines aggressively, Global Liquidity bottoms and starts rising, while Chinese bonds (our CN02Y/CN20Y ratio) bottom and rise aggressively. In the past 10 years this combination of events has happened 6 times, 2 times during each Cycle: one at the bottom of the Cycle and the other when the final, most aggressive rally starts.
Notice also that (naturally) this is where the stock market (SPX, black trend-line) also bottoms and starts rising aggressively.
As a result, the above market conditions are an indication that despite the recent monthly correction and turbulence due to a number geopolitical and other trade fundamental reasons, the macro-economic parameters remain intact for the wider picture of this Cycle. Truthfully, this is where an announcement next week of future Fed Rate Cuts would come very handy.
So what do you think of this analysis above? Are you fearful that a new Bear Cycle is starting or more confident that the market will soon recover and price a new High? Feel free to let us know in the comments section below!
-------------------------------------------------------------------------------
** Please LIKE 👍, FOLLOW ✅, SHARE 🙌 and COMMENT ✍ if you enjoy this idea! Also share your ideas and charts in the comments section below! This is best way to keep it relevant, support us, keep the content here free and allow the idea to reach as many people as possible. **
-------------------------------------------------------------------------------
💸💸💸💸💸💸
👇 👇 👇 👇 👇 👇

Bitcoin - The Uptrend Remains 100% Valid!Bitcoin ( CRYPTO:BTCUSD ) can create a textbook break and retest:
Click chart above to see the detailed analysis👆🏻
Over the past couple of weeks we have only been seeing a consolidation on all cryptocurrencies, governed by the slow movement on Bitcoin. With today's drop Bitcoin is now approaching the previous all time highs, which are now acting as a major support, pushing price much higher.
Levels to watch: $70.000, $300.000
Keep your long term vision,
Philip (BasicTrading)

BTCUSD: Last 1W MA50 rebound to the top of the CycleBitcoin remains bearish on its 1D technical outlook (RSI = 40.004, MACD = -3484.800, ADX = 36.461) but today we see the first recovery attempt. The technical reasoning behind it is that the market is testing its 1W MA50 and in due time it will price the new HL of the Bull Cycle and form the bottom that will hold for the rest of the year until the cycle's very top. This is no different than the last two Cycles, the 1W RSI is even rebounding on its S1 level. Based on that pattern we are looking at a potential Cycle peak between 150k - 200k.
## If you like our free content follow our profile to get more daily ideas. ##
## Comments and likes are greatly appreciated. ##

BITCOIN Cycle pattern completed. Year-end Target locked at $150kBitcoin (BTCUSD) is showing the first signs of life after nearly testing the 1W MA50 (blue trend-line) early this week. Whether this leads to a full on recovery or not, can been partially answered by this Cycle's price action so far.
Historically we do know that BTC's Bull Cycles so far tend to peak towards the end of their 3rd year and that's 2025. This Cycle has been predominantly trading within a Fibonacci Channel Up, since its very start, the November 2022 bottom. Its 1W MA50 has been supporting since the March 13 2023 break-out, so it's been exactly 2 years of holding and throughout this time period has provided two excellent buy opportunities.
As you can see, the Channel Up can be classified into two main Phases so far: each has a Primary correction (red) of more than -30% drop, followed by a rally (blue), then a Secondary correction (yellow) of more than -20%, followed by the second and last rally (blue). All rallies have so far been around +100%. Based on this model, we are now on the Secondary correction of Phase 2.
Notice that all corrections (either primary or secondary) hit or approached apart from the 1W MA50, the 0.382 Fibonacci retracement level from their previous Low. This is actually the first time that the price has marginally broken below the 0.382 Fib. At the same time, the 1D RSI almost got oversold last week (34.50) and according to the August 05 2024 (Higher) Low, this is were a series of RSI Higher Lows would be a signal of a new bottom formation.
The bottom and recovery process may take a while though, another 4-6 weeks. According to the Time Fibs (blue dashed vertical lines), each correction (whether primary or secondary) has ended at or a little before the 1.0 Fib with the 0.0 being the bottom of the previous one and 0.5 Fib the Top of the rally. Based on this, we can expect the new rally to start by the week of April 28 the latest.
So now as to how high this can get, if it repeats the 'weakest' rally of the Channel's three so far, it should rise by +95.95%, which gives us a straight price of $150000 as a Target. If the rally symmetry also holds, this should come by late September, perfectly aligning with Bitcoin's historic Cycle expectation for the final year.
Do you think that will be the case? Recovery starting within 4-6 weeks and if so, are you expecting $150k? Feel free to let us know in the comments section below!
-------------------------------------------------------------------------------
** Please LIKE 👍, FOLLOW ✅, SHARE 🙌 and COMMENT ✍ if you enjoy this idea! Also share your ideas and charts in the comments section below! This is best way to keep it relevant, support us, keep the content here free and allow the idea to reach as many people as possible. **
-------------------------------------------------------------------------------
💸💸💸💸💸💸
👇 👇 👇 👇 👇 👇

BITCOIN Short term Channel Down rebounding.Bitcoin / BTCUSD is having a rebound after the price hit the bottom of the 10 day Channel Down.
The bullish wave should attempt at least a +13.73% rise (similar to the previous one) and target 87000.
That is the short term bullish plan as the price may be rejected again at the top of the Channel Down.
If however the 4hour MA200 breaks, it will be the first time since February 4th and should be enough to restore the long term bullish bias back to the market.
Follow us, like the idea and leave a comment below!!

BITCOIN Great Investment Opportunity! Buy!
Hello,Traders!
BITCOIN keeps falling down
In a strong correction move
But the coin will soon hit a
Massive key horizontal
Demand level of 72,500$
From where a bullish
Rebound and a move up
Is likely to happen
Buy!
Comment and subscribe to help us grow!
Check out other forecasts below too!
Disclosure: I am part of Trade Nation's Influencer program and receive a monthly fee for using their TradingView charts in my analysis.

BITCOIN Is this the last defense before the narrative changes?Bitcoin (BTCUSD) got yet again increasingly volatile during the weekend and is approaching the 1W MA50 (blue trend-line). As mentioned on the title, this is "the last defense" for BTC as so far this price action hasn't diverged a bit from the Channel Up of the 2015 - 2017 Bull Cycle but a break and 1W candle close below it, would jeopardize that.
** The key 1W MA50 **
In fact the only times that Bitcoin closed below its 1W MA50 during a Bull Cycle and the Cycle continued was of course during the March 2020 COVID global market flash crash and November 18 2019. But the current Bull Cycle is nothing like in 2019 - 2021, it doesn't have the initial overextension of the Libra hype (May - June 2019) or Elon's early 2020 hype nor of course the pandemic shutdown. On the contrary it is incredibly similar with 2015 - 2017 with the only difference being that, thanks to the ETF launch in January 2024, the market marginally breached the previous All Time High (ATH) earlier.
** Symmetry playing out **
So back to the similarities between those two Cycles. The Cycle count indicates that we are at the end of the (blue) Bull Rectangle in March 2017 (847 days) when the price almost tested the 1W MA50 and then started the (green) Parabolic Phase to new ATHs (217 days). Even in terms of 1W RSI and MACD, the two fractals are similar, with the RSI being on its 2nd 'Buy the dip Volatility Phase' bottom and the MACD on its 2nd Bullish Cross.
** How high can it get? **
Now as to how high the new Cycle Top can be, can be anybody's guess, but if it repeats the less aggressive 2021 Top, it could be on the 1.618 Fibonacci extension, i.e. around $170k, while if it repeats the (much more unrealistic for such short period of time in terms of market cap) 2017 Top, it could be on the 2.382 Fib ext, i.e. around $520k. The worst case scenario is to have Fib extension Tops on a decreasing rate, in which case the 1.5 - 1.382 levels are next, giving us a potential target range of 120k - 145k, which would be almost a Double Top similar to November 2021.
So what do you think? Will the 1W MA50 come to Bitcoin's rescue yet again or the narrative will change this time? Feel free to let us know in the comments section below!
-------------------------------------------------------------------------------
** Please LIKE 👍, FOLLOW ✅, SHARE 🙌 and COMMENT ✍ if you enjoy this idea! Also share your ideas and charts in the comments section below! This is best way to keep it relevant, support us, keep the content here free and allow the idea to reach as many people as possible. **
-------------------------------------------------------------------------------
💸💸💸💸💸💸
👇 👇 👇 👇 👇 👇

BITCOIN $BTCUSD | BTC BEARISH TREND & STRATEGIC BITCOIN RESERVEBITCOIN BITSTAMP:BTCUSD | BTC BEARISH TREND & STRATEGIC BITCOIN RESERVE Mar09'25
Sparros Exchange Trend Table:
BITSTAMP:BTCUSD Weekly: Bullish
BITSTAMP:BTCUSD Daily: Bearish
BITSTAMP:BTCUSD 4H: Bearish
BITSTAMP:BTCUSD 1H: Bearish
Bitcoin Zones:
Bitcoin BUY/LONG ZONE (GREEN): $90,500 - $106,000
Bitcoin DO NOT TRADE/DNT ZONE (WHITE): $84,000 - $90,500
Bitcoin SELL/SHORT ZONE (RED): $69,000 - $84,000
Bitcoin is currently trading at $86,000, reflecting a bearish trend after reaching its all-time high nearly two months ago. The cryptocurrency has experienced substantial volatility, with the price having previously consolidated in higher ranges.
As of recent developments, the U.S. government has announced a "Strategic Bitcoin Reserve," indicating the government’s growing commitment to digital assets. This move is seen as part of a broader strategy to strengthen the U.S.'s position as a leader in the global digital currency space, though no specific amount of Bitcoin has been disclosed for this reserve.
This is what I would personally look at before entering trades, everything is subject to change on a daily basis and as I analyze different timeframes and ideas.
ENTERTAINMENT PURPOSES ONLY, NOT FINANCIAL ADVICE!
trendanalysis, trendtrading, priceaction, priceactiontrading, technical indicators, support and resistance, bitcoin, bitcoin price, bitcoin halving, btcusd, btc,
BTC, BITSTAMP:BTCUSD , bitcointrades, bitcoinlong, btcusdlong, bitcoinshort, btcusdshort, bitcoinanalysis, bitcointrend, bitcoinrange, bitcointriangle, triangle, ascendingtriangle, chartpatterns, trianglechart, ascendingtrianglebreakout, chartpatternbitcoin, bitcointriangle, bitcoinhalvingschedule, bitcoinbreakout, bitcoinrange, bitcoinrangebreakout, triangularpattern, flag, bitcoinpatterns, bitcoinchartpatterns, btcpatterns, btctriangletrade, btctrianble, btctrend, btctrades, btclong, btcshort, btcrange, btcbreakout, btcbreakdown, bitcoinover100000, bitcoin100, bitcoinover100, onehundredthousand, bitcoinascendingtrianglepattern, bitcoinpullbacks, bitcoindrop, bitcoinpricerally

BITCOIN may take 1 month to form bottom but upside is huge.Bitcoin / BTCUSD is consolidating on the 1 stdev below following February's pullback.
With the 1day RSI rebounding after turning oversold, this reminds us of all the previous major Lows of the current Bull Cycle.
Those took around 1.5 - 2 months to be priced, so don't be susprised if Bitcoin doesn't rise before mid April.
The upside until the end of the year remains huge however and if it 'only' tests again the Mean MM, it can reach $140k.
If it approaches the 1 stdev above, the estimated value can be as high as $180k.
Follow us, like the idea and leave a comment below!!

BITCOIN and the People's Bank of China Liquidity.Bitcoin / BTCUSD is often correlated with traditional assets that can be easily related to like the USD, stock indices etc.
On this idea we introduce the Liquidity of the People's Bank of China and as you can see there is a strong correlation between the two.
Every time China's central bank pumps money into the markets, BTC enters a strong Bull Phase. On the contrary, when it starts tightening, BTC enters a Bear Phase.
For the past two years we've been inside a Bull Cycle. Towards the end of 2025, the Liquidity should have topped based on the Time Cycle tool, and that should be our signal to exit the market with the highest profit possible in this Cycle.
Follow us, like the idea and leave a comment below!!

BTCUSD: Historic comparison shows hyper rally about to begin.Bitcoin turned neutral again on its 1D technical outlook (RSI = 55.581, MACD = 979.600, ADX = 19.348) as it recovered last week's selloff and rebounded on its 1D MA200. Technically the pattern since 2024 is identical to 2020 as you can see on the chart above. The moment Bitcoin crossed again above its 1D MA50, a new hyper rally started. This suggests that a final target inside the 160,000 - 200,000 Zone is quite possible to take place.
## If you like our free content follow our profile to get more daily ideas. ##
## Comments and likes are greatly appreciated. ##

BITCOIN Like a well tuned Swiss clock...Bitcoin (BTCUSD) has had a red February with a correction that touched its 1D MA200 and almost hit the 1W MA50 (blue trend-line), spurring massive liquidations and ETF outflows. On the wider picture though and the long-term technical trend of this Cycle, this looks nothing more than a normal technical pull-back at the start of the last year of the Bull Cycle.
More specifically, since the start of the current Bull Cycle following the November 2022 market bottom, BTC has been replicating to almost perfection the 2015 - 2017 Bull Cycle. As this chart on the 1W time-frame shows, every medium-term top and bottom since July 2023, matches harmonically the tops and bottoms since July 2015.
In addition, the 1W RSI is now on its 2nd bottom of the 'Buy the dip Volatility Phase', which started after the Higher Lows trend-line that was initiated on the market bottom, peaked and turned sideways. In 2016 - 2017, that was the ultimate guide to buy low through Bitcoin's last year of Bull Cycle all the way to the Top.
Based on this analogy, BTC should now form a Channel Up that might form the next Higher High in June, pull-back in July, then new Higher High in August, pull-back in September and final push for a Cycle Top around November. Based on this pattern, this may very well be around $200k but again, a 1W RSI top sell signal is more fitting.
But do you think the market will continue replicating the 2015 - 2017 Bull Cycle all the way to the top? And if yes, is a $200k peak plausible? Feel free to let us know in the comments section below!
-------------------------------------------------------------------------------
** Please LIKE 👍, FOLLOW ✅, SHARE 🙌 and COMMENT ✍ if you enjoy this idea! Also share your ideas and charts in the comments section below! This is best way to keep it relevant, support us, keep the content here free and allow the idea to reach as many people as possible. **
-------------------------------------------------------------------------------
💸💸💸💸💸💸
👇 👇 👇 👇 👇 👇

BITCOIN Is this a healthy Bull Cycle pullback or new BEAR CYCLE?Bitcoin (BTCUSD) has broken below the $90k barrier, reaching so far today 89000. The market is undeniably bleeding and this is roughly a -19% price decrease from January's All Time High (ATH). Talks about the end of this Bull Cycle have resurfaced again, but is this the start of a new Bear Cycle or simply a usual technical pull-back during a Bull Cycle?
Well we can find the answer by examining the 3 most recent Bull Cycles. As you can see, such declines are common during Bull Cycles, and they've been very well present on the current (2023 - 2025) Bull Cycle as well.
Going back to the 2015 - 2017 Bull Cycle, we can see four -40% corrections, with an average Cycle decline of -35.28%. The average in the following Bull Cycle (2019 - 2021) declined to -26.12% with many -30% corrections this time. On the current Cycle, the average is so far -23.60% with the vast majority of corrections being around -20%, which is exactly what we are up against at the moment.
As you realize, the corrections have been greater in the past, which is natural as so were the total Cycle gains, so the higher the rallies, the stronger the corrections have been. As Bitcoin started to normalize, become mainstream and adopted, the Cycles returns started to diminish, offering subsequently smaller/ more manageable pull-back phases.
As a result, it is very likely for BTC to be experiencing at the moment a typical Bull Cycle pull-back and equally probable not to diverge much from the -20% mark of the current Cycle standard.
But what do you think? Is this the start of a new Bear Cycle or just a Bull Cycle pull-back? And if it's the latter, will it stop around the current -20% levels? Feel free to let us know in the comments section below!
-------------------------------------------------------------------------------
** Please LIKE 👍, FOLLOW ✅, SHARE 🙌 and COMMENT ✍ if you enjoy this idea! Also share your ideas and charts in the comments section below! This is best way to keep it relevant, support us, keep the content here free and allow the idea to reach as many people as possible. **
-------------------------------------------------------------------------------
💸💸💸💸💸💸
👇 👇 👇 👇 👇 👇

BITCOIN Drops Below Major Support - Is $93,000 the Next Target?COINBASE:BTCUSD has decisively broken below a key support level, signaling a potential shift in momentum. The recent price action shows a rejection at this broken support, now acting as resistance, indicating that sellers are regaining control. This rejection reinforces the bearish outlook, as failed attempts to reclaim the level suggest continued downside pressure.
If bearish momentum persists, BTC could extend its decline toward the $93,000 support zone, a key level where buyers may attempt to step in. However, a sustained move back above the resistance zone would invalidate the bearish setup, signaling a potential shift in momentum. In this scenario, buyers could regain strength, possibly driving the price higher and negating the bearish bias.
Traders should remain cautious and monitor price action around these key levels to confirm directional bias before committing to a position. Risk management remains essential, given the volatility of BTC/USD.
