BITCOIN gap below @ $84,435We have a gap on CME futures at about $84,435 and this is something to take note of. Depending on if/ and when retest this price level, it could be a place to go long. Not financial advice, DYOR.
Bitcoin-btcusd

BTCUSD - Consolidation Likely to Resolve with Bullish BreakoutThe Bitcoin/USD 4-hour chart displays a consolidation pattern after recovering from the March lows near $77,000, with current price action hovering around $83,928. Following a recent test of resistance at $86,500, a minor pullback appears to be underway, but the higher probability move remains to the upside as indicated by the directional arrows on the chart. The price has been forming a series of higher lows since the March 11 bottom, suggesting accumulation and underlying bullish momentum. Key to this outlook is the strong support established by the blue reaction zone near $76,000-$78,000, which has successfully contained selling pressure. Traders should monitor for a potential shallow retracement before the anticipated push toward the orange resistance level at $87,650, which represents the next significant hurdle. A decisive break above this resistance would likely trigger an acceleration in buying momentum and confirm the bullish scenario, potentially opening the path toward retesting the $90,000-$92,000 region in the coming sessions.
Disclosure: I am part of Trade Nation's Influencer program and receive a monthly fee for using their TradingView charts in my analysis.

US30 - Catch The Next Wave!US30 is currently in an uptrend, with price action respecting a well-defined ascending channel. We anticipate another bounce from channel support.
In Wave 2, price was rejected at the 38.2% Fibonacci retracement level, and we expect a similar reaction for Wave 4.
Our strategy is to wait for price to enter the buy zone, between the 38.2% and 50% Fibonacci retracement levels, and look for bullish reversal signals before entering a position.
Potential Bullish Reversal Signals:
Trendline break
Break of structure (BOS)
Other confirmation patterns
Trade Plan:
- Monitor price movement into the buy zone, aligning with channel support.
- Enter long positions upon confirmation of bullish price action, placing stop-loss below the established low formed after bullish confirmation.
Target levels: 45,000 and 48,500, with the remainder held for a potential extended swing trade.
Goodluck and as always, trade safe!

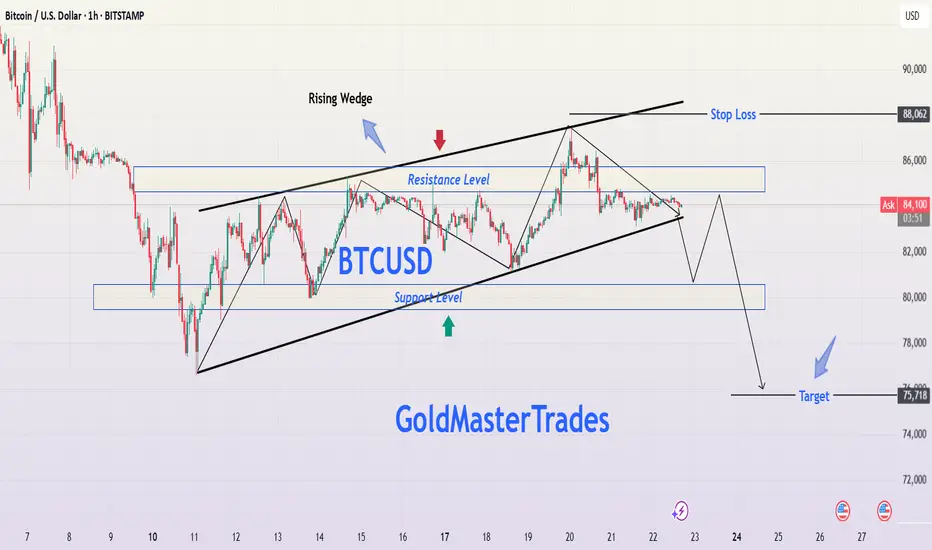
BTCUSD Bitcoin Rising Wedge Breakdown – Professional AnalysisBitcoin's price action is forming a Rising Wedge pattern on the 1-hour chart, a well-known bearish reversal formation. This pattern suggests that although the price has been making higher highs and higher lows, the upward momentum is weakening. Historically, when a rising wedge breaks to the downside, it often leads to strong downward movement, making it an ideal shorting opportunity.
This analysis will cover the pattern formation, key support and resistance levels, price action expectations, trading strategy, and risk management to ensure a well-informed trade setup.
1. Chart Pattern Breakdown: Understanding the Rising Wedge
Formation of the Rising Wedge
The price has been moving within two converging trendlines (black lines), forming a wedge shape.
The slope of both the upper and lower trendlines is positive, indicating an uptrend, but the lower trendline is steeper, suggesting weakening bullish pressure.
As Bitcoin moves higher, buying volume is declining, indicating that buyers are losing control.
The price has tested the upper resistance trendline multiple times, failing to break above it, further confirming bearish exhaustion.
The lower trendline has acted as strong support, but multiple touches suggest a possible breakdown soon.
Why This Pattern is Bearish
The rising wedge is inherently bearish because it signals that although the price is rising, the upward movement is slowing down. Eventually, the price is likely to break below the lower support trendline, triggering a sharp sell-off.
A breakdown from this wedge structure would confirm the start of a downtrend, making it an excellent opportunity for short traders.
2. Key Technical Levels to Watch
Resistance Level (~$86,000 - $86,500) - Strong Sell Zone
Bitcoin has repeatedly failed to break above this zone, indicating heavy selling pressure.
If the price unexpectedly moves above this level, the bearish setup would be invalidated.
Support Level (~$80,000 - $80,500) - Breakdown Zone
This support level has held strong multiple times.
If BTC loses this zone, it will likely trigger a massive drop due to stop-loss orders being hit and panic selling.
Stop Loss ($88,062) - Risk Management
A stop loss above $88,062 ensures protection against unexpected bullish breakouts.
This level is placed just above recent highs to minimize the risk of premature stop-outs.
Target Level ($75,718) - Profit Objective
The projected price target is based on measuring the height of the wedge and applying it to the breakout point.
This level also aligns with a major historical support zone, where buyers might step in.
3. Trading Setup & Strategy
Bearish Trading Plan - Short Setup
📌 Entry:
Enter short after Bitcoin breaks below the wedge’s lower support and confirms the breakdown by retesting support as new resistance.
Ideal entry price is around $81,500 - $82,000 after confirmation.
📌 Stop Loss:
Place above $88,062, which is beyond the wedge’s upper resistance.
This protects against unexpected bullish breakouts.
📌 Take Profit:
First target: $78,000 (psychological support).
Final target: $75,718 (technical breakdown target).
Confirmation Signals for a Strong Short Trade
✔ Candle Close Below Support – A 1-hour candle closing below the wedge confirms a breakdown.
✔ Increase in Selling Volume – Rising bearish volume supports downward momentum.
✔ Retest of Broken Support as Resistance – If the price retests the wedge’s lower trendline and fails to reclaim it, it confirms further downside.
4. Risk Management & Considerations
Risk-to-Reward Ratio: The trade offers a 3:1 risk-reward ratio, making it highly favorable.
Market Conditions: External news events, institutional activity, or macroeconomic trends (like inflation reports) could impact price action.
Bear Trap Possibility: If Bitcoin breaks below but quickly reclaims support, it could be a fakeout, so wait for confirmation before entering.
5. Alternative Scenario – When to Invalidate the Bearish Outlook?
Although the primary expectation is a bearish breakdown, we must consider alternate scenarios:
🚨 Bullish Invalidation: What if Bitcoin Rallies?
If Bitcoin breaks above the resistance zone at $86,500 - $88,000, the rising wedge breakdown would be invalidated. In that case:
✅ A breakout above $88,062 could trigger a short squeeze, pushing BTC toward $90,000+.
✅ Bulls will regain control, shifting the trend to bullish continuation instead of reversal.
🔹 In such a case, traders should exit short positions and re-evaluate market conditions before re-entering trades.
6. Conclusion – Trading Plan Summary
📊 Current Bias: Bearish 📉
🔹 Pattern: Rising Wedge (Breakdown Expected)
🔹 Entry: Short after wedge breakdown & confirmation
🔹 Stop Loss: Above $88,062
🔹 Target: $75,718
Bitcoin is forming a classic Rising Wedge, which historically leads to strong downward movement once it breaks support. If BTC follows the expected scenario, a high-probability short trade is in play, targeting a decline toward $75,718. However, traders must wait for confirmation and manage risk effectively to avoid fakeouts.
📢 Stay updated, follow price action closely, and trade responsibly! 🚀
BTCUSD: The Cycle won't peak before September!Bitcoin remains neutral on its 1W technical outlook (RSI = 47.334, MACD = 3198.500, ADX = 54.017) which, having kept the 1W MA50 intact as Support, suggest that this is the ideal level to buy again upon the continuation of the Bull Cycle. Despite the recent 2 month correction, the Cycle hasn't peaked and according to the Pre-Halving/ Post-Halving theory, that suggests that the time from the Cycle's Bottom to the Halving is almost identical to the time form the Halving to the Cycle's Top, we have until the end of September before the bull run is over. And that's because the range from the Cycle's Bottom to the 4th Halving was 75 weeks (525 days), which indicates that it will take around the same amount of time from the Halving before the Bull Cycle tops. See how amazingly consistent that has been on all of prior 3 Cycles. Consequently, the best strategy here would be to hold and start selling in September.
## If you like our free content follow our profile to get more daily ideas. ##
## Comments and likes are greatly appreciated. ##

Bitcoin in coming days ...frankly, Bitcoin will reach $89000 in the coming days.
Give me some energy !!
✨We spend hours finding potential opportunities and writing useful ideas, we would be happy if you support us.
Best regards CobraVanguard.💚
_ _ _ _ __ _ _ _ _ _ _ _ _ _ _ _ _ _ _ _ _ _ _ _ _ _ _ _ _ _ _ _
✅Thank you, and for more ideas, hit ❤️Like❤️ and 🌟Follow🌟!
⚠️Things can change...
The markets are always changing and even with all these signals, the market changes tend to be strong and fast!!

BITCOIN Will this historic level break too?Bitcoin (BTCUSD) remains supported on its 1W MA50 (blue trend-line), which is its main Bull Cycle Support, despite the recent volatility. As mentioned numerous times, in periods of uncertainty it helps you maintain an objective long-term perspective if you zoom out and look on the wider time-frames.
On this 1W chart, we can see that so far all of BTC's Cycle's have followed the same pattern. The Bear Cycle bottoms and the first bounce of the Bull Cycle aims at breaking above the ATH Lower Highs trend-line (blue Arc). It is what we call the 'Growth Channel' that guides the market from its Cycle bottom to break above the ATH Lower Highs and when it does the Parabolic Rally Phase (green Rectangle) starts. The most aggressive part is when the price breaks also above its Growth Channel.
This is the only Resistance level that has yet to be broke on this Cycle. If it does, the market will explode to Targets above $200k that will start putting it to capitalization levels that would require earth shattering catalysts in terms of adoption. A continuation of expansion within the boarders of the Growth Channel however can easily target $150k. Notice that throughout the whole process of the Growth Channel expansion on all Cycles historically, the 1W MA50 (blue trend-line) tends to hold and support.
So what do you think will happen this time? Will Bitcoin break above the Growth Channel and offer us another proper Parabolic Rally or will it be a more standard rise within it? Feel free to let us know in the comments section below!
-------------------------------------------------------------------------------
** Please LIKE 👍, FOLLOW ✅, SHARE 🙌 and COMMENT ✍ if you enjoy this idea! Also share your ideas and charts in the comments section below! This is best way to keep it relevant, support us, keep the content here free and allow the idea to reach as many people as possible. **
-------------------------------------------------------------------------------
💸💸💸💸💸💸
👇 👇 👇 👇 👇 👇

BITCOIN - Depth of Correction Update...After identifying an error in the recognition of Wave D, Please be aware that price is likely to continue lower than expected and may find support at the 50% or .618 retracement areas. Trade accordingly and I will post an update later today.
Last pivot high is 84,857

BITCOIN - Wave Count Update For Long Trade Idea...A slight shift in the overall interpretation of this structure.
We're still watching for a break above 93K for confirmation, but for those who trade with leverage, this analysis could provide an edge.
If it plays out as expected, we may see a fairly tight stop.
A decisive move higher is needed soon to confidently validate this setup.

BTCUSD: Staying bullish with this breakthrough analysis.Bitcoin remains marginally neutral on its 1D technical outlook (RSI = 45.889, MACD = -2304.900, ADX = 28.298) as it erased yesterday's Fed gains. Nevertheless, this doesn't make us lose sight of the bigger picture. On this 1M chart, we have selected all Decembers, as they hold critical importance for BTC Cycles. Both bottoms and tops tend to be priced around them and in between two consolidation phases take place. Don't let the short term volatility cloud your long term perspective. This Cycle hasn't topped yet. Stay bullish.
## If you like our free content follow our profile to get more daily ideas. ##
## Comments and likes are greatly appreciated. ##

Bitcoin: Big pullback still bullish!We had quite the pullback but remember we will still pump up. Beautiful head and shoulders we ripped to the downside. Let’s hold this daily 200MA. If we can do that today we have a nice symmetrical triangle that will continue to the upside.

$DOGE - Bear Trap BuyReposting my analysis from 3/8 as it was delisted b/c I referenced a non-TV external account. Also, a disclaimer since I've quickly discovered that people like to chirp and demean ideas on TV:
This is an IDEA. I maintain bull and bear cases for every underlying I analyze. My opinion about an underlying can change exceedingly quickly based on price action and how price's evolution either confirms or violates TREND (I define trend scholastically, NOT inferentially). I also may have 1 directional opinion about a security's higher timeframe and an opposing directional stance about a lower TF. Markets are fractal. Any serious trader/analyst understands what I'm articulating. This business is NOT about predicting. It is about understanding participant psychology, order flow, statistical distribution, risk vs. reward, profit margin, and probabilities.
With that said, here's my post from 3/8:
This is a technical (supply/demand) setup and is not a fundamental endorsement for CRYPTOCAP:DOGE ownership. $DOGE/USD (and crypto more broadly) has declined markedly (~60%) from December '24 highs. Late last month, low-quality daily demand (0.2021-0.1853) produced a minor bounce. DOGE quickly found sellers in advance of the opposing 1D supply zone (0.2428-0.2615), though, and was rejected. DOGE/USD appears poised for further near-term downside, with the weekly RSI threatening the 40 level.
If DOGE/USD presses lower and trades < 0.1813, the next pocket of daily demand = 0.1700-0.1419. More significantly, DOGE has a well-formed weekly buy zone @ 0.1513-0.1280. DOGE/USD's intermediate-term uptrend is controlled by 0.0805 (low of the corrective segment 3/25/24 - 8/5/24). Trend-continuation buying is valid within the bounds of the corrective segment, which DOGE traded into in early Feb. Buys are supported by 78.6% and 88.6% Fibonacci retracement levels and, to a lesser degree, Anchored VWAP + 1W Bollinger Band lower bound (not pictured).
Given crypto's broader price action and bearish momentum, confirmation entries are recommended. Potential buyers, depending on risk tolerance, should reference intraday timeframes for trend reversal signals vs. "catching a falling knife". Should DOGE bottom, preliminary target (T1) would be in advance of weekly supply @ 0.2398-0.2874 (use LTFs to refine and ID smaller sell zones that could challenge a rally). Trading > 0.2874 sets the stage for higher prices, with T2 supply 0.3288-0.3648. If DOGE/crypto approach T2 prices with significant bullish momentum (reference RSI), we could see subsequent prints in excess of December's 0.4846 high.
As always, feedback's welcome. Godspeed!
JHart

UNIUSDT Buy SignalUNI Buy signal on H1 chart. This coin has strong bullish outlook on all Timeframes. Risk reward 1/3

BNBUSDT BuyBinance coin has consolidation on H4 chart, between 560 - 630 levels. now price is on the resistance and tries to break it to reach 690 level. Risk reward 1/2

BITCOIN The Ultimate Cycle Model calls for $160k!Bitcoin (BTCUSD) is rebounding following yesterday's Fed Rate Decision. Technically the rebound has already started 10 days ago after the market nearly bottomed on the 1W MA50 (red trend-line). This is the strongest long-term Support level, as it is where BTC priced Lows and rebounded on August 05 2024 and September 11 2023, but it is not the only one.
With the current 2023 - 2025 Bull Cycle pattern being a Channel Up, this is the absolute and ultimate model that has been guiding the price action and can help estimate any future moves. Given that, it's also the 0.382 Fibonacci retracement level that supported both Lows (as well as the current one) on the 1W MA50 mentioned above. As a result, we are so far on a double Support cluster.
The 1W RSI comes in as the 3rd Support, as it hit and is rebounding now on its 2-year Support level, where the bounces of September 07 2024 and September 11 2023 happened. It is also important to mention that the Channel Up can be divided into two phases, Phase 1 (green Channel Up), which traded within the 0.0 - 1.0 Fibonacci range and Phase 2 (blue Channel Up), which trades within the 0.5 - 1.5 Fibonacci range.
The symmetry within those patterns are so high that the two Bullish Legs of Phase one have both rallied by +100.64%. If Phase 2 follows the same dynamic, and there is no reason to assume it won't as the Bearish Legs have been almost identical, we can assume that the Bullish Leg that has just started will rise by +121.48%, same as the previous one (Aug - Dec 2024). That gives us a Target estimate of $160000.
So do you think that BTC has bottomed on this Triple Support Cluster and if so, can it reach $160k by the end of this Cycle? Feel free to let us know in the comments section below!
-------------------------------------------------------------------------------
** Please LIKE 👍, FOLLOW ✅, SHARE 🙌 and COMMENT ✍ if you enjoy this idea! Also share your ideas and charts in the comments section below! This is best way to keep it relevant, support us, keep the content here free and allow the idea to reach as many people as possible. **
-------------------------------------------------------------------------------
💸💸💸💸💸💸
👇 👇 👇 👇 👇 👇

BTCUSD | Rising Wedge Breakdown – Bearish SetupChart Overview:
This chart represents Bitcoin (BTC/USD) on the 1-hour timeframe and showcases a Rising Wedge pattern. The price action has reached a key resistance level, and a potential breakdown scenario is unfolding.
1️⃣ Pattern Identification: Rising Wedge Formation
A Rising Wedge is a bearish reversal pattern that forms when price moves within two converging upward-sloping trendlines. The narrowing price range indicates a weakening trend, and a breakdown usually leads to a significant price drop.
Upper Trendline (Resistance): Marked in blue, this trendline connects the higher highs.
Lower Trendline (Support): Also in blue, connecting the higher lows.
Breakdown Confirmation: The price has already moved below the wedge support, confirming the bearish bias.
2️⃣ Key Price Levels & Zones
🔹 Resistance Zone (Blue Box)
This strong resistance level has repeatedly rejected the price.
The final rejection led to a breakout failure and potential trend reversal.
🔹 Support Zone (Blue Box)
A strong demand zone, but a breakdown below it triggers a bearish trend.
This level is now acting as potential resistance after the breakdown.
🔹 ATH (All-Time High) – $87,566
This marks the highest price level reached in the given timeframe.
3️⃣ Market Structure Breakdown
🔻 Bearish Momentum & Breakdown
After touching the resistance, BTC failed to sustain upward movement.
A breakout of the wedge's lower trendline confirms a trend reversal.
Price action suggests a lower-high, lower-low structure, indicating a bearish market shift.
📉 Expected Price Movement (Wave Structure)
The breakout retest could result in a small pullback to previous support (now resistance).
After confirmation, price is likely to continue downward in a wave-like structure.
Fibonacci levels or key support zones will act as profit-taking targets.
4️⃣ Trade Setup & Targets
🔻 Short Setup (Bearish Trade Idea)
Entry: On a successful retest of the broken support zone.
Stop-Loss (SL): Above the previous resistance zone for risk management.
Take Profit (TP) Targets:
TP 1: $81,638
TP 2: $77,897
Final Target: $74,990
5️⃣ Summary & Conclusion
📌 BTC/USD has broken out of a Rising Wedge pattern, confirming a bearish trend.
📌 A pullback and retest may occur before further downside continuation.
📌 The chart suggests a short opportunity, targeting lower support zones for potential profit-taking.
📌 Traders should manage risk with a well-placed stop-loss above key resistance.
This setup aligns with technical analysis principles, confirming a high-probability short trade for BTC. 🚀

BITCOIN - Long Trade Idea - Possible Move Higher Incoming...This video follows up on the chart I posted last night, where I suggested that Bitcoin could break past its all-time highs and potentially double in value from its current levels.
This analysis is based on the AriasWave methodology, which offers a clearer perspective compared to the often-confusing Elliott Wave approach.
Check out the related idea below for the original chart, and in this video, I update that analysis with key levels to watch and potential risks to consider.

BUBBLE RUN of global marketsTheory! I just like to visualize similar global market events.
NASDAQ:NVDA now vs. Cisco from 1991-2002 — it looks almost identical.
The years 2026-27 could mark the final stage of the current “bubble run”:
> an enormous number of crypto ETFs (even for worthless shitcoins)
> overleveraged funds, from small players to industry leaders
> AI projects with minimal revenue but insanely high infrastructure costs
> soaring Gold prices alongside a decade-long decline in the U.S. manufacturing index, all while the stock market remains expensive
> OpenAI, crypto exchanges, and AI companies with no real revenue planning IPOs in 2026+
I believe we are currently in a Bubble Run!
This could be great for Bitcoin, because historically, Gold (over the past 100 years) has reached all-time highs during the final phase of a stock market bubble and continued rising until the market’s final dip. Then, smart money starts a new bull cycle — selling gold to buy cheap stocks.

BITCOIN The 2021 Pivot trend-line that is coming to its rescue.Bitcoin (BTCUSD) has stayed stable after last week's rebound on the 1W MA50 (blue trend-line), which has been the level that offered support on the Bull Cycle Channel's previous Higher Low (August 05 2024).
Technically however, that is not the only major Support level that may be coming to BTC's rescue as we've identified the Pivot trend-line that started on the April 12 2021 High as a Resistance and since then made another 2 contacts (as rejections). This is the first time now that is being tested as Support.
During the previous Cycle (2018 - 2021) a similar Pivot trend-line was the level that supported Bitcoin during the last year of its parabolic rally on January and June 2021. The June 2021 contact in particular tested the 1W MA50 as well, which is the exact situation we're in right now. That double support hold initiated the final rebound towards the Cycle's new All Time High (ATH).
Check also how similar the 1W CCI patterns between the two fractals are and based on that, a 1W CCI reading at 200.00 would be a solid level to sell and take profit. As a result, we expect this Cycle's Channel Up to accelerate the current rebound, technically its Bullish Leg and make a new ATH, which would be the Cycle's new Top, ideally with a CCI at 200.00.
So do you think this cyclical Pivot trend-line is coming along with the 1W MA50 to BTC's rescue? Feel free to let us know in the comments section below!
-------------------------------------------------------------------------------
** Please LIKE 👍, FOLLOW ✅, SHARE 🙌 and COMMENT ✍ if you enjoy this idea! Also share your ideas and charts in the comments section below! This is best way to keep it relevant, support us, keep the content here free and allow the idea to reach as many people as possible. **
-------------------------------------------------------------------------------
💸💸💸💸💸💸
👇 👇 👇 👇 👇 👇

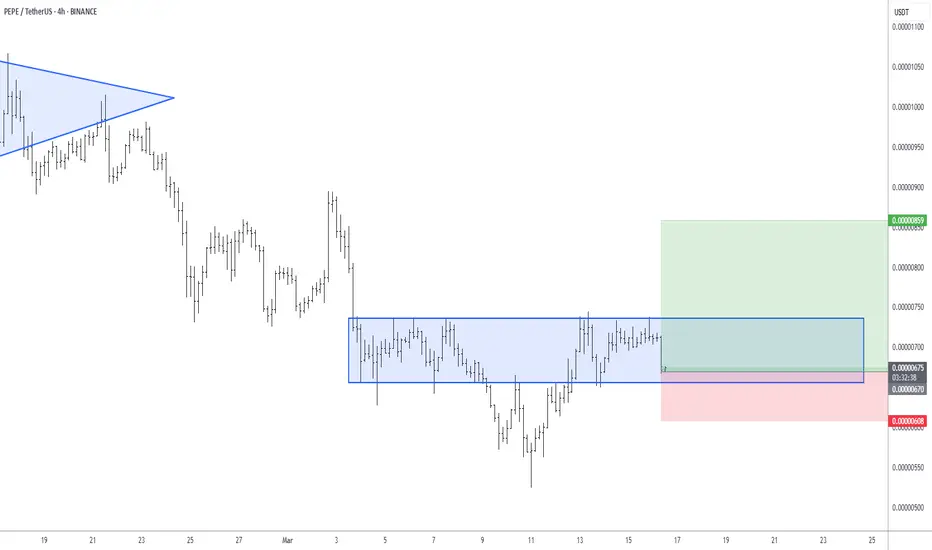
PEPEUSDT LongWe see consolidation on the PEPE H4 chart. Buyers have already been liquidated at the top of the downtrend. Now, the market is moving up to liquidate the sellers of this consolidation. Risk-reward ratio 1:3
BTCUSD: This isn't the Top by any meansBitcoin remains slightly bearish on its 1D technical outlook (RSI = 41.137, MACD = -3097.700, ADX = 33.471) as even though it appears its trading on a macro bottom, just over the 1W MA50 (1W RSI = 45.068), it hasn't broken out yet. The market undoubtedly took a psychological hit with February's drop but despite the voices calling for a new bear market, we are here to show you why this Cycle hasn't topped yet and is still far from doing so.
This metric measures BTC's temporary stops/ tops during a Bull Cycle. It is a Halving-to-Halving method, starting on the most recent Halving and ending on the next one. Stop 1 is where the starting Halving takes place and the market pulls back. Stop 2 is the next pullback on the 0.236 Time Fibonacci level. The 0.382 Fib prices Stop 3 and basically the Cycle Top. This has been happening on both previous Cycles exactly as described and on the 2012-14 Cycle it just had to be adjusted a little before the 1st Halving due to the Cycle being much shorter since it was the earliest. Nevertheless, it fits the Stop points perfectly.
Note also that distance from the Halving (Stop 1) to Stop 3 has always been 76/78 weeks. This suggests the we can have a new Cycle Top by October 20th 2025 the latest.
## If you like our free content follow our profile to get more daily ideas. ##
## Comments and likes are greatly appreciated. ##

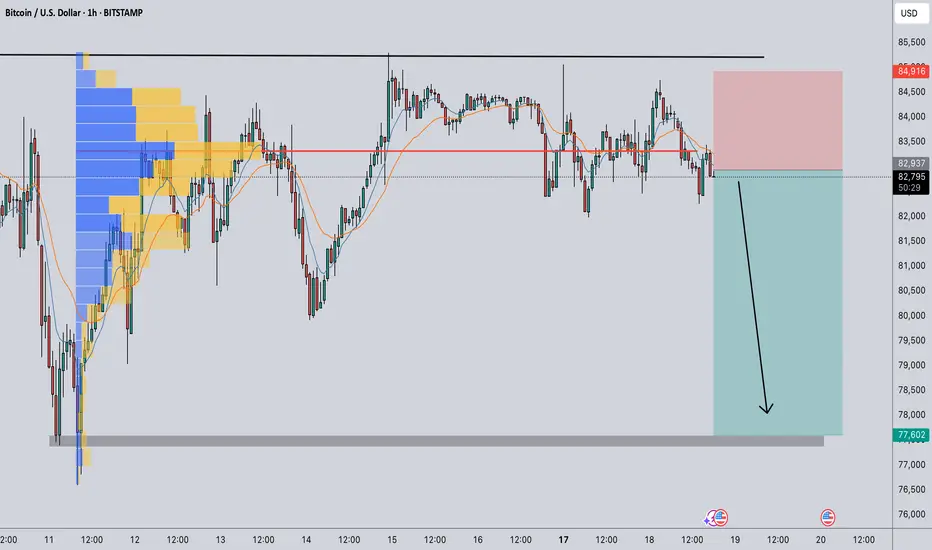
BITCOIN HEADING TO 77600 LEVELIt seems that there's an atmosphere of panic. When traders see significant price drops, it can lead to a cascade of selling, with more people fearing losses. This fear can create a liquidity trap where those entering long positions are quickly taken out as prices continue to decline.
In such scenarios, liquidations occur when leveraged positions are forcibly closed by exchanges to prevent further losses, which adds even more selling pressure. The cycle can become self-reinforcing; as prices dip, more traders panic and sell, leading to further declines.
Based on this scenario, I am confident in entering a short position with a favorable risk-to-reward ratio toward the 77600 level.
Follow me for more analysis
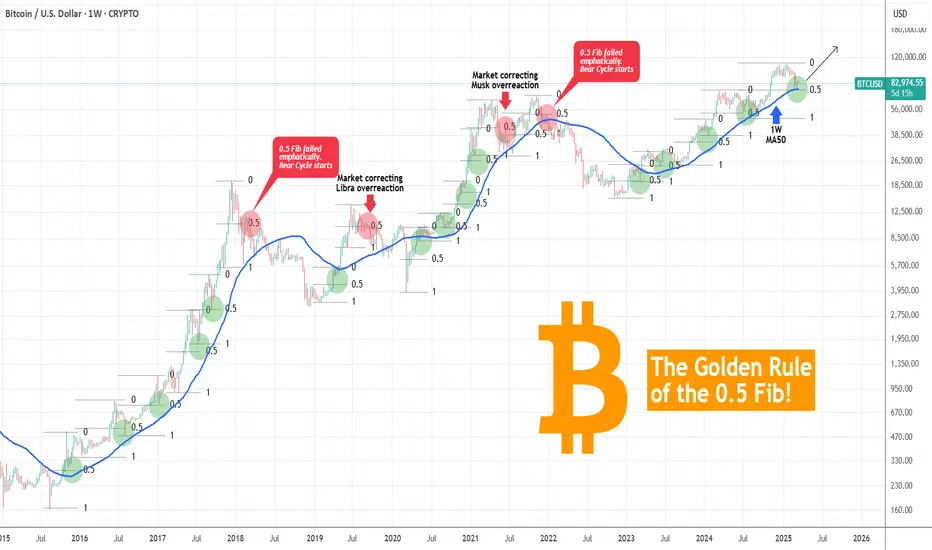
BITCOIN The 0.5 Fib Golden Rule! This is not a Bear Market yet!Bitcoin (BTCUSD) shook the bullish market sentiment last month, as late February saw it drop aggressively not just from the 109k All Time High (ATH) but also below the key psychological Support of $90000. We have discussed already how the 1W MA50 (blue trend-line) coming to its rescue, is the critical Support and rightfully so, but there is also another critical condition that is currently showing incredible strength, keeping BTC into Bull Cycle territory (for now).
That is the 0.5 Fibonacci retracement level Golden Rule. This suggests that BTC's corrections/ pull-backs up to the 0.5 Fib level are technical and perfectly systemic, especially with the 1W MA50 supporting. If anything, such pull-backs during a Bull Cycle are the most optimal buy opportunities. We are currently on an exact such opportunity as the price hit last week both the 1W MA50 and the 0.5 Fib.
In the past 10 years since the August 2015 Bear Cycle bottom, every correction up to the 0.5 Fib was a buy. In the 4 cases it broke, 2 were the signals of the 2018 and 2022 Bear Cycles and the other 2 signals of the market correcting the bullish overreaction to the Libra (2019) and Musk (2021) rallies. The latter though was still contained above the 1W MA50 and so would the 2019 one if it wasn't for the March 2020 COVID crash.
As a result, we still see no cause for concern (yet) and so far this is the best buy opportunity for Bitcoin since last year and the August 05 2024 Low.
But what do you think? Is this 0.5 Fib Golden Rule coming to push Bitcoin higher to its next ATH? Feel free to let us know in the comments section below!
-------------------------------------------------------------------------------
** Please LIKE 👍, FOLLOW ✅, SHARE 🙌 and COMMENT ✍ if you enjoy this idea! Also share your ideas and charts in the comments section below! This is best way to keep it relevant, support us, keep the content here free and allow the idea to reach as many people as possible. **
-------------------------------------------------------------------------------
💸💸💸💸💸💸
👇 👇 👇 👇 👇 👇