Bitcoin at final supportaccording to the weekly MA50 & fibonacci 61% , 74k looks the last support for bitcoin
Bitcoin-btcusd

BITCOIN Is this the last defense before the narrative changes?Bitcoin (BTCUSD) got yet again increasingly volatile during the weekend and is approaching the 1W MA50 (blue trend-line). As mentioned on the title, this is "the last defense" for BTC as so far this price action hasn't diverged a bit from the Channel Up of the 2015 - 2017 Bull Cycle but a break and 1W candle close below it, would jeopardize that.
** The key 1W MA50 **
In fact the only times that Bitcoin closed below its 1W MA50 during a Bull Cycle and the Cycle continued was of course during the March 2020 COVID global market flash crash and November 18 2019. But the current Bull Cycle is nothing like in 2019 - 2021, it doesn't have the initial overextension of the Libra hype (May - June 2019) or Elon's early 2020 hype nor of course the pandemic shutdown. On the contrary it is incredibly similar with 2015 - 2017 with the only difference being that, thanks to the ETF launch in January 2024, the market marginally breached the previous All Time High (ATH) earlier.
** Symmetry playing out **
So back to the similarities between those two Cycles. The Cycle count indicates that we are at the end of the (blue) Bull Rectangle in March 2017 (847 days) when the price almost tested the 1W MA50 and then started the (green) Parabolic Phase to new ATHs (217 days). Even in terms of 1W RSI and MACD, the two fractals are similar, with the RSI being on its 2nd 'Buy the dip Volatility Phase' bottom and the MACD on its 2nd Bullish Cross.
** How high can it get? **
Now as to how high the new Cycle Top can be, can be anybody's guess, but if it repeats the less aggressive 2021 Top, it could be on the 1.618 Fibonacci extension, i.e. around $170k, while if it repeats the (much more unrealistic for such short period of time in terms of market cap) 2017 Top, it could be on the 2.382 Fib ext, i.e. around $520k. The worst case scenario is to have Fib extension Tops on a decreasing rate, in which case the 1.5 - 1.382 levels are next, giving us a potential target range of 120k - 145k, which would be almost a Double Top similar to November 2021.
So what do you think? Will the 1W MA50 come to Bitcoin's rescue yet again or the narrative will change this time? Feel free to let us know in the comments section below!
-------------------------------------------------------------------------------
** Please LIKE 👍, FOLLOW ✅, SHARE 🙌 and COMMENT ✍ if you enjoy this idea! Also share your ideas and charts in the comments section below! This is best way to keep it relevant, support us, keep the content here free and allow the idea to reach as many people as possible. **
-------------------------------------------------------------------------------
💸💸💸💸💸💸
👇 👇 👇 👇 👇 👇

Bitcoin will make a Breakout Chart Analysis:
1. Timeframe and Price Context
Timeframe: 4-hour chart (each candlestick represents 4 hours of trading).
Price Levels:
The current price is $92,812.72, with a slight decrease of 0.23% as of the latest data point.
The price range on the chart spans from approximately $80,000 to $108,255 (the recent peak).
Trend Overview:
Late 2024: Bitcoin experienced a strong uptrend, peaking near $108,255.
Early 2025: The price has corrected downward, forming a descending triangle pattern, with the current level at $92,812.72.
2. Key Patterns and Annotations
Descending Triangle:
The chart features a descending triangle pattern, a common consolidation pattern that can signal either a continuation of a downtrend or a reversal.
Upper Resistance: A horizontal resistance line around $108,255 (the recent peak where the price failed to sustain higher levels).
Lower Support: A descending trendline (sloping downward) that the price has been testing, currently near $92,000-$93,000.
The price is nearing the apex of the triangle, suggesting an imminent breakout (upward or downward).
Accumulation Zone:
The chart labels an "Accumulation Zone" near the $80,000-$85,000 range, indicating a potential area where large players (e.g., whales) may have been buying during the correction.
The current price ($92,812.72) is above this zone, suggesting a bounce or stabilization after reaching this support.
Breakout Prediction:
An upward arrow with a Bitcoin symbol points toward $120,000 or higher, indicating a potential bullish breakout targeting a new all-time high.
3. Support and Resistance Levels
Support:
The $92,000-$93,000 level is acting as immediate support, aligning with the lower boundary of the descending triangle.
The $80,000-$85,000 accumulation zone is a stronger support level, likely a key area of buying interest during the correction.
If this support fails, the next level could be around $75,000 (a psychological and historical support).
Resistance:
The $108,255 level is a major resistance, marking the recent high.
The next significant resistance could be around $120,000 (as suggested by the arrow), a psychological level and a potential new all-time high.
4. Volume and Momentum (Not Visible but Inferred)
Volume bars are not clearly visible, but typical behavior suggests:
Volume likely peaked during the rally to $108,255 and decreased during the correction as selling pressure eased.
A breakout would require a volume spike to confirm, especially if the price breaks above the descending trendline (around $100,000-$105,000).
Momentum indicators (e.g., RSI or MACD) could indicate if Bitcoin is oversold or showing bullish divergence, supporting a reversal.
5. Potential Scenarios
Bullish Breakout:
If Bitcoin breaks above the descending trendline (around $100,000-$105,000) with strong volume, it could confirm the breakout.
The target of $120,000 (a ~29% move from $92,812.72) is plausible, especially if whale accumulation in the $80,000-$85,000 zone drives momentum.
This aligns with the upward arrow and suggests a resumption of the prior uptrend.
Bearish Breakdown:
If the price fails to hold the $92,000-$93,000 support and breaks below, it could signal a bearish continuation.
The next support at $80,000-$85,000 would be tested, potentially leading to further downside toward $75,000.
Consolidation:
If the price remains within the triangle (between $92,000 and the descending trendline), it might continue to consolidate until a catalyst (e.g., market news, volume surge) triggers a move.
6. Market Context
Whale Activity: The accumulation zone at $80,000-$85,000 supports your earlier narrative of whales accumulating during corrections to set up a breakout. This could indicate strategic buying by large players.
Market Sentiment: As the leading cryptocurrency, Bitcoin’s price heavily influences altcoins like Ethereum and UNISWAP (from your previous charts). A bullish breakout in BTC could trigger similar moves in the broader market.
Timing: The chart’s position near the triangle’s apex suggests a breakout could occur within days to a week on a 4-hour timeframe, depending on market conditions.

Ethereum will make a Breakout Ethereum is forming a correction before making a big upward movement. Whales are accumulating it while creating panic across the market to scare people out.

The bitcoin will continue decreaseOn the monthly chart it is visible that the turning figure was created. MACD shows divergence, other technical indicators it confirm. I expect decrease the price at least up to 0.5 according to Fibonacci - the purpose for me 62800.
Information provided is only educational and should not be used to take action in the market.

Two key scenarios for BTC - Q2 mostly sideays/down!Two scenarios at this point:
We have a new range, but it could break quickly since there’s an active downtrend expiring on the 20th.
That means I can’t blindly bid into the low $80Ks like before—it’s getting trickier, and we’ll need to rely on proper triggers.
If it breaks down and continues lower, I’d like to see the GETTEX:59K -$62K zone get tested.
The **uptrend remains intact**, and I think we can all agree that **Bitcoin could be higher later this year**. I don’t see it going above **$200K**, but at the very least, I expect it to challenge its current **ATHs**.
For now, I’m just focusing on **key levels** and patiently waiting for **triggers—if any**.
There are plenty of ways to play this:
- Another **mid-level retest** and **reclaim** → I'll go **long**.
- If it **bounces**, I’ll look to **short** into the **low $90Ks**.
- If **nothing happens** and it starts **breaking down**, then **$75K** is a key zone, and **$71K** becomes pivotal for both **longs and shorts**.
Just **keep your levels clear** and **wait** until they are breached.

Crypto summit disappoints, Bitcoin teeters on support Bitcoin surged on March 3 after Donald Trump announced a strategic crypto reserve, only to erase gains following erratic tariff announcements the following days.
Friday’s White House crypto summit, expected to be a turning point, fell flat. Trump met with top crypto executives, promising to ease Biden-era regulations, but offered only vague commitments. Instead of rallying, the market has declined further.
A silver lining for Bitcoin came with Friday’s weak jobs report, increasing the likelihood of Federal Reserve intervention. Historically, Bitcoin benefits when interest rates fall. Although this is yet to be reflected in the price.
Technically, BTC/USD is testing the first support on the pitchfork indicator, with the money flow index suggesting no buying pressure at the moment. A drop below Monday’s low of $81,620 could invalidate any bullish outlook.

NZDJPY - 2025 Plan. Make It Your Best Year Yet!Here we have the 2 Day chart for NZDJPY.
We've seen a massive impulse mid 2024. We are now in an ABC correction.
We are currently in wave B of the correction, subwave B. Expecting subwave C to complete wave B.
We're looking for a rejection of the fib zone and a drop of over 700pips.
Trade idea:
- Watch for rejection of fib zone
- Once rejection appears, enter with stops above the highs
- Targets: 86 (350pips), 83 (700pips)
Once we've completed this move down, we'll be looking for longs. We'll update this setup if there's enough engagement.
Goodluck and as always, trade safe!

BITCOIN $BTCUSD | BTC BEARISH TREND & STRATEGIC BITCOIN RESERVEBITCOIN BITSTAMP:BTCUSD | BTC BEARISH TREND & STRATEGIC BITCOIN RESERVE Mar09'25
Sparros Exchange Trend Table:
BITSTAMP:BTCUSD Weekly: Bullish
BITSTAMP:BTCUSD Daily: Bearish
BITSTAMP:BTCUSD 4H: Bearish
BITSTAMP:BTCUSD 1H: Bearish
Bitcoin Zones:
Bitcoin BUY/LONG ZONE (GREEN): $90,500 - $106,000
Bitcoin DO NOT TRADE/DNT ZONE (WHITE): $84,000 - $90,500
Bitcoin SELL/SHORT ZONE (RED): $69,000 - $84,000
Bitcoin is currently trading at $86,000, reflecting a bearish trend after reaching its all-time high nearly two months ago. The cryptocurrency has experienced substantial volatility, with the price having previously consolidated in higher ranges.
As of recent developments, the U.S. government has announced a "Strategic Bitcoin Reserve," indicating the government’s growing commitment to digital assets. This move is seen as part of a broader strategy to strengthen the U.S.'s position as a leader in the global digital currency space, though no specific amount of Bitcoin has been disclosed for this reserve.
This is what I would personally look at before entering trades, everything is subject to change on a daily basis and as I analyze different timeframes and ideas.
ENTERTAINMENT PURPOSES ONLY, NOT FINANCIAL ADVICE!
trendanalysis, trendtrading, priceaction, priceactiontrading, technical indicators, support and resistance, bitcoin, bitcoin price, bitcoin halving, btcusd, btc,
BTC, BITSTAMP:BTCUSD , bitcointrades, bitcoinlong, btcusdlong, bitcoinshort, btcusdshort, bitcoinanalysis, bitcointrend, bitcoinrange, bitcointriangle, triangle, ascendingtriangle, chartpatterns, trianglechart, ascendingtrianglebreakout, chartpatternbitcoin, bitcointriangle, bitcoinhalvingschedule, bitcoinbreakout, bitcoinrange, bitcoinrangebreakout, triangularpattern, flag, bitcoinpatterns, bitcoinchartpatterns, btcpatterns, btctriangletrade, btctrianble, btctrend, btctrades, btclong, btcshort, btcrange, btcbreakout, btcbreakdown, bitcoinover100000, bitcoin100, bitcoinover100, onehundredthousand, bitcoinascendingtrianglepattern, bitcoinpullbacks, bitcoindrop, bitcoinpricerally

BITCOIN - Long Trade Idea - Entry Confirmed with a Tight Stop...In this video, I walk you through a recount using AriasWave and explain how we can set up a strong trade entry with a tight stop.
The key support level for this trade is at 86,022—if the price drops below this, the trade idea would no longer be valid.
We've already received confirmation with a break above 86,500. Stay tuned for updates, as I’ll provide further insights if the price moves above 95,065, confirming the larger pattern.

BITCOIN may take 1 month to form bottom but upside is huge.Bitcoin / BTCUSD is consolidating on the 1 stdev below following February's pullback.
With the 1day RSI rebounding after turning oversold, this reminds us of all the previous major Lows of the current Bull Cycle.
Those took around 1.5 - 2 months to be priced, so don't be susprised if Bitcoin doesn't rise before mid April.
The upside until the end of the year remains huge however and if it 'only' tests again the Mean MM, it can reach $140k.
If it approaches the 1 stdev above, the estimated value can be as high as $180k.
Follow us, like the idea and leave a comment below!!

Bearish scenario for BTCIn trading and crypto world you have to be open to all possibilities. As we are seeing significant drop among alts and market makers manipulation. Money is withdrawed from markets and price is failing.
BTC price action reminds me 2021 year when after ATH there was a 50% drop.
Lot of similarities there - completed 5 waves, bearish div on higher timeframes, greed above 70/75, bullish sentiment, news etc.
On the other hand, current drop already liquidated more than 2b usd in one day...
We need to watch it closely and do not overtrade or do stupid FOMO.
In these time lev trades are not recommended.
THIS IS NOT A FINANCIAL ADVICE
MANAGE YOUR RISK AND ALWAYS USE STOPLOSS

Why I shorted BTC?In last weekend’s crypto analyses, I mentioned that many altcoins were in a support zone, with a strong chance of a reversal from that level.
Shortly after I published my analyses, the announcement regarding the federal crypto reserve was released, triggering a massive pump.
However, this surge was short-lived, and prices quickly retraced back to their initial levels. For me, this is not a good sign—when major positive news fails to sustain gains, it often signals weakness in the market.
Now, regarding Bitcoin: although its price remains above the announcement level, it has struggled to hold gains above the 91K support level and continues to break below it.
I don’t believe prices are dropping just to set up a massive bull run for everyone to buy in—this looks like a bearish signal to me.
As a result, I have shorted BTC and expect a decline to 75K. That said, with my stop-loss placed above the initial pump’s high, I’m currently running a 1:3 risk-reward ratio, which—regardless of the outcome—is ideal in my book.

BITCOIN and the People's Bank of China Liquidity.Bitcoin / BTCUSD is often correlated with traditional assets that can be easily related to like the USD, stock indices etc.
On this idea we introduce the Liquidity of the People's Bank of China and as you can see there is a strong correlation between the two.
Every time China's central bank pumps money into the markets, BTC enters a strong Bull Phase. On the contrary, when it starts tightening, BTC enters a Bear Phase.
For the past two years we've been inside a Bull Cycle. Towards the end of 2025, the Liquidity should have topped based on the Time Cycle tool, and that should be our signal to exit the market with the highest profit possible in this Cycle.
Follow us, like the idea and leave a comment below!!

BTCUSD: Historic comparison shows hyper rally about to begin.Bitcoin turned neutral again on its 1D technical outlook (RSI = 55.581, MACD = 979.600, ADX = 19.348) as it recovered last week's selloff and rebounded on its 1D MA200. Technically the pattern since 2024 is identical to 2020 as you can see on the chart above. The moment Bitcoin crossed again above its 1D MA50, a new hyper rally started. This suggests that a final target inside the 160,000 - 200,000 Zone is quite possible to take place.
## If you like our free content follow our profile to get more daily ideas. ##
## Comments and likes are greatly appreciated. ##

BTCUSD - Bull Extension Price right now has relatively been contained within an upward channel
In this chart i suggest a breakout of this trend line / channel and extension up to create a new ATH for this bull run
I have used the bars pattern from the 2016 - 17 run
Lets see what happens.
Daily chart

Bitcoin - A pattern you can't ignoreThis is the key that will help you make money on Bitcoin
According to my sources The Cryptocurrency Reserve in the US will be approved in May. But it will be too late to buy. When politicians get to cryptocurrencies it means it's our time to get out of the market.
And now I'll explain why the entire market will be down in September.
May through September will be the biggest bitcoin distribution, it will be much higher than the prices that are now
Since 2015, I have been fixating on this pattern:
The bull market always lasts 151-152 weeks (2.9 years).
A correction is 51-53 weeks (1 year).
And it worked without errors :
2017 : Peak in December - $19,783 (exactly within the cycle).
2018 : Bottom in November - $3,122 (in the bullseye again).
2021 : ATH in November - $68,789 (the cycle didn't fail).
2022 Bottom in November - $15.832 (in the bullseye again).
There are many publications with the same timings and decision-making
А 2023-2024 ? This was my record year! I bought when everyone was yelling “Crash!” and sold when the crowd was yelling “To the moon!”. All thanks to cold calculation instead of emotion .
🧠 Why does it work? Because the crowd is blind
When everyone is in a panic - I activate the algorithm :
А 2023-2024 ? This was my record year! I bought when everyone was yelling “Crash!” and sold when the crowd was yelling “To the moon!”. All thanks to cold calculation instead of emotion.
🧠 Why does it work? Because the crowd is blind
When everyone is in a panic - I activate the algorithm :
Timing : I enter at the end of a bearish cycle and exit at the peak of a bullish cycle.
Discipline : No “maybe it's time?” - just numbers.
Adaptation : Is the market evolving? My model is too. In 2025, my Academy will release an updated course - where I will share the most acutal information.
💥 Why am I disclosing this now?
Because there's not much time left until the end of the bull cycle, and I want you to be ready.
📉 “But isn't that risky?”
Risk is when you follow the crowd.
🔥 The END of 151 weeks will start sooner than you expect. Do I want you to miss out on the opportunity? Subscribe, save the post, write comments - and let's make money while others are looking for “magic indicators”.
Questions? Doubts? Write in the comments.
P.P.S. This is not “another prediction.” This is the key to the market, which I have been grinding for 11 years. And it's yours - if you have time.
Bitcoin's future is bright!
Best regards EXCAVO

BITCOIN Like a well tuned Swiss clock...Bitcoin (BTCUSD) has had a red February with a correction that touched its 1D MA200 and almost hit the 1W MA50 (blue trend-line), spurring massive liquidations and ETF outflows. On the wider picture though and the long-term technical trend of this Cycle, this looks nothing more than a normal technical pull-back at the start of the last year of the Bull Cycle.
More specifically, since the start of the current Bull Cycle following the November 2022 market bottom, BTC has been replicating to almost perfection the 2015 - 2017 Bull Cycle. As this chart on the 1W time-frame shows, every medium-term top and bottom since July 2023, matches harmonically the tops and bottoms since July 2015.
In addition, the 1W RSI is now on its 2nd bottom of the 'Buy the dip Volatility Phase', which started after the Higher Lows trend-line that was initiated on the market bottom, peaked and turned sideways. In 2016 - 2017, that was the ultimate guide to buy low through Bitcoin's last year of Bull Cycle all the way to the Top.
Based on this analogy, BTC should now form a Channel Up that might form the next Higher High in June, pull-back in July, then new Higher High in August, pull-back in September and final push for a Cycle Top around November. Based on this pattern, this may very well be around $200k but again, a 1W RSI top sell signal is more fitting.
But do you think the market will continue replicating the 2015 - 2017 Bull Cycle all the way to the top? And if yes, is a $200k peak plausible? Feel free to let us know in the comments section below!
-------------------------------------------------------------------------------
** Please LIKE 👍, FOLLOW ✅, SHARE 🙌 and COMMENT ✍ if you enjoy this idea! Also share your ideas and charts in the comments section below! This is best way to keep it relevant, support us, keep the content here free and allow the idea to reach as many people as possible. **
-------------------------------------------------------------------------------
💸💸💸💸💸💸
👇 👇 👇 👇 👇 👇

BTC Short - Stretch to TP $77kWyckoff scenario planning for possible 2025 top formation.
- Possible Phase B Sign of Weakness incoming in the next few weeks.
Short at $100K with a tp target 1 at $86K. A stretch target 2 at $77K aligns with the bottom of the local channel and intersects with the 4-hour 200 MA.
Presents good Long entry to new ATH at $112k.
Best, Hard Forky

Btc correctionsCRYPTOCAP:BTC Healthy Corrections are not the end but the fuel needed for another parabolic run!

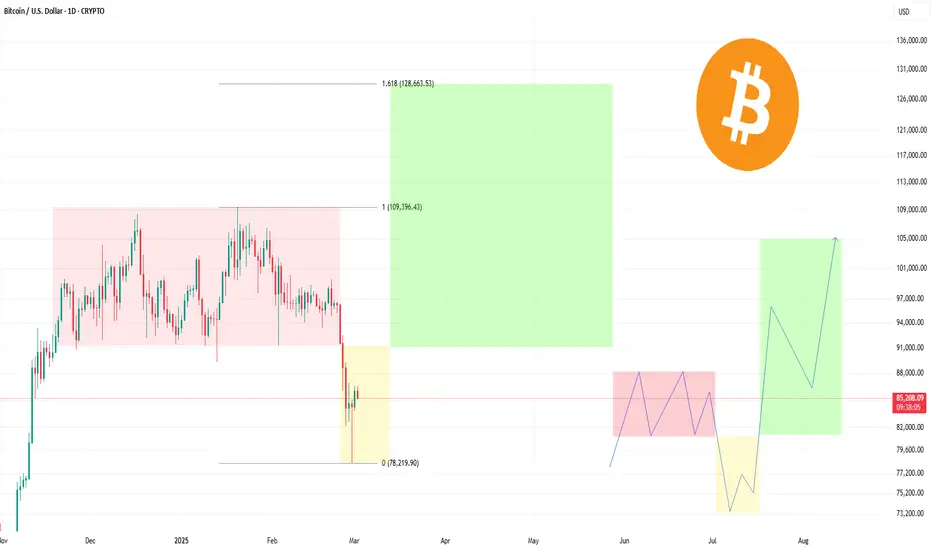
PO3 and Fibonacci: The Path to $128,000I've always been an advocate of analyzing data deeply and finding patterns where others see chaos. And today I want to share my perspective on one of the most exciting opportunities that are taking shape right now.
PO3 is not just an indicator, but a real key to understanding how the market shapes its moves. When you combine it with Fibonacci levels, a unique picture opens up in front of you that gives you a glimpse into the future. This is exactly the case when the data speaks for itself. Now, analyzing the current dynamics, I come to the conclusion that we can expect a significant rise in price to the level of 128,000 dollars. PO3 shows a clear direction and Fibonacci levels confirm the potential for such a move.
So, my prediction: $128,000 is not the limit of dreams, but a realistic goal that we can achieve. And those who understand this trend have a unique advantage.
Alex Kostenich,
Horban Brothers.
Bitcoin - Just Objectively Look At The Chart.Bitcoin ( CRYPTO:BTCUSD ) remains very bullish lately:
Click chart above to see the detailed analysis👆🏻
Many traders are actually calling the top on Bitcoin but if we objectively look at the chart, situation is entirely different. First, Bitcoin just broke above the previous cycle high with a massive candle and second, we still have a valid rising channel acting as a major support.
Levels to watch: $70.000, $300.000
Keep your long term vision,
Philip (BasicTrading)

Bitcoin, Mind The Gap (85,720) The massive move initiated from Trumps tweet Sunday about the Crypto Strategic Reserve has left a massive gap on the Bitcoin Futures Chart. Gaps tend to get fill sooner rather than later, with a high 90% hit rate on gaps getting filled.
We could see a pullback this week to fill the gap with another run up following back above 90k to save the weekly close ... again.
We see confluence with the golden pocket (0.6128 - 0.65 Fib) here on that retracement and also the most amount of volume (VPVR) being traded there.
A final test of the demand below 90k, which if shown as support, will lead us back into the range of 90k to 110k.
