BTC Textbook Elliot Waves!CRYPTOCAP:BTC local analysis hasn't changed in a few weeks.
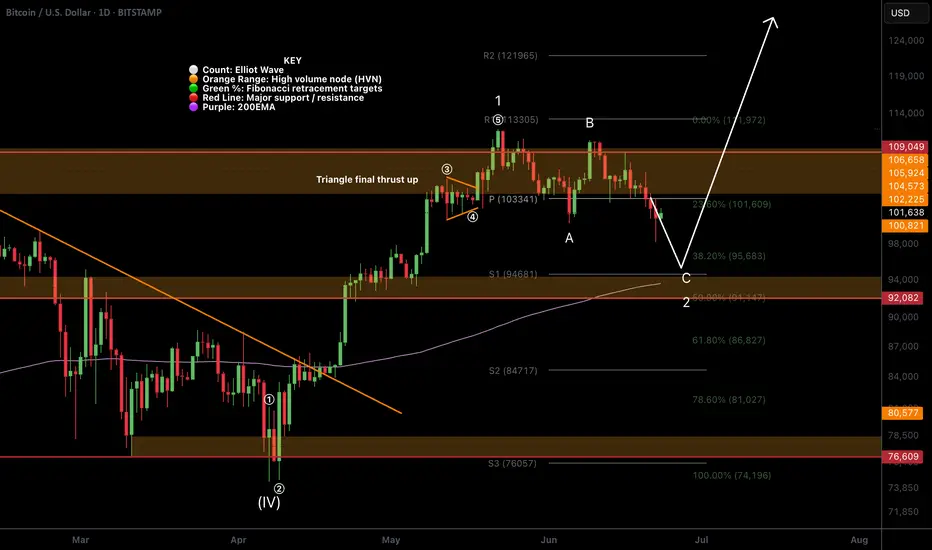
Price printed another text book Elliot motif wave, with the wave 4 triangle terminal pattern ending in the usual thrust up with a poke above all time high.
Price is also printing a textbook ABC for wave 2 with 5 waves down for A, 3 waves up for B and a strong wave C down to finish. Wave C's are always the strongest.
Pattern suggests price has one more push lower to complete this corrective wave tapping the quadruple support: S1 daily pivot, ascending daily 200EMA, major support High Volume Node (HVN) and 0.5 Fibonacci retracement at 92-94k range.
Most investors are publicly calling for buys in this area so price may be front run by the whales! The consensus often do not get what they want.
Safe trading
Bitcoin-btcusd
BITCOIN Is this just a giant Bull Flag??Bitcoin (BTCUSD) saw a strong sell-off yesterday in the aftermath of the U.S. strike in Iran and fears of retaliation, but in later hours recovered some of the lost ground. The recovery is being extended into the Asian and early E.U. hours today and the emerging Channel Down pattern already draws strong similarities with the one in December 17 2024 - January 13 2025.
Both broke below their respective 1D MA50 (blue trend-lines) to form a Lower Low, which in the case of Jan 2025, it initiated a rebound that tested the All Time High (ATH) Resistance. See also how similar their 1D RSI patterns are, testing the same Support level too (41.20).
Given that this time the uptrend has been much shorter since the April 07 2025 Low, this Channel Down may be nothing but a giant Bull Flag in the middle of a standard Bull Cycle Leg. Until confirmed with a 1W candle closing above the ATH Resistance though, the medium-term Target is $111900.
Notice also the formation today of a 1D MA100/200 Bullish Cross, the first since November 13 2024.
So what do you think? Is $111900 your short-term Target? Feel free to let us know in the comments section below!
-------------------------------------------------------------------------------
** Please LIKE 👍, FOLLOW ✅, SHARE 🙌 and COMMENT ✍ if you enjoy this idea! Also share your ideas and charts in the comments section below! This is best way to keep it relevant, support us, keep the content here free and allow the idea to reach as many people as possible. **
-------------------------------------------------------------------------------
💸💸💸💸💸💸
👇 👇 👇 👇 👇 👇

Bitcoin H4 | Pullback resistance at 61.8% Fibonacci retracementBitcoin (BTC/USD) is rising towards a pullback resistance and could potentially reverse off this level to drop lower.
Sell entry is at 103,844.00 which is a pullback resistance that aligns with the 61.8% Fibonacci retracement.
Stop loss is at 107,000.00 which is a level that sits above the 78.6% Fibonacci retracement and a pullback resistance.
Take profit is at 99,546.32 which is a swing-low support.
High Risk Investment Warning
Trading Forex/CFDs on margin carries a high level of risk and may not be suitable for all investors. Leverage can work against you.
Stratos Markets Limited (tradu.com ):
CFDs are complex instruments and come with a high risk of losing money rapidly due to leverage. 63% of retail investor accounts lose money when trading CFDs with this provider. You should consider whether you understand how CFDs work and whether you can afford to take the high risk of losing your money.
Stratos Europe Ltd (tradu.com ):
CFDs are complex instruments and come with a high risk of losing money rapidly due to leverage. 63% of retail investor accounts lose money when trading CFDs with this provider. You should consider whether you understand how CFDs work and whether you can afford to take the high risk of losing your money.
Stratos Global LLC (tradu.com ):
Losses can exceed deposits.
Please be advised that the information presented on TradingView is provided to Tradu (‘Company’, ‘we’) by a third-party provider (‘TFA Global Pte Ltd’). Please be reminded that you are solely responsible for the trading decisions on your account. There is a very high degree of risk involved in trading. Any information and/or content is intended entirely for research, educational and informational purposes only and does not constitute investment or consultation advice or investment strategy. The information is not tailored to the investment needs of any specific person and therefore does not involve a consideration of any of the investment objectives, financial situation or needs of any viewer that may receive it. Kindly also note that past performance is not a reliable indicator of future results. Actual results may differ materially from those anticipated in forward-looking or past performance statements. We assume no liability as to the accuracy or completeness of any of the information and/or content provided herein and the Company cannot be held responsible for any omission, mistake nor for any loss or damage including without limitation to any loss of profit which may arise from reliance on any information supplied by TFA Global Pte Ltd.
The speaker(s) is neither an employee, agent nor representative of Tradu and is therefore acting independently. The opinions given are their own, constitute general market commentary, and do not constitute the opinion or advice of Tradu or any form of personal or investment advice. Tradu neither endorses nor guarantees offerings of third-party speakers, nor is Tradu responsible for the content, veracity or opinions of third-party speakers, presenters or participants.

Bitcoin Break: Watch 100K Revesal Or Test Of 95K.Bitcoin broke 100K support without any type of retrace attempt (YET). This move which is attributed to global events should not be entirely surprising. Most importantly do not OVERREACT, especially with all the nonsense hype this will generate. Here is a more effective way to process the current situation.
Avoid bias and pay attention to the bigger picture. In terms of wave count, Bitcoin can technically retest the 85K area and STILL be considered within a broader Wave 4. This implies the broader structure is still BULLISH (Wave 1 overlap). A swing trade or investing buying opportunity can develop in the 95K area or lower (see illustration).
The short term momentum is bearish as per break of 100K. This should guide shorter time frame strategies like day trades. A new bearish trend line is in play (see arrow). At this point without any meaningful reversal pattern in play (4H or above) look for bearish continuation patterns like consolidations (triangles) inside bars, etc. The 95K support would be a price objective to consider if you are open to aggressive short strategies. Keep in mind, shorting into such a low is HIGHLY risky and best suited for those who have adequate experience.
This situation proves once again, "expert" opinions mean nothing. A few short weeks ago, Bitcoin was poised to break out and everyone was going to be rich again (remember the Bitcoin conference?). So much for that. The market does NOT care what you, me or Michael Saylor thinks. It reflects the perception of the future, whether or not that future plays out.
This is precisely why CHARTS can offer value in terms of measuring potential and RISK. You don't even need to be that technical, just take a look at the weekly time frame. The previous week's bearish pin bar low was broken signaling weakness, NOT Bitcoin 100 million K.
Thank you for considering my analysis and perspective.

Perspective -- all basic indicators point DOWNI feel it's easy to get lost in what is happening NOW and forget what has happened OVERALL.
Zooming out to a weekly chart and using basic trading indicators, we can see where this is going.
Trading Volume: Low
Double Top: Confirmed
Elliot Pattern: Concluded
SMA50 & SMA100: Same setup as Dec 2021
Stochastic RSI: Turning bearish
First target: 92 - 93k range
Second target: 77 - 78k range
Third target: 33 - 34k range
I suspect a slight uptick at 93k, but not surprised if it breezes past this onto 78k.
Strange that anyone views this as a bulllish movement. This is a clear signal of a bearish market, and if altcoins follow then it'll be a full on crypto winter.

BITCOIN Free Signal! Buy!
Hello,Traders!
BITCOIN is retesting a
Horizontal support level
Around 101,288$ from
Where we will be expecting
A local rebound so we can
Go long with the Take Profit
Of 104,324$ and the Stop
Loss of 100,300$
Buy!
Comment and subscribe to help us grow!
Check out other forecasts below too!
Disclosure: I am part of Trade Nation's Influencer program and receive a monthly fee for using their TradingView charts in my analysis.

Symmetrical Triangle: Volatility Squeeze Before Breakout?Bitcoin (BTCUSD) is currently trading within a well-defined symmetrical triangle pattern on the daily chart. This formation is characterized by converging trendlines—higher lows and lower highs—indicating a period of consolidation and decreasing volatility.
Price action is tightening, suggesting a potential breakout is imminent. Symmetrical triangles can break either way, but in this case, the pattern follows a strong prior uptrend, hinting at a possible bullish continuation. Still, traders should watch closely for a confirmed breakout with volume.
⚠️ Key levels to watch:
Upper resistance: ~$111,000
Lower support: ~$96,000
A decisive break above or below these boundaries could set the tone for BTC’s next major move.

Bitcoin Crash Predicted! Here are the next targets! Bitcoin is crashing as predicted, and here I am showing you the next targets, and the changes in market structure that would make me take profits earlier!
Enjoy and feel free to smash the rocket button if you feel the bearish vibe!

BITCOIN - Price can continue grow inside flat to $109000 levelHi guys, this is my overview for BTCUSD, feel free to check it and write your feedback in comments👊
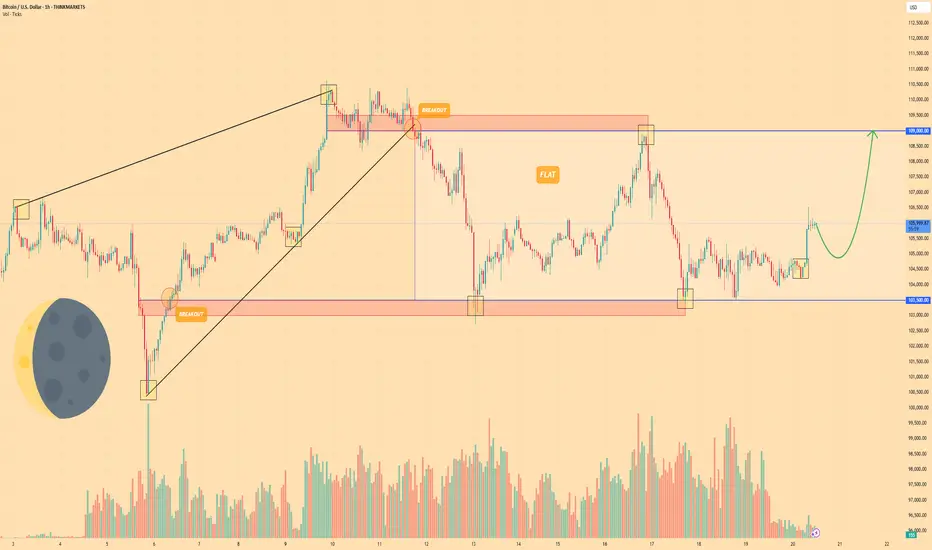
A few days ago, the price entered a wedge, declining below the $103500 level and then making a strong impulse up.
Next, price broke $103500 level one more time and rose to resistance line of wedge, after which started to decline.
BTC broke $109000 level and started to trades inside a flat, where it declined to support level and then bounced up.
Price rose to resistance level, which is top part of flat, and then at once dropped back and started trading close.
But some time later, price bounced from this level and started to grow, and even now it continues to grow.
So, I think that BTC can make a small correction movement and then continue to grow to $109000 level.
If this post is useful to you, you can support me with like/boost and advice in comments❤️
Disclaimer: As part of ThinkMarkets’ Influencer Program, I am sponsored to share and publish their charts in my analysis.
BITCOIN (BTCUSD): Strong Bullish Confirmation?!
Bitcoin has a high chance to rise more, following
a strong bullish reaction to a rising trend line on a 4H.
Goal - 108000
❤️Please, support my work with like, thank you!❤️

BITCOIN This is the long-term picture. Don't get distracted.Bitcoin (BTCUSD) has been consolidating lately after making a new All Time High (ATH) last month and this is already making part of the market nervous over whether that's the Cycle Top or not.
This is one of those times when it would be best to ignore the short-term noise/ volatility and stick to the long-term picture. And that's exactly what's shown on this chart, with BTC on the 1M time-frame showing the incredible symmetry among its 4-year Cycles, with Bear Markets lasting 12 - 13 months and Bull Markets 35.
Based on that, this Cycle's Top is expected to be priced by October (2025). This also matches the Sine Waves as implied by the 1M RSI, which as been trading within a Channel Down (diminishing returns) since Bitcoin's inception.
So do you also think that we have around 4 months before the market tops? Feel free to let us know in the comments section below!
-------------------------------------------------------------------------------
** Please LIKE 👍, FOLLOW ✅, SHARE 🙌 and COMMENT ✍ if you enjoy this idea! Also share your ideas and charts in the comments section below! This is best way to keep it relevant, support us, keep the content here free and allow the idea to reach as many people as possible. **
-------------------------------------------------------------------------------
💸💸💸💸💸💸
👇 👇 👇 👇 👇 👇

Will Bitcoin Try New All Time High?Bitcoin's Volume Profile Support at 103,900 is holding.
Hold here (again) and likely another test for new ATH.
Breaking it means retrace down to the 94k-93k 50% Retracement + Volume Profile region.
Then, time comes into play with the tried and tested Bitcoin Daily Ichimoku Cloud Strategy. If Chikou (used as momentum) does not clear the cloud at the same time as price the bull trend is neutral but still intact.
If the move happens quickly the Support region is likely to hold and retest the highs once more in weeks to come...
2 situations reverse the trend to bearish:
1. Price moves quickly to sub-90k
2. Price moves more slowly to the 50%-VP region.
Both situations get Chikou out at the same time as price. Timing and price come together to flip the trend to bearish.
Trade Wisely

Bitcoin Update: Key Levels, Geopolitics & Cautious Trading Ahead
📈💥 Bitcoin Update: Key Levels, Geopolitics & Cautious Trading Ahead 💭🌍
Hey Traders,
Many of you asked for a fresh Bitcoin update — so here we go. 🚀
Last time, we caught that breakout, but it turned out to be a fakeout. Since then, the situation has become more complex. Geopolitical tensions between Iran and Israel, combined with uncertainty in the Middle East, are weighing heavily on sentiment. 🕊️💣
On the macro side, the Federal Reserve is expected to keep rates unchanged for now — no cuts yet. Building permits data has disappointed again, but inflation is cooling slightly. For now, the big market mover is clearly geopolitics.
👉 Key Levels to Watch:
✅ Support:
$102,400 – $102,700 — If Bitcoin dips here, watch for a bounce.
✅ Resistance:
$106,000 — Major resistance.
Next Resistance: $108,350
Ultimate target: $113,000–$115,000, IF momentum returns.
So how am I approaching it?
📌 Long above $106K → first stop $108K → target $113K–$115K.
📌 Short below $106K → watch support zones carefully.
📌 If we lose $102K, next big supports are $97,700, $89,000 — and even $79,000 if things worsen.
🚫 Big Picture:
We’re still stuck in a broad sideways range — roughly $100,000–$110,000 — until a clear breakout or breakdown occurs. Without a Fed pivot or de-escalation in the Middle East, momentum may stay muted.
🙏 My Advice:
Be cautious. Size your positions wisely. Respect levels. And above all, stay safe — mentally and emotionally — in these uncertain times.
I’ll keep you updated step-by-step. Trade smart, stay kind.
One Love,
The FXPROFESSOR 💙
Disclosure: I am happy to be part of the Trade Nation's Influencer program and receive a monthly fee for using their TradingView charts in my analysis. Awesome broker, where the trader really comes first! 🌟🤝📈

BTC Macro Analysis☕ 𝙂𝙈. CRYPTOCAP:BTC macro analysis update...
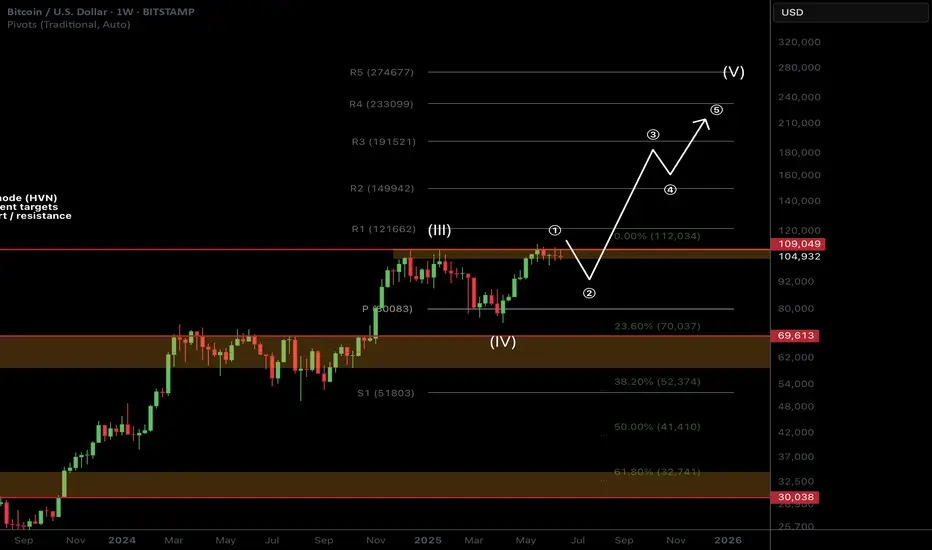
📈 𝙇𝙤𝙣𝙜 𝙩𝙚𝙧𝙢 outlook remains unchanged and recent price action is barely a blip on the weekly chart. SD+2 target is still $211k as a blow off top.
📉 𝙎𝙝𝙤𝙧𝙩 𝙩𝙚𝙧𝙢 outlook has investors looking lower towards the $92K target but this isn't guaranteed to be reached and price action may front those who wait.
War escalation's and retail selling are keeping price suppressed as price changes hands to private companies and large wallets.
The time for patience continues. Money is made in the sitting, weathering volatility, not flipping in and out of trades on every bit of news and price movement
𝙏𝙚𝙘𝙝𝙣𝙞𝙘𝙖𝙡 𝘼𝙣𝙖𝙡𝙮𝙨𝙞𝙨
Price is consolidating under all time high resistance. Consolidation under resistance has high probability of breaking out, the longer it remains the higher the probability.
Elliot Wave (EW) analysis suggests a motif wave ended with the poke above all time high (per the EW rules), with a wave 2 retracement underway. Price remains above the daily pivot (bullish) but below the DEMA (bearish). A triangle could still be forming but this is not my preferred EW count.
Safe trading
Bitcoin Bounced from a High-Volume Area at the 103,363 Support.FenzoFx—Bitcoin dipped to $105,175, creating a bearish fair value gap that highlights selling pressure. Immediate support is at $103,463, backed by high volume, while resistance stands at $107,792. If support holds, BTC/USD could rise toward $112,000.
A drop below $102,185 may accelerate the downtrend toward $93,363, the previous monthly low.

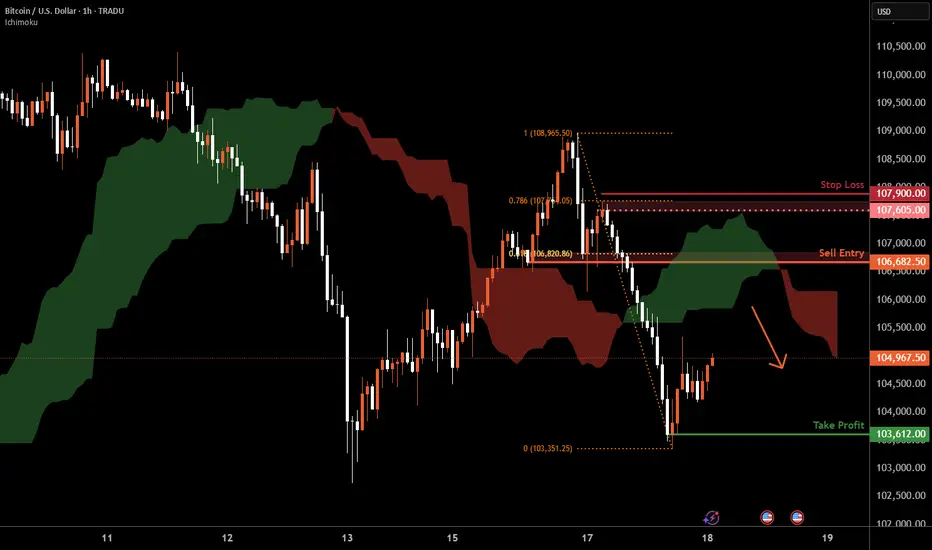
Bitcoin H1 | Pullback resistance at 61.8% Fibonacci retracementBitcoin (BTC/USD) is rising towards a pullback resistance and could potentially reverse off this level to drop lower.
Sell entry is at 106,682.50 which is a pullback resistance that aligns with the 61.8% Fibonacci retracement.
Stop loss is at 107,900.00 which is a level that sits above the 78.6% Fibonacci retracement and a swing-high resistance.
Take profit is at 103,612.00 which is a swing-low support.
High Risk Investment Warning
Trading Forex/CFDs on margin carries a high level of risk and may not be suitable for all investors. Leverage can work against you.
Stratos Markets Limited (tradu.com ):
CFDs are complex instruments and come with a high risk of losing money rapidly due to leverage. 63% of retail investor accounts lose money when trading CFDs with this provider. You should consider whether you understand how CFDs work and whether you can afford to take the high risk of losing your money.
Stratos Europe Ltd (tradu.com ):
CFDs are complex instruments and come with a high risk of losing money rapidly due to leverage. 63% of retail investor accounts lose money when trading CFDs with this provider. You should consider whether you understand how CFDs work and whether you can afford to take the high risk of losing your money.
Stratos Global LLC (tradu.com ):
Losses can exceed deposits.
Please be advised that the information presented on TradingView is provided to Tradu (‘Company’, ‘we’) by a third-party provider (‘TFA Global Pte Ltd’). Please be reminded that you are solely responsible for the trading decisions on your account. There is a very high degree of risk involved in trading. Any information and/or content is intended entirely for research, educational and informational purposes only and does not constitute investment or consultation advice or investment strategy. The information is not tailored to the investment needs of any specific person and therefore does not involve a consideration of any of the investment objectives, financial situation or needs of any viewer that may receive it. Kindly also note that past performance is not a reliable indicator of future results. Actual results may differ materially from those anticipated in forward-looking or past performance statements. We assume no liability as to the accuracy or completeness of any of the information and/or content provided herein and the Company cannot be held responsible for any omission, mistake nor for any loss or damage including without limitation to any loss of profit which may arise from reliance on any information supplied by TFA Global Pte Ltd.
The speaker(s) is neither an employee, agent nor representative of Tradu and is therefore acting independently. The opinions given are their own, constitute general market commentary, and do not constitute the opinion or advice of Tradu or any form of personal or investment advice. Tradu neither endorses nor guarantees offerings of third-party speakers, nor is Tradu responsible for the content, veracity or opinions of third-party speakers, presenters or participants.
BITCOIN Is exactly where it should be this time on every Cycle!Bitcoin (BTCUSD) has made a new All Time High (ATH) last month, following the April 2025 rebound on the 1W MA50 (blue trend-line). No matter how odd this price action may look to some, BTC is simply replicating the pattern it has during every past Cycle around this time of its final year.
As you can see, besides April 2025, it made 1W MA50 pull-backs and rebounds on June 2021, July 2017 and July 2013. The consistency is remarkable and since we are already now half-way through June, historically Bitcoin only went upwards!
In fact, those pull-backs have been the strongest the market saw before the Cycles peaked on each and every occasion. Two Cycles peaked just above the 2.0 Fibonacci extension while in 2017 it peaked a little below the 5. Fib ext. This indicates that the minimum Cycle Top we can be expecting towards the end of the year is $160000 (marginally below the 2.0 Fib ext).
Many studies point towards the same Target. Do you think it's inevitable? Feel free to let us know in the comments section below!
-------------------------------------------------------------------------------
** Please LIKE 👍, FOLLOW ✅, SHARE 🙌 and COMMENT ✍ if you enjoy this idea! Also share your ideas and charts in the comments section below! This is best way to keep it relevant, support us, keep the content here free and allow the idea to reach as many people as possible. **
-------------------------------------------------------------------------------
💸💸💸💸💸💸
👇 👇 👇 👇 👇 👇

BTC at Resistance — Breakdown or Breakout?Bitcoin is trading near $106,600 and still moving cleanly within a well-defined descending channel on the daily chart. Every time price touches the upper boundary, sellers step in aggressively — and this time looks no different. BTC is once again approaching that key resistance zone.
From where I stand, if we don’t see a breakout in the next few sessions, this could be a solid short setup. The structure is clear: fading strength at resistance, targeting the lower channel edge. In this environment, “short the structure — take profit at support” remains a tactical play.
What’s your move? Are you betting on rejection or ready for a breakout?

BITCOIN Cup and Handle making double bounce on the 1D MA50.Bitcoin (BTCUSD) is about to complete a Cup and Handle (C&H) formation, having consolidated for almost a month since the May 22 All Time High (ATH). What makes the bullish potential even stronger is that it is rising after making a Double Bottom on the 1D MA50 (blue trend-line) for the first time since October 10 2024.
Given that the long-term pattern is a Channel Up and the 1D MA50 is acting as its natural support trend-line, the Cup and Handle can provide a short-term Target on its 2.0 Fibonacci extension at $122000. On the long-term the Channel Up still has the potential to lead it much higher.
So do you think that 122k is achievable after this Cup and Handle making double bounce on the 1D MA50? Feel free to let us know in the comments section below!
-------------------------------------------------------------------------------
** Please LIKE 👍, FOLLOW ✅, SHARE 🙌 and COMMENT ✍ if you enjoy this idea! Also share your ideas and charts in the comments section below! This is best way to keep it relevant, support us, keep the content here free and allow the idea to reach as many people as possible. **
-------------------------------------------------------------------------------
💸💸💸💸💸💸
👇 👇 👇 👇 👇 👇

Bitcoin Consolidation: Easy, Walk Away.Bitcoin consolidation in progress. The easiest thing to do in these situations is avoid taking any trades until a new trend is established. Even smaller time frames will be harder to trade unless you are employing mean reversion strategies. At some point the market will choose which way it wants to go but trying to guess in advance is a coin flip. The broader trend is bullish but the 110K and 113K area is a tough resistance. If price struggles to break this area over the next few weeks, then a broader retrace may be more likely.
In this situation it pays to wait for specific levels to take any action at all. What type of action you take will depend on your risk tolerance and time frame. In my opinion, the higher probability scenarios will be a test of the 102K area supports, followed by reversal patterns. Even if they don't follow through to new highs, at least there will be some attempt to maintain the support since Bitcoin is still generally strong.
IF Bitcoin breaks the support (anything is possible) that will confirm the broader corrective scenario which can see price testing 95K at minimum. There is no way to know the certainty of this scenario, it is all about how price action unfolds and confirms.
This time of year is typical of lower volume, lower momentum and less follow through. Often it is better to just sit it out and wait until the season shows clear signs of improvement. Seasonal volume does not typically get back to consistently high momentum levels until November. This does not mean there will be no opportunities at all, it just means if there is going to be a time to purposely be more selective, the next couple of months would be that time.
Thank you for considering my analysis and perspective.

BTC - FRACTAL!!!!I found a fractal, the price should rise to the range of 110888, and then there will be a sharp decline, a squeeze will form, with the price supposedly rising and crossing over, but in reality, the price will be pushed down sharply to a range below $90k. I have an idea related to this, I called it the dragon's wings pattern. At one point, I simply realized that the chart repeats what has already happened, and this is exactly what needs to be analyzed. I think the price will go exactly as I have drawn it. All the best and stay disciplined!

Bitcoin to $100k Soon. The End of Bitcoin Bear Markets? In this chart we explore the batshit idea that we'll never have another bitcoin bear cycle ever again due to macro conditions and supply shock from no one needing to sell.
Not investment advice obviously.

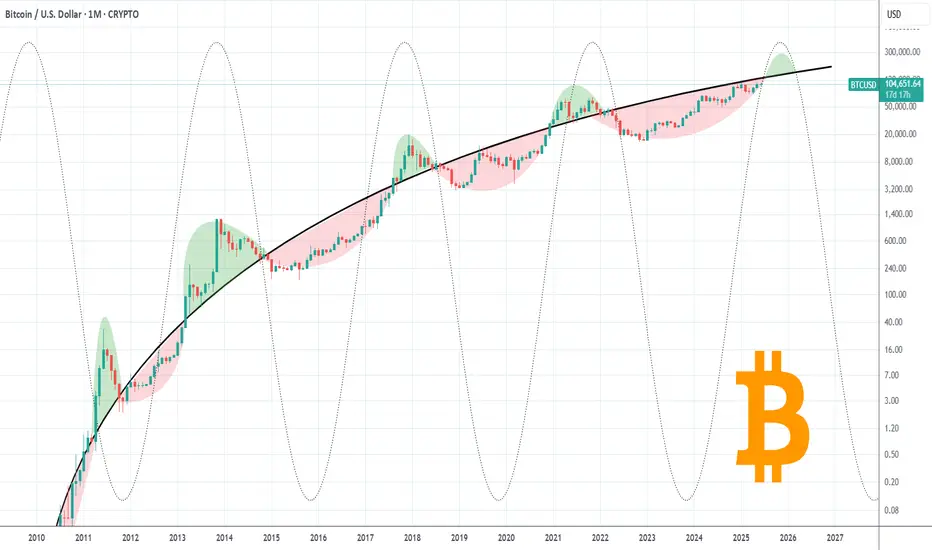
BITCOIN is only now starting the final Cycle rally!Bitcoin (BTCUSD) took a hit overnight following the Israel attack on Iran and at the moment the consequences of that action can't be quantified in great detail but on the long-term the bullish trend seems intact.
In fact it remains below the historic Pivot Growth Curve (PGC) that has separated BTC's peak pattern (green Arcs) from bottom and accumulation (red Arcs), and could be tested by next month.
Once broken, the real rally towards the Cycle's peak can start, with most previous studies we conducted showing that $150000 is a fair (if not modest) estimate.
Are you worried about the latest geopolitical conflict or this chart is enough to give you long-term assurances? Feel free to let us know in the comments section below!
-------------------------------------------------------------------------------
** Please LIKE 👍, FOLLOW ✅, SHARE 🙌 and COMMENT ✍ if you enjoy this idea! Also share your ideas and charts in the comments section below! This is best way to keep it relevant, support us, keep the content here free and allow the idea to reach as many people as possible. **
-------------------------------------------------------------------------------
💸💸💸💸💸💸
👇 👇 👇 👇 👇 👇