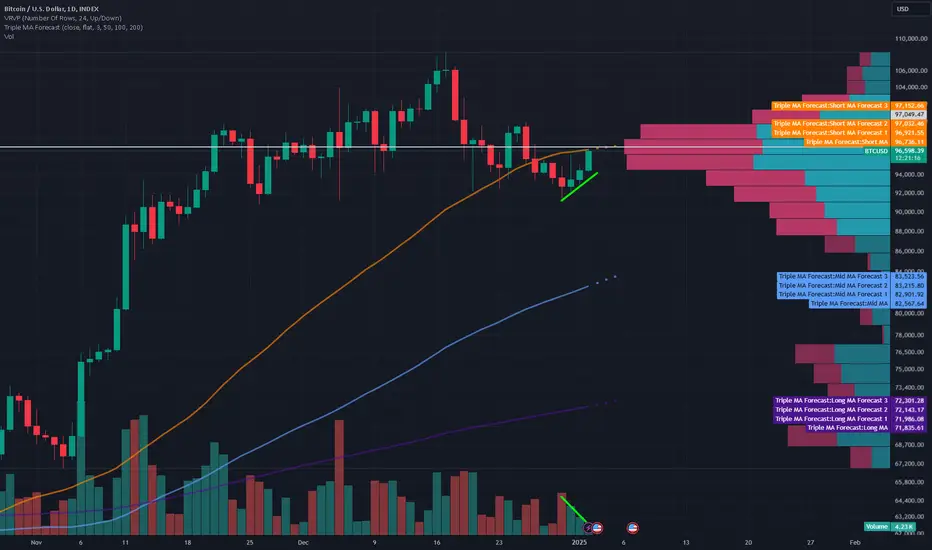
Short term Bitcoin warning: multiple bearish signalsShort term #bitcoin CRYPTOCAP:BTC BITSTAMP:BTCUSD warning:
- price is retesting the 50-day moving average, which is now resistance since we broke it to the downside
- price is bumping into the average volume levels of this top
- there is no volume behind this push (there is a price/volume divergence)
- we formed a bearish head-and-shoulders pattern
- we didnt liquidate enough leveraged LONGs
Bitcoin cán ignore all this and just PUMP through but just keep it in mind. Happy trading! 🥸
Bitcoin-btcusd
The quickening of #BTC RSI & price extremes!I don't make the rules.
:)
We are just surfing the waves of emotions,
of the crowds.
Here we have Monthly line chart with the RSI
It clearly shows a quickening of the trend and how the 4 year cycle is likely to fail this time around.
It is too well know as a theory and will be front ran.
(in my opinion)
We should get a RSI peak at this rate, around May (could be June ofc)
and second lower peak around November (or DEC )
As always good luck in your speculations
#Crypto's are highly speculative instruments as we all know
During these tops you will be told many stories
you must have the wherewith-all to ignore the noise.

The Bitcoin Matrix: Fibonacci’s $250k BlueprintI am tracing Bitcoin's trajectory to $250k using a unique technical lens - Fib circles on a logarithmic chart paired with extension spikes. These circles, six in number, have been instrumental in identifying key price action stages since Bitcoin's first halving.
We group these stages into three 'duo-phases'
( I, II, III )
( With two for each )
Each Macro Pair representing an integral era of Bitcoin's technical evolution in Logarithmic mode through s/r.
I've also linked my other future proof Bitcoin analysis ideas below.

Bitcoin is now on a major support#bitcoin #btc price is sitting on daily ichimoku cloud and this' a critical important support zone. Holding this zone with strong bounces will be very optimistic for #btcusd , losing this zone will be paying dearly.

Bitcoin (BTC/USDT) - End of 2024 - Daily Price ConsolidationBitcoin (BTC/USDT) price is currently in a short-term downtrend and consolidation pattern (end of December 2024).
Bitcoin price needs to hold above $92,000 to $90,000 to avoid a daily bearish head-and-shoulders resistance price pattern.
Support Levels to the downside currently are: $92000, $90000, $87610, $85000, $81000, $76000.
Resistance levels to the upside currently are: $96500, $100000, $105000, $108000, $110000, $120000.
Daily and Weekly price consolidation is ongoing, and Bitcoin is seeking to establish the next higher-low support price.
Note: breaking news, corporate news, government law changes, stock market correlations, and crypto events can affect and override technical chart patterns.
Date: 12/30/2024 pm

Bitcoin: 90K Break Monthly Sell Signal.Bitcoin has rejected the 99,500K resistance area establishing a LOWER HIGH (see arrow). This is a BEARISH sign that increases the chances of a 90K support break. At the same time, price is back inside of a broader support zone (90 to 95K) which may see a brief reversal develop as well. In order to utilize this information which may appear to be conflicting, you must know what time frame you are looking to capitalize on. The key is to be able to adjust when the market confirms one way of the other. Forecasting absolute scenarios is ineffective.
The 90K support area is a key level. A bullish reversal is likely to appear somewhere in this zone which may be good for a brief retest of the mid to higher 90Ks, but I would not expect much more than that. It maybe worth a swing trade (upon confirmation) for 1 or 2K points. If 90K breaks instead, then this scenario is NO longer in play.
The rejection of the 99,500 resistance signifies weakness that should be NO SURPRISE since price is coming off of a broader Wave 5. This move also establishes a BEARISH pin bar on the monthly chart. A break below the low of this candle will also constitute a broader time frame sell signal. This event CAN be the beginning of the next corrective structure that can see price retest the mid 80Ks or even as low as the 70K area (pre election peak) over the next quarter. Hard to believe after all the Michael Saylor thumbnails on Youtube recently. Lesson: Don't buy highs, especially when every Youtube thumbnail has his face on it along with an outrageous price objective. I think the only people fooled by this nowadays are little kids.
The Wave 5 that has completed establishes a larger Wave 3 (the bottom of which is 15K). This means the coming corrective cycle Can persist for the next two years and may be very similar to a recent yearly Wave 4 in Gold which took two years to break out of. Wave 4s are typically consolidations and can be very confusing especially when they test their lows. This will be very important for long term investors to to aware of since it there are likely to be opportune dollar cost average prices (just make sure you understand how to weight and avoid leverage).
Being familiar with wave counts is very helpful when it comes to recognizing important turning points and what to generally expect in the near future. It serves as an effective context to consider when utilizing other more specific pattern oriented strategies. The market provides the evidence, and then we adjust to improve probabilities, every else is a function of the risk we choose to take.
Have a safe and Happy New Year and thank you again for considering my analysis.

Bitcoin's anti-gift for the new year!Technically it looks pretty sad and I think the chart will move through the fibonacci levels. I wouldn't expect any gifts before the end of the year, just another spill and discounts. I think you will hear more words at the New Year tables that altcoins is a scam.
The liquidation levels also confirm my theory, the decline is programmed.
Horban Brothers.

BITCOIN What lies ahead after this correction? The DXY x-factor.Bitcoin (BTCUS) is having in the past 2 weeks the technical correction is should based on the previous Bull Cycle. As you can see, since the U.S. elections it has rallied aggressively past its previous All Time High (ATH), same way it did in December 2020.
** Bitcoin and Doge during 2020 **
At the same time, the alt coin market was mostly consolidating in preparation of a bullish break-out. A representative example of such behavior would be Dogecoin (DOGEUSD) as seen in orange on this chart, which during BTC's December 2020 rally, it was consolidating/ pulling-back (green circle) from an initial rally. However it remained significantly below its previous ATH, the same way it is now.
** The DXY decline sparking crypto rallies **
Notice the U.S. Dollar Index (DXY), displayed by the green trend-line on this chart. Right now it is has been rallying in the past three months, at the same time as Bitcoin has. In the previous Cycle in 2020, it hit a top during the COVID March 2020 market crash and with the smashing of the Interest Rates, it started a Channel Down decline that backed perfectly Bitcoin's rally. We has the exact same DXY-backed rally during Bitcoin's 2017 Bull Cycle.
As a result, we are seeing a paradox on the current Cycle: BTC entering its most aggressive phase (Parabolic Rally) of the Bull Cycle and rallying despite DXY rising. That is attributed of course to a large extent to the huge ETF inflows (something that wasn't present in 2020).
** Overdue DXY decline? **
This leads us to believe that an overdue decline on the DXY, just as the Fed has initiated a new cut Cycle (as they did during the COVID crash), will push Bitcoin and especially the alts market, including Doge, to a new rally. Of course DXY's decline may not be as aggressive this time, as the stimulus shouldn't be that high (especially with Powell's recent remarks on a 2 rate cut expectation in 2025 instead of the previous projection of 4), but it could be enough to spark the final BTC rally of the Bull Cycle and the much anticipated Altseason.
So do you think the market will rally once more on a potential 'delayed' DXY drop? Feel free to let us know in the comments section below!
-------------------------------------------------------------------------------
** Please LIKE 👍, FOLLOW ✅, SHARE 🙌 and COMMENT ✍ if you enjoy this idea! Also share your ideas and charts in the comments section below! This is best way to keep it relevant, support us, keep the content here free and allow the idea to reach as many people as possible. **
-------------------------------------------------------------------------------
💸💸💸💸💸💸
👇 👇 👇 👇 👇 👇

$ETH will follow $BTC When I said a long time ago that #bitcoin would touch the trend line connecting the ATH points, most didn't really take it seriously!
Don't take it as financial advice though and assume I'm joking!
The reality is #Ethereum will tap there and see more!

Bitcoin in raising channelAs bitcoin is moving inside this raising channel , after it broke the middle trendline to the upside now its back testing that. more likely another leg to the upside coming soon..

BTC USD IdeaWe are closely looking level 90,682.58 on the BTC/USD pair. It appears the market is entering a bearish pullback towards the end of the year. On the order book, we see large funds selling positions to secure year-end profits. We consider this market condition a pullback phase if we break through the 90,682.58 fractal low. This is normal and occurs every December in the markets. Overall, we only scalp trade during December and January, without expecting any significant moves. We will keep you posted if volume returns to the markets.

BITCOIN Are you scared enough? Or need to see more pain?Bitcoin (BTCUSD) touched its 1D MA50 (blue trend-line) for the first time in more than 2 months (since October 11) and is rebounding. The first presence of short-term buyers was actually felt on Friday, when the price came close to the MA50 again and rebounded aggressively. This is a natural technical reaction during such aggressive uptrends.
The key Support level during BTC Bull Cycles however is the 1W MA50 (red trend-line), which has been supporting since March 2023 and was successfully tested (and held) twice on August 05 and September 06, the last of which was technically the start of the current Bullish Leg.
** The Fibonacci Channel Up **
Bullish Legs are technically part of Channels and this time is no different as Bitcoin has been trading on a Fibonacci Channel Up since the very bottom of the last Bear Cycle in November 21 2021.
As you can see, we have classified the price action on this pattern in Phases, each of whom trades within one range upwards, which is why the Fibonacci Channel succeeds at accurately displaying BTC's current logarithmic rise during this Cycle.
** The Phases and the high symmetry **
Phase 1 (blue Channel) traded within the Fib 0.0 - 1.0 range, Phase 2 (green Channel) within the Fib 0.5 - 1.5 range and we expect a 3rd one, Phase 3 (red Channel) to trade within the Fib 1.0 - 2.0 range.
As you may assume, there is high symmetry between sequences, Legs and pull-backs within this pattern and the one that stands out is that rallies so far tend to record +100% rises. More specifically, both the April 14 2023 and January 11 2024 Highs of +100% rallies, then pulled back towards the 0.382 Fib retracement level, the first didn't hit it, the second almost did.
** Will we test the 1D MA100? **
But that is the rally that displays the most similarities with the current one and after hitting its 1D MA50, it broke even lower and only found Support and bounced on the 1D MA100 (green trend-line). You can see even how identical their 1D RSI sequences are, which are Channel Down patterns that started showing a bearish divergence much earlier than the top.
Right now the RSI is holding the 45.00 neutral level, but the January 2024 and the 2023 fractals turned into a buy on the key 36.00 level, which is bearish territory. Even though Bull Cycles tend to get more and more aggressive as we approach the end of the Cycle and ignore previous Support levels, the 1D MA100 is currently at $79250 and rising, indicating that it can 'meet' the price on lower levels than currently, assuming how quickly the RSI also hits 36.00 (any of the two conditions hits first, the cyclical buy signal can be valid).
** The remainder of the Bull Cycle **
Beyond that, we expect the next High, as we've already entered Phase 3, to be on the -0.5 horizontal Fibonacci extension (as March 13 2024 was) and on the 2.0 Channel Fibonacci ext at a price of $150000, which is the next technical extension of the Channel. After that, you can see that both Phase 1 and 2 started multi-month Accumulation phases with a potential maximum correction to the 0.382 Fib again and as Phase 3 concludes (and possibly the whole Bull Cycle), we may see another +100% rally and a possible Top at $200000.
So for the current situation the key question is as mentioned on the title: 'Are you scared enough?' now the 1D MA50 has been tested? Because we may very well drop as low as the 1D MA100 before the Fear & Greed Index turns market sentiment to 'Fear' again and makes the majority misjudge the market activity as they always have.
What do you think will happen next? Feel free to let us know in the comments section below!
-------------------------------------------------------------------------------
** Please LIKE 👍, FOLLOW ✅, SHARE 🙌 and COMMENT ✍ if you enjoy this idea! Also share your ideas and charts in the comments section below! This is best way to keep it relevant, support us, keep the content here free and allow the idea to reach as many people as possible. **
-------------------------------------------------------------------------------
💸💸💸💸💸💸
👇 👇 👇 👇 👇 👇

BITCOIN Bearish Breakout! Sell!
Hello,Traders!
BITCOIN has formed a
Bearish flag pattern and
Then made a breakout and
A retest and now we are
Seeing a move down again
So we are locally bearish
Biased and we will be
Expecting a further move down
Sell!
Comment and subscribe to help us grow!
Check out other forecasts below too!

DAY 3 - Daily BTC UpdateBitcoin must hold the key support level of $92,300 to maintain its bullish outlook and validate the Dragonfly Doji pattern on the daily timeframe. There is conflicting data, with momentum indicating increasing selling pressure, reflected in the formation of lower highs on the daily chart, but the STOCH RSI has bottomed.
Bitcoin’s hash rate—the computational power used to mine and process transactions—has risen by 5.48% to 830.78 EH/s, showcasing stronger network security and processing power. Despite this, mining difficulty remains unchanged at 108.52 T, suggesting that while miners are contributing more power, the effort required to mine a block has not yet been adjusted.
The Crypto Greed and Fear Index currently stands at 70, indicating market greed. While this sentiment suggests confidence, it could also signal caution as investors may pull back from further price increases after the recent decline. The total cryptocurrency market cap has dropped by approximately 2.9%, with Bitcoin dominance slightly decreasing to 55.1%, reflecting minor shifts in market dynamics.
In trading, long liquidations have surged, with over $38 million in Bitcoin long positions liquidated within four hours. This sharp move signals a potential bearish turn, driven by traders taking profits or reacting to external pressures. Despite this, declining trading volume suggests fewer sellers in the market, which could hint at stabilisation or a potential reversal.
On-chain data provides a more optimistic perspective. Whale accumulation has increased, and exchange liquidity inventory ratios have declined, signalling that large holders are likely accumulating Bitcoin for longer-term gains or anticipating a price recovery. Moreover, exchange reserves are decreasing, reducing the immediate supply of Bitcoin available for sale. This dynamic supports a potential price rebound if current trends persist.
The past 24 hours have been volatile, with Bitcoin leaning bearish in the short term. However, the underlying on-chain metrics—such as whale activity and reduced exchange reserves—suggest that bullish investors still have hope. A buy-the-dip opportunity may arise if Bitcoin forms a higher low in the coming sessions, potentially paving the way for a recovery.
I am still Buying the Dips :)
PS there were a few more images on the in group update - but not allowed under Trading View Rules - Sorry :(

Bitcoin Mid TermFirst Impression:
The BTC/USD pair appears to have dropped below the $95,000 level and is under selling pressure. Strong support levels are evident in lower regions. The price is retracing toward levels that previously acted as support during bullish moves.
Volume Analysis:
No notable increase in volume is observed on the chart. This could indicate that the current downward move is a low-volume correction or that the market is indecisive. However, if volume increases, the likelihood of the downtrend continuing may rise.
Price Action:
The price is trading around $94,000, showing downward movement. Below, key support levels are visible near $90,700, $88,000, and $85,000. These levels have historically been areas where strong buyers stepped in, making them potential zones for price reactions.
Positive Scenario:
If the price holds at $94,000 and starts a recovery move, it could climb back above $95,000. In this case, $97,500 would be the first target. Sustained movement above this level could push the price back toward the psychological resistance at $100,000.
Negative Scenario:
If the price drops below $94,000, a decline toward $90,700 becomes more likely. A break below this support level could lead to further declines to $88,000 and then $85,000. This scenario would indicate continued selling pressure.
High Probability:
Given current market conditions, it is highly probable that the price consolidates between $90,700 and $94,000 for some time. The balance of buyers and sellers in this zone will determine the direction of the next trend.
Overall:
The BTC/USD pair is trading near a critical support zone. The $94,000 level should be closely monitored; a drop below this level could drive the price toward lower supports. For upward recoveries, $95,000 and $97,500 are the first resistance levels to watch. Strategies should be adjusted based on volume and price action.

Bitcoin: Time To Remove The Party Hats?Bitcoin may be on the verge of compromising the 90K support which I will interpret as a sign that the next broader corrective cycle MAY be beginning (Wave (IV)). IF this is the case, you can remove your Bitcoin 200K party hats for at least a YEAR or two. Gold had a similar outcome a few years back and persisted in a consolidation for two years before it broke out. A corrective cycle does NOT mean Bitcoin is going back to 50K (anything is possible though). It just means a prolonged consolidation may be on the horizon which will provide swing trade and investment opportunities for those who know what to WAIT for.
The arrow on the chart points to the 92K support that is in play at the moment. At as long as 90K is not broken, I anticipate at least one more attempt to test the high. This short term up leg is likely to test the 100K area. IF the higher high (break of 108) does not culminate from the next price advance, then it would be wise to reduce risk, lock in profits and LOWER expectations until bullish short term price structure can rebuild itself.
IF 90K is broken, the next inflection point on this time frame is the 86K area. Great profit objective for those bold enough to short this thing. If 86K is cleared, then its the low 80K area. Again this is one scenario of countless, the key is confirming the price action that supports this possibility, NOT to expect it. This is NOT a forecasting game, it is a interpreting and adjusting game.
With the major holiday week on the horizon, it would be best NOT to expect a LOT of action. Volume typically declines, and movements become very muted or you can get slow grinds that just stubbornly persist to some key level. Either way, it is usually best to avoid such markets, ESPECIALLY if you look at smaller time frames.
As far the the highs at 108K, anyone that bought anywhere above 100K is NOW at the mercy of the market. This is why I always warn my followers about buying into highs. Chances are you won't take your profits when the peak unfolds because you won't know its the peak until WAY after the fact. When I hear about people who have NO idea what Bitcoin is, now interested in "investing" in it, that screams THE PARTY IS OVER, for now. The best times to get in are usually when no one is paying attention, and for Bitcoin and the alt coins, that seems to take about a year or two from the peak. If you can't take the heat, don't play with fire (or Bitcoin).
Thank for you considering y analysis and perspective.

Bitcoin Analysis: December 23, 2024 - Consolidation or Rebound?Hello, this is Greedy All-Day.
Let’s dive into the Bitcoin analysis for today.
Weekly Chart Analysis
Looking at the Bitcoin weekly chart, we can identify two main yellow box zones that represent Bitcoin’s historical trading frames. Currently, in the blue box zone, Bitcoin has moved into a new frame.
Examining the weekly candles, we see that the current red candle is engulfing the previous week’s green candle. As the weekly close approaches in just a few hours, it is highly likely that this bearish engulfing candle signals a consolidation phase within the frame.
If we look at the green box, a similar scenario occurred in the past: after a new high was reached within the previous frame, a bearish candle emerged, followed by approximately 9 months of sideways movement.
While it is unclear how long the current frame will last, the appearance of this week's red candle is not a particularly optimistic signal for future bullish momentum.
The red box, which has provided support since November 2024, becomes critical. A breakdown below this zone could signify a breach of approximately five weeks of sustained support, increasing the likelihood of retesting the weekly 20-MA or even breaking below it.
However, since the red box zone has not yet been decisively breached, it is still possible for Bitcoin to move sideways within the current frame. For those holding long positions, there is no immediate cause for alarm unless the price breaks below 89,400 or fails to hold the support of the weekly 20-MA. If either of these scenarios occurs, it may signal a trend reversal. Keep this in mind as you approach your trades.
Daily Chart Analysis
The key level to watch on the daily chart is 89,400, which coincides with the entry zone for the Ichimoku Cloud.
Since November, Bitcoin has not encountered significant resistance around the daily 20-MA. However, the recent resistance at this level suggests a weakening of bullish momentum.
At this point, it’s crucial to determine whether Bitcoin will:
Receive support and rebound above the key levels, or
Retrace further to 73,800, which was the previous frame’s entry level, and test the short-term ascending trendline.
4-Hour Chart Analysis
To confirm a rebound, Bitcoin must first establish a solid foothold above the 4-hour 20-MA.
Although there was a brief attempt to break above the 20-MA on December 20, 2024, Bitcoin failed to sustain its position, leading to further corrections. This indicates that surpassing the 20-MA remains a priority before addressing resistance levels.
The second critical level to monitor is 99,485, which currently serves as a resistance zone. A breakout above this level would indicate diminishing selling pressure. This would also confirm the current frame's significance as Bitcoin potentially targets the next key resistance near 109,000.
Conclusion
Is the market overheating, or is a rebound on the horizon?
Despite years of observing charts, the emergence of new wealth in this market suggests we are experiencing unique dynamics.
Opportunities always arise during cycles, but entering the market during periods of rapid growth often results in losses rather than gains.
Sometimes, waiting can be the best strategy.
I’ll continue to provide analyses to help guide your trading decisions. Please follow me for more insights!

Logarithmic Prediction of Bitcoin Cycle HighIn this video we use the Tradingview Logarithmic chart and some simple High-to-High and Low-to-Low angle to speculate on where and when Bitcoin INDEX:BTCUSD may hit its Halvening cycle high and low.

If bitcoin will not reclaim 100K, this will matter!#bitcoin #btc price' s dump has been proceeding as i revealed in my previous ideas. (See my prev. posts). Now, 100K is the bearish retest zone for CRYPTOCAP:BTC . if #btcusd declines at or below 100K usd, there' ll be a serious trouble. Not financial advice.

$BTC followed my arrow perfectly.In my last BTC post I shared you can see BTC followed my arrow perfectly. Whats next? I expect us to bounce between 92/88k. If not then look at green box for bounce. Which means alts will bleed more if we do god down there.

BTC/USDT Analysis: Is a Key Reversal Brewing?Bitcoin's price action continues to intrigue traders as it consolidates within an ascending channel on the 4-hour timeframe. The recent rejection from the channel's upper boundary at $108,000 indicates that bearish pressure might dominate the short term. Currently, BTC trades around $101,450, testing a critical support level near $102,000.
Key Observations:
Ascending Channel in Play: The structure highlights an upward trend, with BTC respecting both the upper and lower boundaries of the channel. The dotted midline has acted as a dynamic pivot, influencing price movement over recent weeks.
Bearish Breakdown Potential: A clear break below $102,000 could lead BTC toward the next significant horizontal support at $98,236. This level aligns closely with the channel's lower boundary, making it a crucial zone for bulls to defend.
Key Resistance Zone: If bulls manage to reclaim $103,000, BTC could retest the midline or even the $106,000 level. However, failure to sustain above the $102,000 support could accelerate a bearish trend.
RSI Divergence: Hidden bearish divergence on the RSI suggests weakening bullish momentum, supporting the case for a deeper correction.
Expected Scenarios:
A retest of $98,000 would provide an excellent opportunity for bullish accumulation within the channel structure.
If the price rebounds from the lower boundary, bulls may aim for $106,000-$108,000 in the medium term.
A confirmed breakdown below $98,000 might invalidate the channel, opening doors for further downside to $94,000.

4h Parallel ChannelShort-term:
Bitcoin is in a parallel channel on the 4h chart.
Break above the channel to head towards 120k and continue making new ATHs
Break below the channel to re-test 85-90k.
Long-term:
Bitcoin is likely going to approx 132.5k, as shared here:

BTC 2020-2021 x 2024-2025While #Bitcoin is at the beginning of the bull run, maximum pain is inevitable and it is inevitable to be exposed to parabolic waves in the continuation of this.
