BTCUSD BUYBTCUSD 15 MIN CHART
Hello Traders. If you find this analysis useful, please support me with your likes and comments.
If you have another analysis at this pair, please share in comments, I will be glad to discuss with you.
Bitcoin-btcusd

Bitcoin breakthrough: The journey to conquer a new heightBTC/USDT is in a trend of increasing sharply after breaking down the long -term decrease. Technical factors such as new increase channels, EMA support, and important support areas have strengthened the ability to continue increasing prices. With an appropriate trading strategy, investors can take advantage of the adjustment to participate in the market, with the expectation of higher prices. However, it is necessary to comply with risk management and closely monitor the new market developments to adjust the strategy in time.
Trading strategy suggested
Input score (entry):
Buy when the adjustment price to the first support area (~ 90,000 USDT) or when the signal appears to increase from EMA 34.
Monitor candle signal like Engulfing Bullish or Pin Bar to confirm the purchase force.
Short -term goal: 96,000 USDT.
Medium -term target: 112,000 USDT.

Bitcoin's Bearish Outlook: Targeting the $91,000 Support ZoneBitcoin is approaching the important resistance area ($ 98,000 - $ 99,000) in its increasing channel, but weakness shows the possibility of being rejected. If BTC does not pass this level convincingly, a fake breakthrough may occur, triggering a sharp decline.
The next goals are the $ 92,859, $ 90.754 support area, in accordance with the lower boundaries of the channel and the main bridge area. This area is expected to attract significant buying interest, making it an important level to be monitored.

$BTC Correction to $93K? Or Pump to $101K?Good morning, crypto bro's! 🌅
📊 Fear & Greed Index: 76 (Extreme Greed).
📈 Stoch RSI: Still oversold (19).
💡 Analysis:
Current Action: Bitcoin is currently dropping and has reached the $94K range.
Next Move:
High probability to visit $93K.
Small chance for an instant pump to $101K.
📌 Stay vigilant, avoid FOMO, and always manage your risks.
I'm Akki, one chart at a time. Have a great day and stay SAFU!

BITCOIN Time your sells based on this chart.Bitcoin / BTCUSD closed November with the 1st convincing break out 1month candle over the ATH of the previous Cycle.
According to the previous two Cycles, such breakout candle gives another 4 months at least before the rally peaks and corrects.
The previous Cycles peaked 11 months from the breakout candle and the Cycle before that peaked in 7 months.
This means that it is better to time the selling and exit in March 2025, regardless of what price BTC will be trading at the time.
Technically it should be around $150000.
Follow us, like the idea and leave a comment below!!

BITCOIN $150k doesn't seem so unrealistic now, does it?Almost 4 months ago (August 14, see chart below), we made a bold prediction of a Bitcoin (BTCUSD) target at $150000 by early 2025, while the price was still at $60k:
This was received with a lot of skepticism at the time but with the price now almost on the $100k psychological barrier, the idea looks more and more realistic. It is time to revisit this chart and made some slight modifications based on the price action that was followed.
The price is now off the 0.786 - 1.0 Fibonacci range where it consolidated from March 2024 until October 2024. The enormous rise/ break-out is attributed of course to a large extent on the U.S. elections and the euphoria that followed. We are only 1 month outside this range and the price is already much higher.
Last month's candle is very similar to November 2020 and May 2017. In comparison, that was when the most aggressive (parabolic) rallies of those Bull Cycles started. In 2017 from May to December, it was on a 71.5° angle. On the next Cycle from November 2020 to April 2021, it was on a 68.5° angle, i.e. 3° lower. If that's a progression by any means, then we can assume that the 2024 - 2025 parabolic rally could be on a 65.5° angle (-3° from the previous Cycle). That gives a potential target of $300k as early as May 2025, assuming we could have a Double Top Cycle as in 2021.
In any case, it will be interesting to see if the current Cycle also makes a blow-off top (like the last two) outside/ above the Channel Up that started back on the December 2013 High. Unrealistic as it may seem now, the $150k Target is very plausible technically as it is just below the top of that multi-year Channel Up. If the $300k blow-off top (red Arcs) comes, then all the better, but a long-term investor may consider to start taking profits while the price is inside the Channel Up and starts being cautious once we break above it in the red Arcs.
So what do you think? Do you view $150k as technically realistic as this pattern indicates? And if so, can Bitcoin even make a blow-off top near $300k? Feel free to let us know in the comments section below!
-------------------------------------------------------------------------------
** Please LIKE 👍, FOLLOW ✅, SHARE 🙌 and COMMENT ✍ if you enjoy this idea! Also share your ideas and charts in the comments section below! This is best way to keep it relevant, support us, keep the content here free and allow the idea to reach as many people as possible. **
-------------------------------------------------------------------------------
💸💸💸💸💸💸
👇 👇 👇 👇 👇 👇

Bitcoin- Very risky sell, or wait to buy at 85kLast week, Bitcoin came tantalizingly close to the significant milestone of $100,000 but fell just shy of breaching it. After this near miss, the cryptocurrency experienced a minor correction. Yesterday, Bitcoin tested the $100,000 level once again, only to retreat once more, indicating a persistent struggle to decisively break through this psychological barrier.
Like many traders, I am anticipating a more substantial correction in the near term. One potential strategy could involve selling around the $97,000 level, assuming Bitcoin retraces upward before a deeper pullback.
However, this is undeniably a high-risk trade for two reasons.
First, selling at this level goes against the prevailing bullish trend.
Second, with so many market participants eyeing a correction, there’s a risk that the anticipated move might not play out as expected.
A safer and potentially more rewarding approach could be to wait for a more pronounced correction, targeting a buy around the $85,000 level.
This strategy would align with expectations of a continuation of the broader upward trend, with Bitcoin eventually breaking past $100,000.
If the correction materializes, this level might offer a solid entry point to capitalize on the next leg of the rally.

$BTC: $101K Pump Possible? Or Correction to $93K?Good morning, crypto bro's! 🌅
📊 Fear & Greed Index: 80 (Extreme Greed).
📈 Stoch RSI: Still oversold (25).
💡 Analysis:
Current Action: Bitcoin hasn't corrected to $93K yet.
Short-term Possibility: Small chance for an instant pump to $101K.
Larger Probability: Correction to $93K– GETTEX:92K remains the primary outlook.
📌 As always, stay safe, don’t let FOMO take over, and keep managing your risks.
I'm Akki, one chart at a time. Have a great day and stay SAFU!

Bitcoin: Just Getting Started Again?Bitcoin has retraced to the 90K support (anticipated in my previous article) and is now attempting to retest the 100K high for the second time. Markets are mostly RANDOM, which means there are countless scenarios than can unfold from here. In this article I will focus on just TWO possibilities that I am anticipating for the coming week. The market chooses the outcome and it is our job to use available information to identify the market's intent. For me, that means using price action confirmation to improve probability and quantify my risk for whatever type of trade I am interested in pursuing. The amount of risk you are willing to accept is your responsibility from here.
The first scenario is the Captain Obvious one. Price breaks the high of the yesterday's inside bar and tests the 100K level over the coming week. While this may seem great, IF there is no major catalyst behind this, the chances of a FAILED HIGH are significant. The previous retrace serves as a sign that momentum is slowing in general. IF a failed high (double top) appears and confirms, the next retrace can be substantial to the tune of mid 80Ks. This is not a forecast, it is a potential RISK you must accept from current levels. The other thing to consider is even if 100K is cleared, what potential does it have relative to this risk? With that in mind, if I were to do anything with this scenario it would only be on small time frames, because that is the best way to avoid the large magnitude risk while participating in whatever is left of this move.
The second scenario is the retrace to the high 80's low 90K area for a failed low. This is more in line with the potential consolidation that appears to be developing (sub Wave 4 of 5?). IF Bitcoin offers this opportunity, along with the confirmation, it has a greater potential than the first scenario (inside bar). The arrows on the chart along with the lines illustrate the failed low scenario. This can be pursued on day trade as well as swing trade time frames. The confirmation at the second low is the key to entering this while keeping risk within reason.
A few things to keep in mind about this environment: the catalyst behind this momentum is the U.S. election. Market cap is at all time highs for this sector. Most of the large cap alt coins have reached major resistance levels on weekly and monthly time frames, but nowhere near all time highs. The "experts" are once again all coming out claiming "this is just the beginning". A market testing major resistance levels AFTER sharp break outs is usually NOT "the beginning". In my opinion times like this are ideal for reducing risk or taking profits. I will always suggest this at cycle highs (just like in 2021).
"Great" investing opportunities require long periods of WAITING and watching a market go lower and be completely off the mainstream radar. In this space, cycle lows can take a YEAR or TWO to play out. Alt coins are NOT long term assets, they are just a gamble. When asset bubble money flows, it often makes its way to complete nonsense which can be NFTs. Keep an eye in that area for the risk appetite overflow.
This is NOT a game of getting "rich" as every single video on Youtube is claiming. It is a game of how much RISK you are willing to take. If you have no problem with a healthy retrace giving back 20%+, then by all means do what you have to do. IF you can't handle losing the money, then you are in the wrong game. There are infinitely more people in position to get rich from this entire space BEFORE you. Markets CYCLE from low to high, etc. Just KNOW the RISK associated with the part of the cycle we are in. Hint: When 5 waves can be counted, it usually means there is a greater chance of a coming corrective move. Just ask all the geniuses who bought the highs back in 21.
Thank you for considering my analysis and perspective.

Bitcoin Buy Limit OrdersI'm interested in this two levels, Let's see if the market reacts to them...

Wedge Pattern on Bitcoin's Chart - Investors Take RisksHello,
The optimistic break out of a possible bullish wedge pattern suggests potential price action of reclaiming the $97.3k price level.
The white trendlines mark the borders of a falling wedge pattern, which is usually a bullish pattern. The upward break out from the pattern further indicates a bullish scenario. The bullish chart pattern aligns with technicals like MACD, signaling a weakening bearish momentum. Per the wedge patterns' dimensions, if the price returns to the wedge and hits stop loss levels like $96.5k, the bullish scenario can be considered invalid. Otherwise, a minor pullback is possible to the upper white trendline until BTC picks up bullish momentum and volume. The volume profile shows relatively minimal interest at the current levels. So, I expect BTC to move out from these levels soon. Achieving the target of $97.3k would not only fulfill the bullish potential according to the dimensions of the wedge pattern but also bring the price to levels where investors are interested in trading.
Sentiment:
As of November 2024, the market sentiment for Bitcoin is extremely bullish. This is reflected in the Crypto Fear and Greed Index, which currently sits at 88, indicating extreme greed. This high level of optimism suggests that investors are highly confident in Bitcoin's future and are willing to take on more risk in anticipation of further price increases.
Global economics:
The ongoing strategic competition between the US and China continues to shape the global economic and political landscape, impacting trade, technology, and security. Competitors may recognize the potential to exploit Bitcoin, which will help the price to reach higher levels.
Risk management:
I encourage you to configure your stop loss and diversify your investments to reduce risk.
Regards,
Ely

USDJPY - A Whole Lotta Pips in 2024!USDJPY has been one of our favourites to trade! We've managed to catch the start of the swing points for each wave since the beginning of 2024.
Our entry method remains the same. Break of Trendline. Simple yet very effective if used correctly.
Since our last setup, we've moved +600pips in our direction. We're currently holding it at breakeven and riding out the wave!
See below for our past setups.
Trade 1:
Trade 2:
Trade 3:
Trade 3 (Public Post):
Trade 4 (Public Post):
Trades 3 and 4 have been public setups. Well done to those that were paying attention and caught it!
Goodluck and as always, trade safe!

$BTC Hit $98K! Will Corrections Pull it Back to $92K?Good morning, crypto bro's! 🌅
📊 Fear & Greed Index: 84 (Extreme Greed).
📈 Stoch RSI: Showing signs of exiting oversold.
💡 Analysis:
Current Status: FWB:98K has been reached.
Correction Outlook: Small probability for $93K– GETTEX:92K , with a larger chance for a deeper dip to $85K– GETTEX:82K if support breaks.
Upside Challenge: Breaching $100K seems tough without a significant correction first.
📌 Reminder: Stay sharp and manage risks well. Markets remain dynamic.
I'm Akki, as always, one chart at a time. Have a great day and stay SAFU!

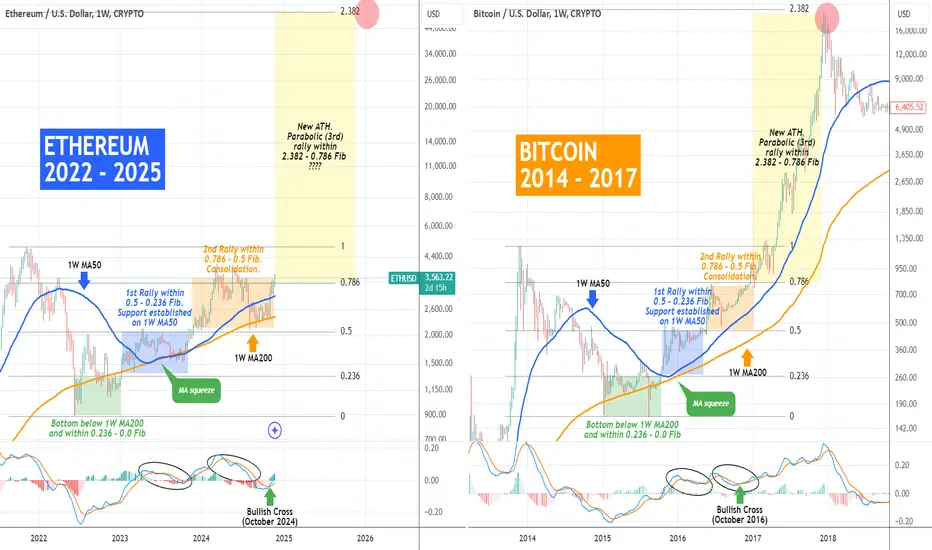
ETHEREUM Is it copying Bitcoin's 2014/17 Cycle towards $50k???Ethereum (ETHUSD) hasn't yet made a new All Time High (ATH), in contrast to Bitcoin (BTCUSD) but that isn't necessarily a negative development as it can highlight its enormous upside potential.
** ETH 2022/25 vs BTC 2014/17 **
A idea that strengthens this notion is today's analysis where you see ETH's current (2022 - 2025) Cycle against BTC's 2014 - 2017. As you can see so far the two Cycle's have been very similar with Ethereum replicating both the Bear Cycle and so far the majority of Bitcoin's past Bull Cycle.
** The Phases **
For more efficient comparison purposes, we have classified the Cycle in phases with the start being the bottom formation (Green Phase) below the 1W MA200 (orange trend-line) and within the 0.236 - 0.0 Fibonacci Zone. That gives way to the 1st rally (Blue Phase) within the 0.5 - 0.236 Fib with the 1W MA50 (blue trend-line) established as the Support. What follows is the 2nd Rally (Orange Phase) within the 0.786 - 0.5 Fib Zone and consolidation.
** October Bullish Cross and $50k?? **
The October 1W MACD Bullish Cross (Oct 2016 for BTC, Oct 2024 for ETH) signals the transition to the final stage (Yellow Phase) of the Bull Cycle, the Parabolic Rally to new ATH. For Bitcoin that peaked near the 2.382 Fibonacci extension. If that seems unrealistic for Ethereum's price today (the 2.382 Fib is just above $50k!!) in terms of market cap (and rightly so) just consider the impact that the ETFs' capital inflows have on the market. It remains to be seen, but nonetheless, ETH has enormous upside from here onwards and we're sure that even a +100% rally from the current price would be welcomed by the majority of the market.
-------------------------------------------------------------------------------
** Please LIKE 👍, FOLLOW ✅, SHARE 🙌 and COMMENT ✍ if you enjoy this idea! Also share your ideas and charts in the comments section below! This is best way to keep it relevant, support us, keep the content here free and allow the idea to reach as many people as possible. **
-------------------------------------------------------------------------------
💸💸💸💸💸💸
👇 👇 👇 👇 👇 👇
BITCOIN TARGETING ALL TIME HIGHS - BTC LONG IDEAI projected and shared the idea that Bitcoin would reach $70,000 and potentially $73,000 within a few days. It happened in just two days! I hope you took the trade and made some profits, as I did.
Now, I’m preparing to position myself with the expectation that we’ll reach all-time highs within a week or two.
We recently broke a massive bearish trendline that has held since March 2024. Just before that, a daily demand zone formed, which helped break the trendline, making it a key area for me. Additionally, the equilibrium level of the bullish leg aligns perfectly with my point of interest.
I expect the price to retrace to the daily demand zone, hit the discount Fibonacci area, test the trendline, and take off from there toward new all-time highs.
Of course, I’ll be looking for lower time-frame confirmations before initiating a long position.

$BTC Eyeing $98K Again? Oversold Signals Fading!Good morning, crypto bro's! 🌅
📊 Fear & Greed Index: 78 (Extreme Greed).
📉 Stoch RSI: Still oversold but showing signs of recovery.
💡 Analysis:
BTC price action remains consistent with yesterday’s outlook.
Short-term probability: Revisit FWB:98K –$99K.
Correction likelihood: May occur after BTC tests $98K.
📌 Reminder: Markets are dynamic. Stay sharp and avoid FOMO.
I'm Akki, as always, one chart at a time. Have a great day and stay SAFU!

BTCUSD - Best Monthly RSI Sell PointGreen circle is optimal sell point at the horizontal
White rectangles show how similar the bull runs we are experiencing (2017 run)
Still some room to move up for BTC.

BTCUSD targeting 108000 on the next leg up.Bitcoin is trading inside a Channel Up, having just rebounded on the MA100 (4h).
In the last 2 months, it accumulates on the same pattern, a Falling Resistance bottoms on an Arc and when it breaks, a rally delivers a new High.
Trading Plan:
1. Buy on the current market price.
Targets:
1. 108000 (dashed trendline).
Tips:
1. The RSI (4h) gives a very clear buy signal when it breaks 35.00. Currently that shows that we've already bottomed.
Please like, follow and comment!!
Notes:
Past trading plan:

Repeating Pattern on 4h Chart?Possible repeating pattern to the leg up from 65 to 98k. Yellow arrow shows where we are in the same setup that is highlighted by the orange rectangle.
If this is true, we'd see something like a drop from here to mid-to-low 80k range before finding enough buyers for the push above 100k.
Long-term long, short-term short.
Reminder that there is a daily CME gap yet unfilled below this area however, around 78 to 80.7k:

BTC Oversold! $98K Revisit or Deeper Drop Incoming?Good morning, crypto bro's! 🌅
📊 Fear & Greed Index: 77 (Extreme Greed, dropping).
📉 Stoch RSI: Entered oversold territory.
💡 Analysis:
On H4 timeframe, BTC shows a strong probability of revisiting the FWB:98K –$99K range.
However, larger timeframes still suggest potential corrections toward the green zone at $85K–$82K.
📌 Stay cautious. The market remains greedy but oversold signals need confirmation.
I'm Akki, as always, one chart at a time. Have a great day and stay SAFU!

BTCUSD: Is 300k a realistic target?Despite the weekly correction, Bitcoin remains bullish on its 1D technical outlook (RSI = 66.961, MACD = 5631.400< ADX = 43.561) and even overbought on the 1W timeframe (RSI = 74.750). That is because the market has started the final parabolic rally, the cycle's most aggressive phase, supported by the 1W MA50. It can stay overbought until the top, the end of the cycle. Based on the 1W CCI, we may be in a 3 week consolidation stage before the rally resumes. According to the previous Cycle, this happened a little over the 0.5 Fibonacci level. Taking a +1,895.45% rise from the bottom, we can see that the exact same position is applied on the current Cycle and stage.
Does this mean that we can see $300,000 as this Cycle's top? Technically yes but it goes against Bitcoin's Theory of Diminishing Returns. Of course, this Cycle is different as we are already over the previous Cycle's ATH, while in November 2020 we were exactly on it. This is due to the launch of the Bitcoin ETF, which has accelerated its growth, so maybe the capital inflows will extend this Cycle beyond what should have been based on the diminishing returns.
## If you like our free content follow our profile to get more daily ideas. ##
## Comments and likes are greatly appreciated. ##

BITCOIN SELL OFF TO $86,000!Looking to short BTC as price action is offering a shift in market structure. Targeting below current Wave 4 for a healthy retracement. HIGH RISK TRADE.
⭕️Wave 3-5 Impulse Move Complete (Major Wave 3).
⭕️Waiting On 3 Sub-Waves (A,B,C) Correction (Major Wave 4).
⭕️Overbought Market Conditions.
