Bitcoin Approaches Important Support Zone, Waiting for New BreakBitcoin is currently trading around $69,962 after a slight correction and touching the support zone between $68,102 and $68,976. This price zone has proven to be a strong support zone in the short term. The 4-hour chart shows that the price is in a consolidation and accumulation phase after the previous strong rally, with the 34 EMA and 89 EMA acting as dynamic support levels.
If the price holds the support zone and does not break below, Bitcoin could continue to fluctuate and form a short-term bottom pattern in this area before retesting the resistance level at $70,182. If this level is broken, a further uptrend could emerge with a target towards the $72,718 zone.
However, in a negative scenario, if the price breaks below the current support zone, BTC could face further downward pressure towards lower support levels. Investors need to closely monitor fluctuations and macro news that affect the market.
Bitcoin-btcusd

BTCUSD price analysis: Prospects of intact price increaseBTCUSD is currently trading around 67,957, continuing the recent decline. Despite the pressure on Bitcoin, the long -term prospect is still positive, because it continues to move in the parallel channel.
Looking at the technical indicators, we see that BTC has maintained its position on EMA 34 and EMA 89, signaling the potential for reversing. It is expected that, after checking the lower boundaries of this main canal and the ema, the price increases may continue. This can cause Bitcoin to aim for higher goals, capable of reaching new high levels over 73,000.
What do you think about this view? Do you believe that Bitcoin has enough power to maintain its position in the price increase or is there a stronger risk of decline?

BTC Hits 76K! Next Stop: 80K or Correction?GM crypto bro's! Fear & greed index now at 77 in Extreme Greed, and stoch RSI is shifting from oversold to overbought.
BTC finally reached our previous target of 76K! So, what’s next? Typically, after a solid pump, a correction follows, with potential dips to 73K-70K. If the momentum continues, we could see BTC eyeing the 79K-80K range.
Market’s hot with extreme greed, so stay safe and avoid FOMO—manage risk as always. That’s it for today’s update. I’m Akki, one chart at a time. Have a nice day & stay SAFU!

BTCUSD Can it repeat Nikkei's 80s mania phase?This is of course a highly speculative but fun chart between Bitcoin / BTCUSD and Nikkei.
As you can see Bitcoin has been following Nikkei's post 1950 parabolic curve up to the point that it tested the 1month MA50 and rebounded aggressively to cross above the curve.
That was Nikkei's 80s Mania Phase that inflated the economic Bubble that burst emphatically and caused hyperinflation, not allowing Japan to recover up to this date.
Bitcoin is based on that comparison on a similar pre-breakout situation.
If it does break above the parabolic curve, which will mean a new narrative for Bitcoin with industry wide adoption and commerce use, we should be seeing (again based on this Nikkei comparison) an extension to the 10 Fibonacci level.
Previous chart:
Follow us, like the idea and leave a comment below!!

Bitcoin Breaks or Fakes? Eyeing the $79K Target!🚀💥 Bitcoin Breaks or Fakes? Eyeing the $79K Target! 💡💰
Hey everyone, it's been a while! If you've missed my voice, let's dive right back into it and see what Bitcoin has been cooking up. The BTC price has been flirting with the $66,320 level, hitting it for the sixth time now, as seen on the descending channel. Historically, the third and sixth attempts have shown the highest chances of a breakout, so is this the moment we’ve been waiting for?
If Bitcoin does break out this time, we could be looking at a potential rise to $79,000. While there are some mild resistances around $69K, $70K, and $71K, the major target remains $79K.
The exchange reserve data shows a significant drop, indicating fewer people are moving Bitcoin to exchanges to sell—an encouraging sign that could be pointing toward a potential rally to new highs.
Zooming into the 15-minute chart, we’ve seen two rejections after hitting resistance. However, the third attempt, if successful, could trigger the next leg up. On the downside, we have solid support at $65,322 that has been tested, and buyers seem ready to jump back in below the $60K mark.
I’m bullish on Bitcoin and keeping an eye on this breakout. If it happens today, we could be well on our way to $79,000.
Let me know your thoughts in the comments below! I’ll keep you posted on the latest developments.
One Love,
The FXPROFESSOR 💙

Can you see the happy face? Target 120000!Following monthly chart.
The last candle indicates a big start, whether say a happy face or Reverse H&S.
TP 120K
I'd stop under 55k candle close.

First top at approx. 130kBased on a calculation I pulled out of thin air, comparing current price position on the BTC^2/LTC scale to previous bull runs (attached below), I estimate the next top or the first of next tops to be 130k.

Give me some energy !!!Finally, Bitcoin managed to go above the cup and handle resistance in the weekly timeframe, but it hasn't fully broken it yet. We need to wait for the weekly candle to close above this resistance. If that happens, we can anticipate the biggest rally in Bitcoin's history. That's it!!!
Give me some energy !!
✨We spend hours finding potential opportunities and writing useful ideas, we would be happy if you support us.
Best regards CobraVanguard.💚
_ _ _ _ __ _ _ _ _ _ _ _ _ _ _ _ _ _ _ _ _ _ _ _ _ _ _ _ _ _ _ _
✅Thank you, and for more ideas, hit ❤️Like❤️ and 🌟Follow🌟!
⚠️Things can change...
The markets are always changing and even with all these signals, the market changes tend to be strong and fast!!

Trump is another name for #bitcoin's parabolic movements!🟢#Trump’s influence, especially in 2016, created a huge shift in the political arena, and this increased people’s interest in alternative financial systems like #Bitcoin.
🟢2016 was a time when Bitcoin started to be noticed by the wider public.
🟢Now, with Trump’s return, there will be a similar wave of excitement in CRYPTOCAP:BTC and the crypto markets.
🟢Interest in assets like #BTC will increase, especially when there is a lack of trust in traditional economic systems or a search for alternative solutions.

BTC Poised for a Breakout: Will Bulls or Bears Take Control?hello guys.
let's analyze BTC
Ascending Channel: BTC is trending within an upward channel, with a broken resistance line acting as support, indicating a bullish trend.
Scenarios Outlined:
Scenario 1 (Bullish): BTC could continue its upward movement, aiming for $74,000 and potentially $76,000 if momentum holds. This scenario suggests a strong rally after breaking through resistance levels.
Scenario 2 (Pullback): BTC may pull back to retest the $66,000–$67,000 range, which would be a healthy correction within the trend. This level could provide a solid support base before the next upward move.
Key Support and Resistance Zones:
Support Zone: Around $66,000, where Scenario 2 will likely play out if a correction occurs.
Resistance Zone: Between $74,000 and $76,000, a potential target for a bullish continuation.
In summary, BTC is currently at a decision point. A breakout above the $74,000–$76,000 zone could lead to a sustained rally, while a retest of the $66,000 support could provide a better entry for bulls. Watch closely for price action at these levels!

BTC Surges to 71K! Will 76K Be the Next Target?GM crypto bro's! Fear & greed index remains at 70 (greed zone), with stoch RSI signaling potential relief from oversold conditions.
Our previous outlook pointed to a dip around 64K-63K, but BTC took a turn, correcting only to 66K and now pumping to 71K. On the H4, a small correction around 70K may be on the horizon, with the pump target still set at 76K.
Crypto is dynamic, probability is a probability—stay safe, manage risk, avoid FOMO. That’s it for today’s update. I’m Akki, one chart at a time. Have a nice day & stay SAFU.

Bitcoin is volatile#bitcoin #btc is trying to break the falling channel just before the elections results. CRYPTOCAP:BTC price has tested 4H ichimoku span resistance zone and for now just declined there. Further declinations will weaken the structure. Very volatile few days we' ll see. Avoid high leverage positions and take care for your funds. Just a friendly reminder.


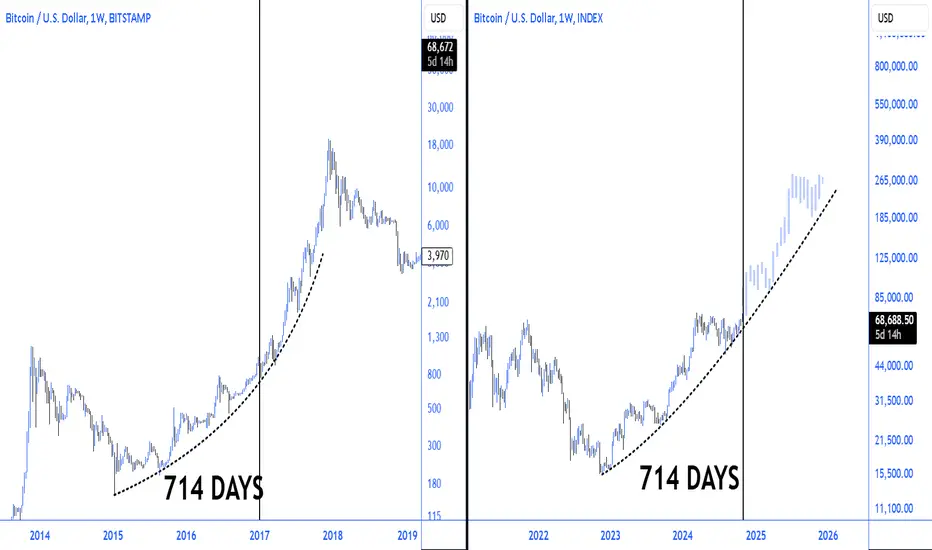
Run it back turbo #Bitcoin CRYPTOCAP:BTC price action in 2024 is in some ways reminiscent of the 2016-2017 rally.
At that time, the price of #btc began to rise after the block reward halving in 2016 and peaked at the end of 2017.
Similarly, market expectations have risen again after the 2024 halving.
There is a similar momentum cyclically; prices tend to move upwards due to supply constraints and increased demand after the halving.
BTC Holding at 66K: Will the Next Move Test 64K?GM crypto bro's! Fear & greed index is at 70 (still greed) and stoch RSI sits in the oversold zone.
BTC has dropped to around 66,841, and today’s market outlook echoes yesterday’s potential correction target in the 64K-63K range.
Stay strong, crypto fam! Always manage risk, avoid FOMO, and as always, that’s today’s crypto update. I’m Akki, one chart at a time. Have a great day & stay SAFU.

Tick.. Tock.. $BTC #Bitcoin, instead of stressing over small corrections that occur in a short period of time, looking at it from a broader perspective often yields healthier results.
Zooming out to see long-term trends can help you see the general trend more clearly by ignoring daily fluctuations in the market.
In this way, you can stay calmer when making investment decisions and avoid panic sales. 🤝

BITCOIN fully supported targeting $170k after the ATH breaks.Exactly 3 months ago (August 05, see chart below) when the price was on the 1W MA50 (blue trend-line), having hit it for the first time since the week of March 12 2003, we claimed that this was the last stand for Bitcoin (BTCUSD) if the market wanted to maintain the Bull Cycle, as based on the previous 3 Cycles, it was the absolute supporting trend-line:
The 1W MA50 eventually held not once but twice and that gave way to a rally that last week tested the 73800 All Time High (ATH). That is incredibly bullish, especially only two days before the U.S. elections, as from the historic patterns we've shown you before, a Parabolic Rally has started after each election.
So according to our August comparison chart, if history is repeated, BTC is looking towards at least the 1.618 Fibonacci extension from the ATH, which is roughly a little over $170k.
But what do you think? Are you expecting the ATH test to start a massive rally similar to all previous Cycles? And if so, is $170000 a realistic Target? Feel free to let us know in the comments section below!
-------------------------------------------------------------------------------
** Please LIKE 👍, FOLLOW ✅, SHARE 🙌 and COMMENT ✍ if you enjoy this idea! Also share your ideas and charts in the comments section below! This is best way to keep it relevant, support us, keep the content here free and allow the idea to reach as many people as possible. **
-------------------------------------------------------------------------------
💸💸💸💸💸💸
👇 👇 👇 👇 👇 👇

Bitcoin: Small Dip to $49k Or Crypto Winter down to $15k?There are two potential options for Bitcoin price.
1) Price will complete ABC correction as we have A-B in place already.
The wave C could retest the valley of wave A at GETTEX:49K
2) Large red second leg down could complete a bigger correction.
It could retest the bottom of leg 1 around $15k.
Only below GETTEX:49K we can see what structure is unfolding.
What are your thoughts why such a huge collapse is possible?
Media says miners start switching to AI investments to drop cryptos.
Please share your thoughts down below

BTC's Next Move After the 67K Test: Deeper Correction Incoming?GM crypto bro's, back to reality! Fear & greed index is at 70 (still greed), while stoch RSI hits oversold.
Our previous target of 67K was visited. So, where does BTC head next? On the H4 timeframe, no clear pump signals yet. On the D1 chart, we’re eyeing our familiar range of 64K - 63K, as greed persists and a deeper correction is possible.
Crypto is tough, as tough as life itself. Stay cautious, avoid FOMO, and always manage risk. I'm Akki, signing off with one chart. Have a great day & stay SAFU.

BITCOIN BULLISH BIAS|LONG|
✅BITCOIN is going down now
But a strong support level is ahead at 66,000$
Thus I am expecting a rebound
And a move up towards the target at 71,000$
LONG🚀
✅Like and subscribe to never miss a new idea!✅

BTC USD UpdateAnother monthly bullish candle has closed, but the bullish bias stopped the trend just before the all-time high in BTC/USD pair High liquidity has been grabbed, and we've seen a massive bearish reaction. I have a runner and a stop-loss below 65,149.51. If we lose this level, we're in bearish mode.
Let's see what market makers are planning to do this week and what the overall end-of-year price action will be. I'll try to share some good setups, but going long just before we missed taking out the high looks a bit risky, so I'm in scalping mode, sitting behind order flow software and trying to catch a high-volume ride somewhere. I'll keep you posted!

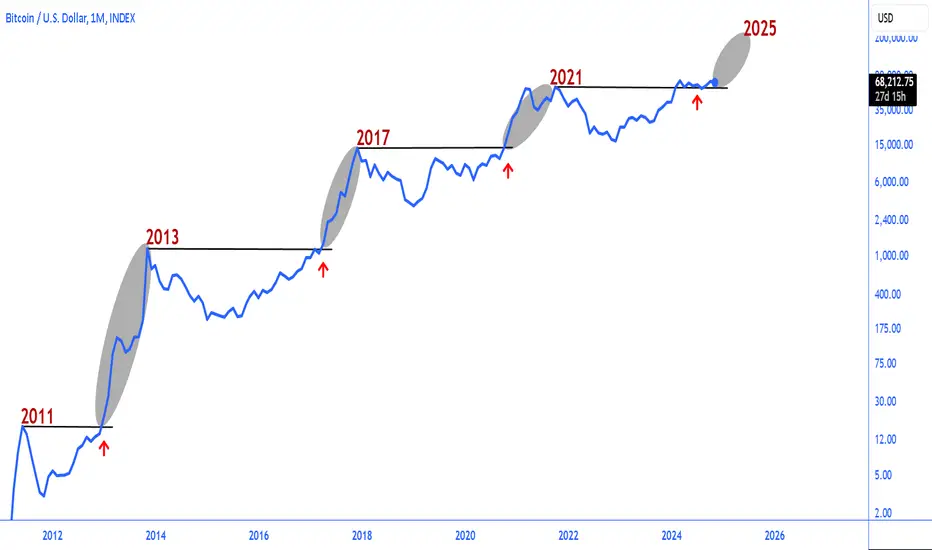
#Bitcoin is going to explode!#Btc We see more accumulation around the 2021 ath level in 2024 compared to the 2011 2013 and 2017 ath levels.
It will lead to a healthier and more stable rise for CRYPTOCAP:BTC , which fills the price levels on a monthly basis and becomes a major support.
BTC's Tug-of-War: 67K Dip or 76K Breakthrough?GM crypto bro's, happy weekend! Fear & greed index is at 74 (greed), with the stoch RSI nearing oversold. BTC still hasn’t closed below 69K, hinting at a possible pump to 76K. However, in this greed-driven state, it might be hard for BTC to rally up.
Current price action suggests a potential drop to 67K is more likely. But probabilities are just that—possibilities. Stay safe, avoid FOMO, and always manage risk. I'm Akki, signing off with one chart. Have a great day & stay SAFU.
