BTCUSD_4H&1Dhello
Bitcoin can enter a new rising wave due to the breaking of the upward trend line and maintaining the support of 67500
Just keeping the important number of 67500 is important for traders
We are buyers by maintaining the high price of this number for a good and excellent profit
Bitcoin-btcusd

Calm before the storm #Bitcoin#Btc completed a successful monthly close and retest above the 2021 ATH of 69k, CRYPTOCAP:BTC also continues the 5th upward wave of elliot wave!

BITCOIN Risky Long! Buy!
Hello,Traders!
BITCOIN is making a retest
Of the falling support line
While trading in an uptrend
So we are bullish biased
And we will be expecting
A further move up
Buy!
Like, comment and subscribe to help us grow!
Check out other forecasts below too!

BTC at a Crossroads: Correction to 63K or Pump to 77K?GM crypto bro's, happy weekend! Today, the fear & greed index stands at 72 (greed), and the stoch RSI is nearing oversold territory.
Today's outlook remains similar to yesterday. If BTC's daily candle closes below 69K, a strong chance exists for a visit to the 64K-63K range. But if it holds, we might see another pump to 76K-77K.
Stay sharp and avoid FOMO. Always manage risk. I'm Akki, signing off with one chart. Have a great day & stay SAFU.

Selling opportunity in Bitcoin?I don't know if the price will go up or down. But I think buying now in areas of multiple resistances is a bit risky.
Any divergence in either the MFI or the RSI indicating buying exhaustion, I believe it is a good time to sell. As happened on July 28th.

BTCUSD Potential Trend ContinuationBTCUSDT has established a triangle pattern on the daily chart, which typically suggests trend continuation. This formation is taking shape just below the key psychological level at 70,000, hinting that the market might be gearing up for a breakout. The last weekly candle—a long-tailed bar—signals potential buying interest, reinforcing a possible upside. As we approach the monthly candle close, a close above September’s high could provide further confirmation of upward momentum.
In the short term, a pullback or a fake breakout of the triangle pattern may occur, potentially leading to a retest of the all-time high. The target is the resistance zone around 72,000

Bitcoin takes off when the Fed levelsToday, BTCUSDT tends to increase with this currency currently fluctuating around $ 69,400.
The market predicts the Federal Reserve may temporarily suspend the interest rate increase cycle, capable of weakening the dollar and promote the attraction of Bitcoin as an alternative asset. In addition, the increasing investment of organizations in Bitcoin has contributed to the positive motivation for the cryptocurrency market.
Technical analysis: BTCUSDT is currently checking the trend of increasing trend at a support level around $ 69,500. If the price is held on this trend and surpasses EMA 34 and EMA 89 (currently $ 70,765 and $ 70,768), the price increase will be strengthened. The next goal may be in the range of $ 72,000 - $ 73,000.

BTCUSDTHello all dear traders!
BTCUSDT is trending up today with the coin currently hovering around $72,300.
Technically, although BTCUSDT is rising, there are clear signs of overbought conditions with immediate resistance at $73,300 and the higher high at $74,000 yet to be broken. This could lead to consolidation or a pullback in the short term.
However, given the overall market structure, Bitcoin could be on the verge of exploding higher in the coming months.

Monthly Octobull Closed, next Eyeing Corrections or insane pump?GM crypto bro's! New month, new profit. October closed with a strong octobull candle. Today, the fear and greed index is at 75 in the greed zone, while Stoch RSI shows rejection from the overbought area.
The correction range of 70K - 69K we mentioned yesterday has been hit. On a monthly view, deeper corrections to our old zone at 64K - 63K, or even 61K, could unfold if BTC drops below 69K. Immediate bullish targets are at 76K - 77K.
Seeing the greed out there—don’t FOMO! Akki signing off, stay alert and SAFU.

BITCOIN GROWTH AHEAD|LONG|
✅BITCOIN fell again to retest the support of 69,000$
But it is a strong key level
So I think that there is a high chance
We will see a bullish rebound and a move up
LONG🚀
✅Like and subscribe to never miss a new idea!✅

BITCOIN Closed 2 straight green 1M candles after 7 months!Bitcoin (BTCUSD) is closing today the monthly (1M) candle and unless it drops by 7000 in a few hours, it will close the month of October in green. That will be the 2nd straight green 1M candle since March!
This 7 month consolidation period is no stranger to BTC as such patterns, where there are no straight green 1M candles, are standard Accumulation Phases that we see during Bull Cycles. So far on the current one we've had three (including March 2024) and once the market closed 2 straight green 1M candles, it rallied.
The 2019 - 2021 Bull Cycle had three such straight green candle occasions and a very clear Accumulation Phase, while the 2015 - 2018 Cycle had numerous. One thing is clear based on this multi-year chart. When the market closes two straight green 1M candles, it is always a good signal to buy.
But what do you think? Do you find this indicator reliable? Are you buying based on this? Feel free to let us know in the comments section below!
-------------------------------------------------------------------------------
** Please LIKE 👍, FOLLOW ✅, SHARE 🙌 and COMMENT ✍ if you enjoy this idea! Also share your ideas and charts in the comments section below! This is best way to keep it relevant, support us, keep the content here free and allow the idea to reach as many people as possible. **
-------------------------------------------------------------------------------
💸💸💸💸💸💸
👇 👇 👇 👇 👇 👇

Extreme Greed Stays High; Correction Potential at 70K - 69K ?GM crypto bro’s! Fear and greed index remains in Extreme Greed at 77, and Stoch RSI has now entered overbought territory.
Today’s outlook is similar to yesterday: BTC may first correct to the 70K - 69K range before possibly pumping to 82K. Many people are feeling greedy—don’t fall into FOMO. Akki signing off—one chart, one love. Stay vigilant, stay SAFU.

Bitcoin Resumes Its Bullish TrendBitcoin with ticker BTCUSD remains in a higher degree bullish trend as expected. After we recently spotted wave IV correction on a daily chart, we can now see it resuming higher for wave V with space up to 100k area that can be achieved by a new lower degree five-wave bullish cycle.
Basic Impulsive Bullish Pattern shows that Bitcoin can be trading in wave 3 of V, so more upside is expected. Later we will just have to be aware of subwave 4 pullback before a continuation higher for wave 5 of V.

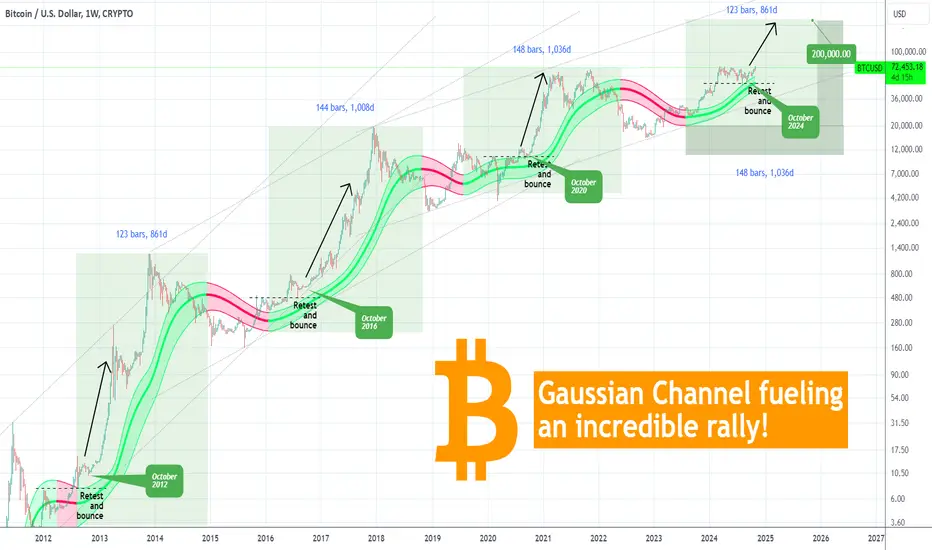
BITCOIN Gaussian Channel telling you the rally has already begunBitcoin (BTCUSD) is illustrated here on the 1W time-frame from the 2011 Cycle until today. We've used the Gaussian Channel (GC) after a long time and the reason is simple. Since the August 05 2024 Low, it has been supporting the uptrend up to today's test of the All Time High (ATH).
** Gaussian October support every 4 years **
This continuous support is a critical feature moving forward as every time the GC held at this stage of the previous Cycles (October 2020, 2016 and 2012), BTC started its final (and most aggressive) Parabolic Rally of the Cycle.
** Resistance turned Support **
What's equally interesting is that during those stages, the price also re-tested and held the former Resistance (of the previous Higher High), turned it into a Support (while the GC held) and bounced to the Parabolic Rally. This is a remarkably consistent feature taking place every 4 years!
** The green GC length matters **
Now as to the GC in more detail. What we want you to keep from it, is that the green part of the GC has lasted in the previous Cycles 123, 144 and 148 weeks respectively, which translates to 861, 1008 and 1036 days, until it turned red. As a result, we can expect the current green phase to last until December 08 2025 (minimum) and June 01 2026 (maximum). It is more reasonable to expect the longer case as the recent Cycles tend to have stabilized most of their common time patterns.
The Bear Cycle tends to start when a 1W candle is closed below the GC. Until then, based on the parallel Channel Up patterns that encompass 3 Cycles each time, we can even expect a price as high as $200000 for this Cycle Top.
Do you think that's realistic? And if so, do you also expect the GC wave to support a parabolic rally all the way to the top? Feel free to let us know in the comments section below!
-------------------------------------------------------------------------------
** Please LIKE 👍, FOLLOW ✅, SHARE 🙌 and COMMENT ✍ if you enjoy this idea! Also share your ideas and charts in the comments section below! This is best way to keep it relevant, support us, keep the content here free and allow the idea to reach as many people as possible. **
-------------------------------------------------------------------------------
💸💸💸💸💸💸
👇 👇 👇 👇 👇 👇
PEPEUSDT consolidation before potential JumpPEPEUSDT has recently established a fake breakout at the previous support level, forming a double bottom pattern. Since the beginning of the month, the pair has been consolidating following an impulse move, which suggests potential accumulation. On the daily timeframe, an inverse head and shoulders pattern is visible, signaling a possible reversal. If the price retests the support level and holds, it may gain the momentum needed to break through the downward channel. The target for this potential bullish move is the resistance zone around 0.0000108

BITCOIN Short From Resistance! Sell!
Hello,Traders!
BITCOIN is retesting a
Horizontal resistance level
Around 74k USD which also
Happens to be an all-time-high
So despite our bullish bias
We will be expecting a
Local bearish correction
Sell!
Like, comment and subscribe to help us grow!
Check out other forecasts below too!

Bitcoin 2024Before the ETF decision, İ told you not to get caught in FOMO.
Now i expect consolidation before halving.
Prices may fluctuate between around 38.000$ - 48.000$ for a certain period of time, but then may decrease to around 32.000$.
Fundamentally, with Fed monetary policy easing, money inflow to the market will increase in 2024 and 2025. My target for 2024 is around 85.000$.
I think crypto technology is not at the prices it deserves.
It will definitely come to the point it deserves in the future.

BTCUSD—Extreme Greed Hits; Potential Correction Before Next PumpGM crypto bro’s! This morning, the fear and greed index has surged to extreme greed at 77, while Stoch RSI edges back towards overbought levels.
BTC has seen a substantial pump over the past few days, reaching a peak of 73,613 yesterday. On the weekly timeframe, the next target may be around 82K. However, given the extreme greed conditions, a correction could likely come first, potentially down to the 69K area, before any further massive pump.
Don’t FOMO—keep risk management top of mind. Akki signing off—one chart, one love. Have a great day and stay SAFU.

BTCUSD: Will it make new All Time High or get rejected?Bitcoin turned overbought on its 1D technical outlook (RSI = 71.973, MACD = 1675.300, ADX = 39.493) as it is on the 4th straight bullish day, approaching the 73,800 All Time High. The rise is being charged by the 1D Golden Cross formation two days ago and with the 1W time-frame still far from being overbought, we can see this bullish trend extending. If it breaks the ATH, we expect a slower ascend to 80,000 but if the price is rejected on the ATH level, we may see a new test of the 1D MA50 (TP = 67,500) so that the market tests the buying strength once more before breaking the ATH.
## If you like our free content follow our profile to get more daily ideas. ##
## Comments and likes are greatly appreciated. ##

BITCOIN RESISTANCE AHEAD|SHORT|
✅BITCOIN broke the falling
Resistance line just as I predicted
And we are bullish biased mid-term
However, the coin is locally overbought
So after it hits the horizontal resistance
Of 74k$ we will be expecting a local
Bearish correction
SHORT🔥
✅Like and subscribe to never miss a new idea!✅

Bitcoin Faces Bearish Pressure Amid Tether InvestigationIf you didn’t purchase BTC before the last rally:
Now Bitcoin's recent performance may be overshadowed by growing concerns surrounding the stability of the cryptocurrency market, particularly in light of the U.S. Department of Justice (DOJ) launching a criminal investigation into Tether, the issuer of the popular stablecoin USDT.
According to reports from the Wall Street Journal, this investigation, spearheaded by the U.S. attorney’s office in Manhattan, is examining potential violations of sanctions and anti-money laundering regulations.
Tether has been a crucial component of the cryptocurrency ecosystem, as its dollar-pegged stablecoin is widely used for trading and liquidity across numerous exchanges. Any negative developments in the investigation could undermine confidence in USDT, leading to broader implications for Bitcoin and other cryptocurrencies that rely on stablecoins for stability and transaction efficiency.
Investors may become increasingly wary, fearing that regulatory actions could restrict Tether's operations or even jeopardize its ability to maintain its peg to the U.S. dollar. A loss of faith in USDT could trigger panic selling, as traders might rush to liquidate their positions in Bitcoin and other assets, leading to increased volatility and downward pressure on prices.
The scrutiny surrounding Tether could prompt regulators to examine other stablecoins and cryptocurrency projects more closely, adding to the uncertainty and potential for further regulatory crackdowns. This environment of increased regulatory oversight could deter new investors from entering the market and may lead existing investors to reassess their positions.

BTCUSD—Achieves 70K; Short-Term Correction ProbableGM crypto bro’s, this morning’s fear and greed index holds steady at 72 in the greed zone, while Stoch RSI rebounds after touching oversold levels.
Last night, BTC hit our anticipated 70K target—a mark discussed in previous updates. While yesterday’s market update hinted at a correction, BTC surprised us with an impressive pump to reach 70K.
Next move for BTC? Given the elevated greed level and recent pump, we might expect a brief correction down to 68K in the near term. Remember, probability is just that—probability. Stay vigilant, avoid FOMO, and manage your risks. Akki signing off—one chart, one love. Have a great day and stay SAFU.

Q4 2024 $BTC Mega BULL start#Bitcoin is at the beginning of the mega bull phase, as in 2012, 2016 and 2020 Q4!
#BTC Parabolic waves is inevitable!
