BITCOIN: Am I the only one looking this way?? $BTCA lot of people expect just a pump from here while we are still in fear area. Looks logical to me that we first need a decent shake-out, so we gain enough liquidity to fuel the real kick-off.
Let me know what you think
Bitcoin-btcusd

BTCUSD Reclaims 62K with Bullish Signs—Potential to Reach 64KGM crypto bro's, this morning the Fear and Greed Index has increased, moving out of the fear zone and into neutral at 49. Meanwhile, the Stoch RSI is signaling potential upward movement.
BTC has reclaimed the 62K area as I mentioned in yesterday's update, and the bullish price action seen this weekend may increase the probability of BTC reaching the 64K range.
The market is dynamic—don’t get FOMO. Always manage your risk, and as always, this is Akki signing off—one chart, one love. Have a nice day and stay SAFU.

Walz vs. Vance: Markets to Watch Democrat Tim Walz and Republican JD Vance are set to clash next week in the sole U.S. vice presidential debate, an opportunity for both candidates to bolster their running mates’ platforms ahead of the crucial November 5 election.
For the exact date and time of major economic events, import the BlackBull Markets Economic Calendar to receive alerts directly in your email inbox.
Will the markets mirror the first debate’s outcome?
Vance faces an uphill battle, with polling data showing he carries higher unfavorable ratings compared to Walz. So, unless Vance exceeds expectations during the debate, the "winner" will likely be the more favored candidate going in.
During the first debate between Trump and Harris, assets linked to the Harris/Walz ticket surged post-debate. Green economy stocks rose 4.1%, renewables climbed 4.0%, and oil gained 2.1%, driven by lower supply expectations. Semiconductors saw a 4.4% uptick. Meanwhile, Trump-trade assets stumbled, with Trump Media & Technology Group plunging 13%, and crypto-related stocks, including Bitcoin, pulling back.

BTCUSD: An insane rally is starting courtesy of the USDT Dom.Bitcoin is rebounding today aggressively on the 1D MA50, being only neutral on its 1D technical outlook (RSI = 52.075, MACD = 23.455, ADX = 23.455), indicating that the upside potential is tremendous. One correlating asset in particular is showing that an insane rally is about to start, and that's the USDT Dominance. It is about to make a bearish reversal which on October 12th 2023, kickstarted the last strong rally of Bitcoin. We expect 100k to be met on this one.
## If you like our free content follow our profile to get more daily ideas. ##
## Comments and likes are greatly appreciated. ##

BITCOIN Cup and Handle on full motion looking for the break-out.Bitcoin's (BTCUSD) full Cycle since the November 2021 High can be illustrated as nothing more than a Cup and Handle (C&H) pattern with the Channel Down since March 2024 being the Handle of the formation.
Simple yet a technical reality, the Handle found support both in early August and September on the 1W MA50 (blue trend-line), keeping the bullish trend valid. In fact, the 1D MA200 (red trend-line) and the 1W MA50 have been the bottom formation zone during its previous 6-month consolidation in August - September 2023.
All Bullish Legs since the November 2022 bottom have been within +90% and +100%. Even if the minimum (+91.68%) of the last rally is followed, we can expect Bitcoin to reach at least $94000 during that run by the end of the year.
But what do you think? Will this Cycle-long Cup and Handle serve its purpose and break-out aggressively? Feel free to let us know in the comments section below!
-------------------------------------------------------------------------------
** Please LIKE 👍, FOLLOW ✅, SHARE 🙌 and COMMENT ✍ if you enjoy this idea! Also share your ideas and charts in the comments section below! This is best way to keep it relevant, support us, keep the content here free and allow the idea to reach as many people as possible. **
-------------------------------------------------------------------------------
💸💸💸💸💸💸
👇 👇 👇 👇 👇 👇

BTCUSD Struggles Amid Fear—Downtrend Continues ?GM crypto bro's, this morning BTC continues its decline, with the Fear and Greed Index now sitting at 41 in the fear zone, and the Stoch RSI still in the oversold area.
Looking at the price action on the H4 timeframe, there’s a small chance BTC could reclaim the 62K area, but the probability of further decline to 59K is higher. With the weekend approaching, we can expect low volume in the market.
The market is dynamic—don’t get FOMO. Always manage your risk, and as always, this is Akki signing off—one chart, one love. Have a nice day and stay SAFU.

ONE MORE LEG DOWN FOR BITCOIN BEFORE TAKE OFF..???I got an interesting view on BITCOIN while all bullish-ers and bullsh17-ers always talk about BUY BUY BUY..
I own Bitcoin and hold some of it, but i just sold a huge portion of my bitcoin and prepare to re-entry around 50k.
I assumed the W-Y-Z correction is not over, and Bitcoin owe one more leg down to accomplish the "Z", which is at least as low as "Y", around 49k to 50k.
Of course for long term view i am still and still so confident that Bitcoin will reach at least 100k to 125k.
LET'S GO!
CHEERSS!!!

BITCOIN The 'March-October' effect kickstarting an insane rally.Back in August we were first to discover and bring to you the 'March - October' effect (see chart below) on Bitcoin (BTCUSD), which is what every one is talking about now as we've started the month of October yesterday and the final quarter (Q4) of the year:
As you can see, this is nothing more than a consolidation that the market tends to make within this 6-month range that ends on October, which kick starts an aggressive rally. That was the case in 2020 (would be more flawless if the COVID crash hadn't distorted the chart) and more recently in 2023. Note that historically October shows gains of around +21.00%.
What we can additionally keep from this chart is that the 1W MA50 (blue trend-line) held on three 1W candle tests since the August 05 Low and that provides the base for a potential October 2024 - March 2025 rally.
March 2025 has high chances of forming the peak of the rally as it historically tends to tops such Bullish Legs and then starts consolidation phases. That was the case on March 2024, March 2023, March 2021 and (as mentioned) if it weren't for the COVID flash crash, would have been most likely the case for March 2020.
All in all, even though the first two days haven't been ideal, we expect October to prepare the foundation for an incredible rally, especially on its last 2 weeks, a rally that might very well reach as high as $150000 before it enters a correction again.
But what do you think? Will October start such a rally? Feel free to let us know in the comments section below!
-------------------------------------------------------------------------------
** Please LIKE 👍, FOLLOW ✅, SHARE 🙌 and COMMENT ✍ if you enjoy this idea! Also share your ideas and charts in the comments section below! This is best way to keep it relevant, support us, keep the content here free and allow the idea to reach as many people as possible. **
-------------------------------------------------------------------------------
💸💸💸💸💸💸
👇 👇 👇 👇 👇 👇

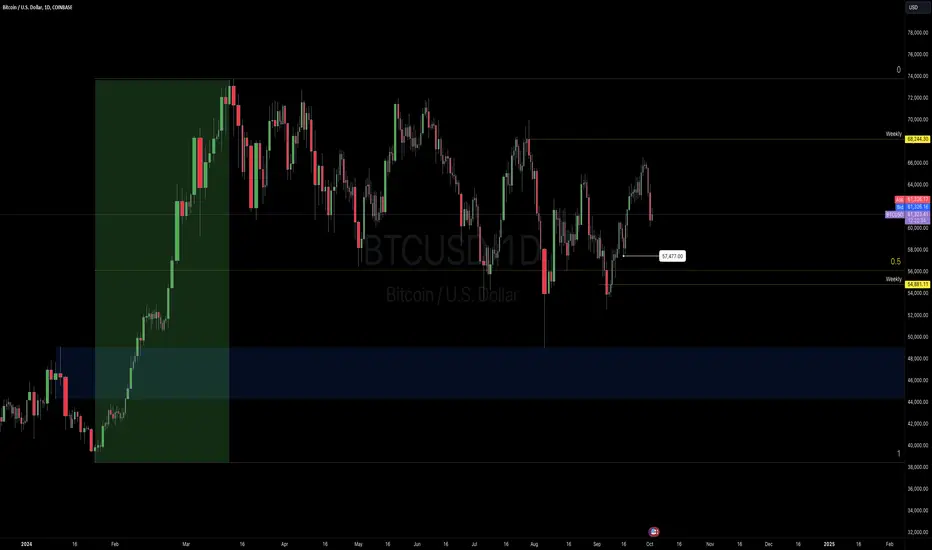
BTC USD IdeaWe need to recognize that we're currently at a range high premium. Bullish entries from these elevated levels typically have a lower probability of success compared to entries from discount lows. Therefore, we need to be cautious and strategic in this price environment. For me, the 57477.00 low is the last bullish low I'm willing to consider. If the price fails to hold above this level, I won't attempt to go long, as the risk would be too high. Instead, I'll focus on absorbing the price action and taking small profits through scalping. I'll avoid large trades as of now, we will keep U posted
Bitcoin (BTCUSDT) Short Trade Setup: Key Levels and TargetsThis chart shows a short trade setup for Bitcoin (BTC/USDT) with clearly marked Entry, Stop Loss (SL), and multiple Take Profit (TP) levels by using the Risological swing trading indicator.
Here’s an analysis of the current situation:
Entry: The short trade entry was triggered at 64354.7 USDT.
Stop Loss (SL): The stop loss is placed at 65437.3 USDT, which is slightly above the resistance level to limit potential losses if the price reverses upward.
Take Profit (TP) Levels:
TP1: The first target is 63016.5 USDT.
TP2: The second target is 60851.1 USDT, and the price has already hit this level.
TP3: The third target is set at 58685.8 USDT.
TP4: The final target is 57347.6 USDT.
Current Price Action:
After entry, Bitcoin has experienced a downward move as expected, already hitting TP2.
The market is showing some consolidation, which may indicate a temporary pause before continuing its downward momentum.
Trade Management :
If the price breaks below TP2 again, the short trade could potentially hit TP3 and TP4, providing an opportunity for more significant gains.
If there’s a reversal, traders should be cautious and manage the trade accordingly, potentially moving the stop loss to breakeven to lock in profits.
This short setup appears to be progressing well, and if the bearish momentum continues, it may hit the lower take profit levels soon.

BTCUSD October Fear Zone – Is 69K Still on the Horizon?GM crypto bro's, finally BTC corrected to the range I've been reminding you about for days now, dipping as low as 60K, and currently, the price is sitting at 61,163. The Fear and Greed Index has dropped into the fear zone at 42, accompanied by the Stoch RSI entering the oversold area.
What's next for BTC? If today's candle closes above 62K, there's a strong potential for 69K to become the next target. However, if the price fails to close above that range, we might see another drop to 59K.
As I remind you daily, the market is dynamic—don’t get FOMO. Always maintain your risk, and as always, this is Akki signing off—one chart, one love. Have a nice day and stay SAFU.

BTC Downtrend Scenario and Key LevelsBTC seems like it is following this daily downtrend channel, and seems to be reversing from the top of the channel.
All the timeframes (Daily, 4H, 1H, and 15 Min) are screaming downtrend.
We saw that it retested the downtrend resistance at 61125 level and looks like it might retest it. We have 5 minutes left in 4H timeframe so will need to wait for it to close and see how price reacts to it.
Will wait for short long entry if the price breaks the 15 min key level and will have the target at the 1 Hour Key Level. (But chances are low).
I feel like we will go down further till 59200 area where the 1 Hour strong demand zone is. If we break that, then we might see 54000 - 50000.
Waiting on the sidelines until I see any clear structure or pattern forming. I feel safe that way.
Good luck and happy trading!

BITCOIN BULLISH TO $77,000 (UPDATE)Finally BTC prices has tapped into our supply zone. We've also seen a clear formation of a 3 Sub-Wave (A,B,C) pattern forming, which adds extra confluence to this trade.
I have placed a buy which is currently open & running! Let's see where this trade takes us!

Bitcoin fail Septembull, Drop or Just a Setup for the Next Pump?GM crypto bro's, today BTC's monthly candle closed without achieving a Septembull, showing instead a tendency for further correction. The Fear and Greed Index is at 50, along with a significant drop in the Stoch RSI.
As mentioned in previous updates, there is still a potential correction down to the 60K - 59K range. BTC currently sits at 63,538 with a strong bearish candle. Is the pump to 69K still possible? Yes, but I personally see only a 30% chance for that, while the probability of a correction to 61K - 59K is around 70%.
Happy payday to those who got paid! Remember, the market is dynamic—don’t get FOMO. Keep buying more Bitcoin, maintain risk even though life is full of risks. A great sailor isn’t great because of a luxurious ship but because of their skill as the captain. As always, this is Akki signing off—one chart, one love. Have a nice day and stay SAFU.

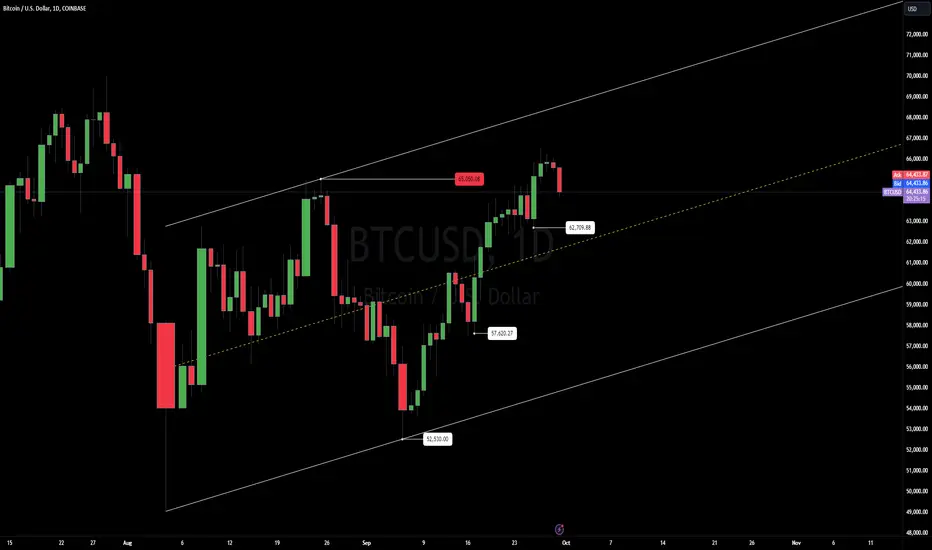
BTC USD IdeaWe ran last week's previous highs, and the structure is bullish. So, we logically need some sort of bull back unless the price is ultra-bullish and starts rejecting the local range on the chart with 62.709 low. If we manage to break through it, we have our bull back to trade lower. If we start to reject 62.709 +OB and shift the structure higher, we keep buying. Simple as that. Overall, on the weekly range, we are in premium pricing, so we do not buy spots, etc. It was last month when we were in a discount. If you missed it, it's not advised to make spot buys.
BTCUSD Correction to 60K - Will September Close Bullish?GM crypto bro's, happy Monday! This morning, the Fear and Greed Index is sitting in the greed zone at 61, while the Stoch RSI remains overbought.
BTC has started to show signs of correction from the 66K range. The potential correction area remains the same as mentioned in our previous updates, targeting the 60K - 59K range, or maybe it will only hit 61K. Keep in mind that tomorrow is the monthly closing candle for September. If BTC closes above 64,700, then we could consider this a Septembull finish.
Remember, the market is dynamic—don’t get FOMO. Always be aware of correction possibilities because anything can happen. Always manage your risk. That’s all for today’s crypto update, this is Akki signing off. One chart, one love. Have a nice day, stay SAFU, and don’t forget—buy more Bitcoin.

Bitcoin: 70K Objective Within Range.Bitcoin has pushed beyond the 64K resistance but is now hesitating with the appearance of an inside bar. If the high of the inside bar is cleared, that would be a momentum continuation signal which can see price push into the 67 to 69K resistance. If the low of the inside bar is cleared, a retrace can unfold which can take price back into the 63 to 64K area (old resistance/new support). The key to navigating this is WAITING for confirmation and having your parameters and expectations predefined. Reacting to market events is typical retail behavior most often a mistake.
The illustration on my chart shows the scenario that I am anticipating over the coming week. (See my previous articles to see these play out). While there is NO way to know if price will follow this path, IF price action confirms, this scenario has a greater probability. I am able to identify these opportunities from carefully evaluating TREND and SUPPORT/RESISTANCE levels. I am simply FOLLOWING what the market is implying through price. I don't have to get overwhelmed with "fundamentals", and "news" and other propaganda because price factors in ALL the known information in the world in a given moment (Efficient Markets). If you understand this concept, it then becomes much easier to recognize opportunities and most importantly measure the associated RISK.
The arrow on my chart points to a predetermined price area (63 to 64K) to watch for If reached. This would be the lowest risk/highest probability point if confirmation appears. Ideal for swing trades especially where reward/risk can reasonably be 2:1 or greater. The reward/risk component depends on how you define risk at the time of the signal (this is what I use Trade Scanner Pro for). You can also use the next support level or candle stick low which is better than nothing.
What is also compelling about this situation is the changing interest rate environment. While the change will not have an instant to the moon effect, it will offer a more supportive environment over time. This will be ESPECIALLY important during pullbacks when support levels are tested. This charge also calls for a closer look at low priced small caps/alt coins because they are poised to benefit from the increasing money supply resulting from lower rates. NOW is the time to be looking to invest, NOT at all time highs. I will be talking more about this soon as well.
How you use this information will mostly depend on your decision making structure. A seemingly more bullish environment does not guarantee trades/investments will work out. Although it does provide for a more forgiving market. Know your RISK before you enter any type of position and this can be defined by using information straight from your chart. For example if Bitcoin confirms a long at 64K, I automatically know risk on this time frame can be at least 1 to 2K points. From there, a profit objective and sizing regime can be worked out. If you are not this organized, do NOT risk real money until you have some kind of management or decision making structure in place.
Thank you for considering my analysis and perspective.

BTCUSD Holding 65K - Pump to 70K or Correction to 60K?GM crypto bro's, happy weekend! This morning, BTC is still holding in the 65K range with the Fear and Greed Index in the greed zone at 63, while the Stoch RSI remains in the overbought area just like yesterday.
Today's market outlook is still the same—potential for an instant pump to 69K - 70K, but also the possibility of a dump down to the 60K - 59K range. So, keep staying safe out there! Remember, the market is dynamic—don’t get FOMO. Be cautious of potential corrections because anything can happen. Always manage your risk. That’s it for today’s crypto update, this is Akki signing off. One chart, one love. Have a nice day and stay SAFU!

BTCUSD Weekend Outlook - Greed Zone at 64, Correction or Pump?GM crypto bro's, happy weekend! This morning, the Fear and Greed Index is in the greed zone at 64, while the Stoch RSI has risen back to the overbought area.
Today's market outlook remains similar to yesterday’s, with a potential correction around the 60K - 59K range, while the pump target is 69K - 70K. Considering it’s the weekend and nearing the end of the month, a correction is likely, especially with the Fear and Greed Index showing high greed at 64.
Keep in mind, the market is dynamic—don’t get FOMO. Be cautious of potential corrections because anything can happen. Always manage your risk. That’s it for today’s crypto update, this is Akki signing off. One chart, one love. Have a nice day!

BITCOIN BULLISH BREAKOUT|LONG|
✅BITCOIN broke the key
Horizontal level of 65k$
And the breakout is confirmed
So we are optimistic about
The local growth and we
Will be expecting a further
Move upwards
LONG🚀
✅Like and subscribe to never miss a new idea!✅

BITCOIN Bullish Breakout At Last! Buy!
Hello,Traders!
BITCOIN was slow to react
To the FOMC decision but
Now it seems we are finally
Seeing a bullish breakout
Of the key horizontal level
Of 65k$ which is now a
Support and as we are
Bullish biased we will be
Expecting a further move up
Buy!
Like, comment and subscribe to help us grow!
Check out other forecasts below too!

BITCOIN (BTCUSD): Road to 68000 ₿
Bitcoin finally leaves clear bullish clues after quite a long
accumulation within a narrow range on a key daily resistance.
The price went up rapidly yesterday and violated the underlined blue structure.
It opens a nice potential for more growth.
Next resistance - 68000.
❤️Please, support my work with like, thank you!❤️

BTC*BTC/LTC: There is something LTC knows about BTCIt this too weird? Relationship between BTC and LTC. I think this bull run peaks mid 2025-maybe Q3 2025.
Bottom during summer 2026. Let's try this.

BTCUSD Approaching 65K - What’s Next? 60K or 70K?GM crypto bro's, this morning, the Fear and Greed Index has risen again, entering the greed zone at 61, and BTC has pumped towards our target in the 65K range.
Yesterday’s correction only reached 62K, without touching 61K, but BTC still managed to correct slightly before successfully pumping into our target range of 65K - 66K. Now, what's next?
In terms of price action on the weekly chart, there's potential for BTC to correct again to the 60K - 59K range, with a potential pump towards 69K - 70K.
Let’s see if the end of this month will bring a "Septembull" or just a "Septembear." Keep in mind, the market is dynamic—don’t get FOMO. Be cautious of potential corrections because anything can happen. Always manage your risk. That’s it for today’s crypto update, this is Akki signing off. One chart, one love. Have a nice day!
