Bitcoin H4 | Potential bullish bounce off a pullback supportBitcoin (BTC/USD) could fall towards a pullback support and potentially bounce off this level to climb higher.
Buy entry is at 99,502.40 which is a pullback support that aligns close to the 23.6% Fibonacci retracement.
Stop loss is at 92,800.00 which is a level that lies underneath a multi-swing-low support and the 38.2% Fibonacci retracement.
Take profit is at 106,765.40 which is a multi-swing-high resistance.
High Risk Investment Warning
Trading Forex/CFDs on margin carries a high level of risk and may not be suitable for all investors. Leverage can work against you.
Stratos Markets Limited (tradu.com):
CFDs are complex instruments and come with a high risk of losing money rapidly due to leverage. 63% of retail investor accounts lose money when trading CFDs with this provider. You should consider whether you understand how CFDs work and whether you can afford to take the high risk of losing your money.
Stratos Europe Ltd (tradu.com):
CFDs are complex instruments and come with a high risk of losing money rapidly due to leverage. 63% of retail investor accounts lose money when trading CFDs with this provider. You should consider whether you understand how CFDs work and whether you can afford to take the high risk of losing your money.
Stratos Global LLC (tradu.com):
Losses can exceed deposits.
Please be advised that the information presented on TradingView is provided to Tradu (‘Company’, ‘we’) by a third-party provider (‘TFA Global Pte Ltd’). Please be reminded that you are solely responsible for the trading decisions on your account. There is a very high degree of risk involved in trading. Any information and/or content is intended entirely for research, educational and informational purposes only and does not constitute investment or consultation advice or investment strategy. The information is not tailored to the investment needs of any specific person and therefore does not involve a consideration of any of the investment objectives, financial situation or needs of any viewer that may receive it. Kindly also note that past performance is not a reliable indicator of future results. Actual results may differ materially from those anticipated in forward-looking or past performance statements. We assume no liability as to the accuracy or completeness of any of the information and/or content provided herein and the Company cannot be held responsible for any omission, mistake nor for any loss or damage including without limitation to any loss of profit which may arise from reliance on any information supplied by TFA Global Pte Ltd.
The speaker(s) is neither an employee, agent nor representative of Tradu and is therefore acting independently. The opinions given are their own, constitute general market commentary, and do not constitute the opinion or advice of Tradu or any form of personal or investment advice. Tradu neither endorses nor guarantees offerings of third-party speakers, nor is Tradu responsible for the content, veracity or opinions of third-party speakers, presenters or participants.
Bitcoin-btcusd

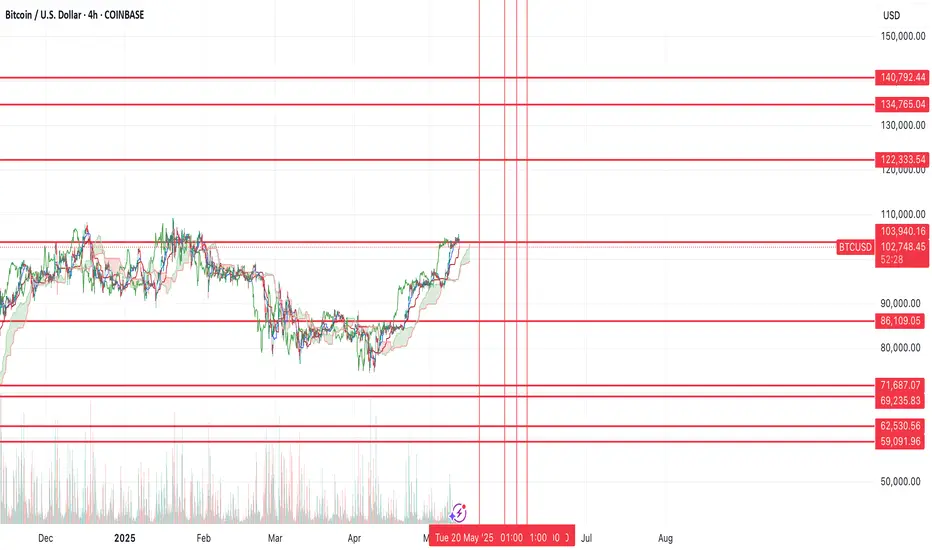
$BTC probability still favors new lowBTC has had a strong rally back into the prior resistance and unless we can break above the prior highs, I still think probability still favors more downside (and I think we see a new low).
I've marked off support levels and resistance levels as I think this will largely be the range over the next year.
My base case as of now, is that we see one more low down in the $69k-$62k region before we start a new run to the highs above ($122k+). Another possibility is that we sweep the lows and bounce at $72k, then move up towards the highs.
That said, the reason I think lower is due to the massive imbalance on the chart that needs to get resolved.
Overall I still think we're in a bullish trend, but that we continue to pullback before the final move higher.
BITCOIN about to test its ATH following HUGE U.S. - China deal!Bitcoin (BTCUSD) is marching towards the $109000 Resistance, which is its All Time High (ATH), following the U.S. - China trade agreement 3 hours ago. This can be a huge fundamental boost to the bullish trend as technically, every time the Resistance level broke during this Bull Cycle, the break-out that followed was extremely aggressive.
On October 2 2023, the Resistance test resulted into a strong break-out, which completed a +96.18% rise from the bottom before a 1D MA100 (green trend-line) pull-back. At the same time of the Resistance break-out, we had a 1D MA50/100 Bullish Cross and a 1W MACD Bullish Cross.
The October 29 2024 Resistance test on the other hand was initially unsuccessful and made a 5 day rejection back near the 1D MA50 (blue trend-line) before the next successful test. Again the rise was more than +96.18%.
As a result, we are expecting to see at least $145k by July (+96.18%) once the Resistance breaks.
Do you think that is a realistic time-frame for $145000? Feel free to let us know in the comments section below!
-------------------------------------------------------------------------------
** Please LIKE 👍, FOLLOW ✅, SHARE 🙌 and COMMENT ✍ if you enjoy this idea! Also share your ideas and charts in the comments section below! This is best way to keep it relevant, support us, keep the content here free and allow the idea to reach as many people as possible. **
-------------------------------------------------------------------------------
💸💸💸💸💸💸
👇 👇 👇 👇 👇 👇

BITCOIN Has Unfinished Business Below $74K! Will It Return?Key Disclaimer: Inefficiencies Don’t Need to Be Filled
Let’s set the stage clearly: inefficiencies like the one at $73,624.98–$74,420.69 for BTCUSD do not HAVE to be filled.
They’re a TENDENCY, not a rule, an intriguing opportunity to explore high-probability zones. If Bitcoin doesn’t return to this level, no harm is done; but this is a very good opportunity to analyze the term, as such... let’s break it down.
What Is an Inefficiency?
An inefficiency, or sometimes a fair value gap (FVG), is a price range with "minimal" trading activity, often caused by a rapid move—here, a rally—creating a liquidity imbalance. On the weekly BTCUSD chart, this area between wicks spans $73,624.98 to $74,420.69, likely formed during a sharp rally around April 2025.
This untested range makes it a potential target for future price action, as markets often seek to resolve such imbalances. Notably, the price has already approached this zone, and there’s a chance it may never return. However, around $74,400, there are still some “unfinished things to do”, untested liquidity, or orders, which could draw the price back if conditions align.
Why Do Inefficiencies Attract Price?
Inefficiencies often act as magnets for price due to:
Liquidity Seeking: Markets revisit areas with unfilled liquidity (stop-loss or pending orders) to balance supply and demand.
Market Memory: Traders and algorithms, target these levels, reinforcing their significance.
Mean Reversion: After rapid rallies, the price may retrace to test imbalances before continuing. (atm we are probably too far from it but still keep this area in your minds)
Institutional Activity: Large players might re-enter at these levels, making them key zones for reversals or consolidation.
Historically, assets tends to revisit such areas, as the chart notes.
BTCUSD Context: $103,000 with Bullish Momentum
As of May 10, 2025, BTCUSD is at ~$103,200 on the weekly chart, on the way to confirm a weekly breakout above $100,000, supported by higher highs, an ascending channel, and macro factors ( for example ETF inflows), signaling quite a strong momentum.
The inefficiency at $73,624.98–$74,420.69 is 28–29% below the current price, a deep pullback that might require a catalyst like a macro correction, negative crypto news, or profit-taking. Given the price has already approached this zone, it may not return, but the “unfinished business” around $74,400 keeps it on the radar. Still, strong trends can bypass inefficiencies, and factors like time decay or adoption may drive prices higher.
Trading Approach, Short-, Mid-Term Investors Take Your Profits!
This formation of inefficiency is not a prediction to short, it’s an opportunity to monitor.
Still, if you’re a short- to mid-term investor, it might be a smart move to take some profits here and observe what unfolds next.
Right now, we’re potentially seeing a double top forming around major psychological levels. And to be honest, the inefficiency below (shown on the chart) still lingers in the back of my mind.
People often ask me: “When is a good time to take profits?”
My answer? Now. It is a perfect example and it fits to all assets.
And here's why. There are clear scenarios that help remove the guesswork:
1. You sell now, and the price continues to rally higher.
That’s not a problem. By selling, you’ve reduced your risk, and securing your profits - always a smart move.
If the price breaks above $100K, you can always buy it back after a confirmed breakout and retest.
That’s a strong sign that investors are willing to pay higher prices for BTC, and historically, after such breakouts (like with the $50K level in August 2024), the market tends to come back to retest that breakout zone.
Of course, if you’re a long-term investor with a 3-5+ year horizon, you may choose to ride it out. In that case, trying to time this might just be over-managing your position. There’s always a chance BTC won’t retest $100K again.
2. The best-case scenario if you take profits now:
You get the chance to buy back lower.
If the market pulls back, keep that inefficiency level in mind—there’s also a mid-term trendline, previous yearly highs, and other technical elements that haven’t been tested yet.
Traders’ psychology hasn’t really been pushed to the limits at this stage, and in my view, the crypto market loves to test limits.
So if you’re a short- or mid-term investor who bought in at lower levels, this is a good time to seriously consider locking in some profits.
Step back, and let the price action guide the next move.
Listen—just listen.
Conclusion
Inefficiencies like the one between $73,624 and $74,420 don’t demand to be filled—but they’re worth understanding, tracking, and learning from. Whether price revisits that zone or not, the real value lies in recognizing where the market has moved too fast and what that might mean if momentum shifts.
Right now, BTCUSD is strong. But strength can fade, sentiment can shift, and “unfinished business” below still holds weight for traders who think in probabilities, not certainties.
If you’re in profit—especially from lower levels—this might be one of those moments to pause, and make sure greed isn’t driving your next decision.
Whether this zone becomes just a memory or a brilliant case study, it’s already a valuable example of how understanding market structure helps you stay a step ahead—not a step behind.
Stay alert. Stay humble. And as said… listen.
Cheers,
Vaido

☄️ Bitcoin : If You're Believer 🅱️ I'd Be A Buyer ☀️Bitcoin 🌏
I'm Going To
Put It To
You Plain And
Simple
If You're Long Term Investor/Believer
I'd Be Buying At These Levels
🎱
BTC/USD
BTC/JPY🏯
BTC/AUD
BTC Total Market Cap
BINANCE:BTCUSD
CRYPTOCAP:BTC
INDEX:BTCUSD
👩🏼🚀👩🏼🚀🚀

“+$25K Profit & Still Long – Don’t Chase, Trade Smart”Since the drop to 74K, we've seen an incredibly fast and powerful rally over the past month—and I’m currently sitting on a realized profit of over $25,000 during this move.
One of the most bullish signals in this entire structure is that since the reversal in April, we’ve never seen a proper correction or trend-reversing retracement. As I mentioned in previous updates, this shows exceptional strength and suggests the uptrend remains firmly intact.
In fact, we’re climbing without breaking any key lows—what I like to call a “step-by-step” grind upward. On higher time frames, these look like strong bullish candles, meaning more buyers than sellers, and aggressive market orders pushing price higher. That’s a characteristic of strong trends—remember that.
Now, with the historical ATH at $109,000 getting closer, I do not expect an immediate breakout to new highs. Instead, we might see a healthy consolidation—either price-wise or time-wise—around this major supply zone. This is not the time to FOMO in.
The recent surge was fueled by comments from President Trump, and that breakout candle was significant. But sharp moves often bring sharp corrections. If price pulls back to the 96–95K zone and finds support, that could be the base for a new push toward all-time highs.
If you’re not in a position right now:
🚫 Do NOT rush into the market.
We are at a spot where both a breakout and a reversal are possible. Whether you’re using the lower or higher time frame, wait for clear confirmation—a pullback, a base, a proper setup.
Look to long only after strong support is confirmed, or short if price keeps failing to break highs. Either way, keep a tight stop and let your winners run—there’s still opportunity here, but only with proper risk-reward.
I’ll say it again because it’s important:
If you missed this long, it’s okay.
The market will correct—whether sharply or slowly—and your edge is not in chasing, but in being ready. Don’t let impulsive trades erase your capital or your confidence.
Oh, and by the way—I’m still holding my long position.

BTCUSD: Reclaimed 100k after 3 months! Next wave to $190k.Bitcoin has turned overbought on its 1D technical outlook (RSI = 73.178, MACD = 2904.000, ADX = 30.769) as it reclaimed the $100,000 marke after exactly 3 months. This is a very structured bullish pattern that consists of a Bullish Wave that peaks and leads to a Megaphone consolidation, which in turn starts the next Bullish Wave. Both waves so far have been around +16.30%. As the 8H MA50 perfectly held Tuesday's low, the pattern has already started the new Bullish Wave, which technically aims for yet another +16.30% rally (TP = 109,000).
## If you like our free content follow our profile to get more daily ideas. ##
## Comments and likes are greatly appreciated. ##

BITCOIN Monthly RSI Heatmap reveals ultimate Cycle Sell Zone!Bitcoin (BTCUSD) has resumed the long-term bullish trend and as of the writing of this analysis, it is about to test the $100k key psychological level. Now that the Bull Cycle is entering its final stage (most likely for the next 6 months at most), it is time to see potential exit levels as close to the expected Top as possible.
There is no better long-term indicator to assist us on this than the 1M RSI, which historically offers a great level to Sell when it enters the 0.786 - 1.0 Fibonacci range of its Channel Down. Currently it is still considerably distanced from that Zone, so the upside potential despite the recent break-out, is huge.
The Sine Waves indicate that in symmetrical terms, the Cycle Top should be priced around November 2025 (previous ones on November 2021, December 2017, December 2013). The closer the 1M RSI is to this date when it enters the 0.786 - 1.0 Fib Zone, the better as the higher the price will most likely be.
Based on this Cycle's Channel Up (blue), a fair Cycle Top range would be $150k - $200k. Would you agree? Feel free to let us know in the comments section below!
-------------------------------------------------------------------------------
** Please LIKE 👍, FOLLOW ✅, SHARE 🙌 and COMMENT ✍ if you enjoy this idea! Also share your ideas and charts in the comments section below! This is best way to keep it relevant, support us, keep the content here free and allow the idea to reach as many people as possible. **
-------------------------------------------------------------------------------
💸💸💸💸💸💸
👇 👇 👇 👇 👇 👇

BTC Tests Key Resistance – Will $102K Give Way or Trigger a Drop⚔️📍 BTC Tests Key Resistance – Will $102K Give Way or Trigger a Drop? 💣📉
The BTC bulls have delivered 🔥 — pushing through the mid-channel resistance and now eyeing the psychological $100K milestone. This current structure remains extremely clean, moving inside a well-defined ascending channel on the 15-min chart.
🔹 Current structure highlights:
Midline support at $98,689
Lower boundary around $96,776
Resistance cluster at $100,001–$100,636
Key upside target: $102,774 (with a 60% confidence level)
Higher timeframe resistance potential: $113K
However, the market isn’t a one-way street. A breakdown below $97,400 shifts momentum bearish — triggering the 40% scenario where BTC could revisit the GETTEX:92K –$94K demand zone. 👀
🎯 This is a pivotal moment: Will BTC break and run to $102K+, or are we due for a cooling phase back toward macro support?
This chart is a playbook — stay tactical, stay sharp, and let structure lead the way. 📐⚡
Let’s see what the next 24–48 hours bring.
One Love,
The FXPROFESSOR 💙

Bitcoin Bulls Aim for $102K – Breakout or Rejection Ahead?🚀📈 Bitcoin Bulls Aim for $102K – Breakout or Rejection Ahead? 🔍🧠
Good morning, good afternoon, or good evening — wherever you are in the world, Bitcoin is pumping, and that’s always a good sign for the bulls! 🐂
In my last BTC update, we anticipated a bounce from the key support zone around $93,600–$93,800, and price respected this level to the dot, rocketing upward just as expected. 🔥✅ That level acted as a strong springboard, and now BTC is climbing through a well-respected ascending channel on the 15-min chart.
📊 Key levels to watch:
Middle of the channel: ~$98,689
Top of the channel: ~$100,636
Psychological level: $100,000
Projected breakout target: $102,774 (60% probability 🚦)
Major resistance beyond: $113,000
However, there's always the alternate scenario: a 40% chance that we reject under $97,400, re-enter the lower end of the channel, and potentially drop toward $92,000 if that support fails. This would flip the bullish structure short-term — something to keep on your radar. ⚠️
This is a high-momentum situation, and I’ll be watching for confirmation of breakout or breakdown. Stay alert, keep your risk in check, and let the chart guide your trades. 📉📈
Let me know your thoughts in the comments — are we headed for $113K or due for a cooldown?
One Love,
The FXPROFESSOR 💙

Trade Idea: BTCUSD Long (BUY LIMIT)Technical Analysis:
Daily Chart
• Trend: Strong uptrend with a recent bullish recovery from a pullback.
• MACD: Bullish crossover, MACD line above Signal line, histogram positive.
• RSI (14): 66.21 — momentum is strong but not overbought.
15-Minute Chart
• MACD: Positive histogram and crossover confirming short-term bullish momentum.
• RSI (14): 53.89 — mid-range, confirming no immediate exhaustion.
• Price Action: Higher lows and higher highs indicate short-term trend alignment with the Daily.
3-Minute Chart
• MACD: Bearish divergence, indicating a possible short-term pullback.
• RSI (14): 43.43 — recent dip offering a better long entry on minor weakness.
• Price: Currently consolidating near $97,000 after rejecting a local high.
⸻
Fundamental Context:
• Macro: Institutional inflows into BTC ETFs and upcoming monetary easing expectations are long-term bullish drivers.
• Market Sentiment: Risk-on behavior across equities is spilling into crypto.
⸻
Trade Setup (Long Position)
• Entry: $96,800
• Minor pullback support zone on M15/M3, aligns with moving average and volume node.
• Stop Loss (SL): $95,400
• Below recent swing low and structural support.
• Take Profit (TP): $100,200
• Near Daily resistance and psychological round number FUSIONMARKETS:BTCUSD

Bitcoin Analysis - 7 MayThe price continues to move within the range of $91,700 - $100,400.
In approximately 3 hours, the FED will announce its interest rate decision.
The expectation is for it to remain unchanged.
If it remains unchanged;
there could be a horizontal consolidation between 94,990 – 97,500.
If a breakout occurs, the upward movement will accelerate; otherwise, there could be a pullback to the 91,781 – 94,990 levels.
If the interest rate is reduced;
the psychological resistance at 100,400 USDT may be tested, and if surpassed, the target of 109,605 (ATH) comes into play.
If the interest rate is increased;
the supports at 94,990 USDT and below could be tested quickly.
The levels of 91,781 and 85,085 USDT become potential targets.
With stronger selling, the support zone at the 2024 ATH level of 73,776 USDT may come into play.

BITCOIN Mirror fractal from the past calls for massive rally!Bitcoin (BTCUSD) appears to be repeating almost the exact same price action as mid-late 2020 as it has broken above the Pivot trend-line that separates the recent distribution from the 2nd Accumulation phase and has successfully re-tested it while the MA50 (blue trend-line) is holding as Support.
If the latter continues to hold, then it might fuel a massive rally similar to October 2020 - April 2021. As you can see both fractals started of with a 1st Accumulation Phase (blue Rectangle) being supported always by their respective MA200 (orange trend-line), which led to the eventual Distribution Phase (red Arc). Even their RSI sequences are identical.
Is this another pattern supporting that BTC will reach at least $150k next? Feel free to let us know in the comments section below!
-------------------------------------------------------------------------------
** Please LIKE 👍, FOLLOW ✅, SHARE 🙌 and COMMENT ✍ if you enjoy this idea! Also share your ideas and charts in the comments section below! This is best way to keep it relevant, support us, keep the content here free and allow the idea to reach as many people as possible. **
-------------------------------------------------------------------------------
💸💸💸💸💸💸
👇 👇 👇 👇 👇 👇

Bitcoin H1 | Potential bullish bounce off a pullback supportBitcoin (BTC/USD) is falling towards a pullback support and could potentially bounce off this level to climb higher.
Buy entry is at 95,480.50 which is a pullback support that aligns with the 50.0% Fibonacci retracement.
Stop loss is at 93,200.00 which is a level that lies underneath a multi-swing-low support.
Take profit is at 97,770.35 which is a swing-high resistance.
High Risk Investment Warning
Trading Forex/CFDs on margin carries a high level of risk and may not be suitable for all investors. Leverage can work against you.
Stratos Markets Limited (tradu.com):
CFDs are complex instruments and come with a high risk of losing money rapidly due to leverage. 63% of retail investor accounts lose money when trading CFDs with this provider. You should consider whether you understand how CFDs work and whether you can afford to take the high risk of losing your money.
Stratos Europe Ltd (tradu.com):
CFDs are complex instruments and come with a high risk of losing money rapidly due to leverage. 63% of retail investor accounts lose money when trading CFDs with this provider. You should consider whether you understand how CFDs work and whether you can afford to take the high risk of losing your money.
Stratos Global LLC (tradu.com):
Losses can exceed deposits.
Please be advised that the information presented on TradingView is provided to Tradu (‘Company’, ‘we’) by a third-party provider (‘TFA Global Pte Ltd’). Please be reminded that you are solely responsible for the trading decisions on your account. There is a very high degree of risk involved in trading. Any information and/or content is intended entirely for research, educational and informational purposes only and does not constitute investment or consultation advice or investment strategy. The information is not tailored to the investment needs of any specific person and therefore does not involve a consideration of any of the investment objectives, financial situation or needs of any viewer that may receive it. Kindly also note that past performance is not a reliable indicator of future results. Actual results may differ materially from those anticipated in forward-looking or past performance statements. We assume no liability as to the accuracy or completeness of any of the information and/or content provided herein and the Company cannot be held responsible for any omission, mistake nor for any loss or damage including without limitation to any loss of profit which may arise from reliance on any information supplied by TFA Global Pte Ltd.
The speaker(s) is neither an employee, agent nor representative of Tradu and is therefore acting independently. The opinions given are their own, constitute general market commentary, and do not constitute the opinion or advice of Tradu or any form of personal or investment advice. Tradu neither endorses nor guarantees offerings of third-party speakers, nor is Tradu responsible for the content, veracity or opinions of third-party speakers, presenters or participants.

BTCUSD Possible Move May 6th 2025🔻 BTC/USD – SHORT SIGNAL & ANALYSIS
📉 Signal:
Sell BTC/USD below 94,000 after a confirmed break and retest of the ascending trendline.
Target: 93,000 liquidity zone
Stop Loss: Above 94,400 (or structure high after retest)
Risk/Reward: Approx. 1:2+
📊 Analysis:
Price has been in a descending channel, followed by a corrective structure forming higher lows.
Currently testing a rising trendline, suggesting weakening bullish momentum.
Clean liquidity pool rests around 93,000, likely to be targeted if structure breaks.
Expected flow:
Break below 94,000 trendline
Retest the trendline as resistance
Continuation to 93,000 demand/imbalance area
🧠 Trade Idea Summary:
This setup aligns with bearish market structure and liquidity concepts. A breakdown from the trendline would confirm bearish intent, with 93,000 as the next logical draw on price.

BITCOIN Climbing the Fibonacci Staircase..Bitcoin (BTCUSD) has come into the Fed Rate Decision week stronger that ever, having staged an impressive rebound from the early-April Low. The consolidation of the last few days is of course a market reaction in anticipation of the big interest rate news.
Regardless of that, the Channel Up that is the underlying pattern from the start of this Bull Cycle has been filling on an impressive symmetrical scale all .382 Fibonacci extensions one by one. The most recent has been the 4.382 and naturally the next in line is the 5.382 Fibonacci extension.
Since the last one (4.382) was almost hit before the price pull-back, it would be more fitting to assume the next peak slightly below the 5.382 Fib ext as well as $170000.
This may very well be the final High i.e. the Cycle's Top before the next Bear Cycle begins, depending on the time it hits it.
Do you think that would be the case? Feel free to let us know in the comments section below!
-------------------------------------------------------------------------------
** Please LIKE 👍, FOLLOW ✅, SHARE 🙌 and COMMENT ✍ if you enjoy this idea! Also share your ideas and charts in the comments section below! This is best way to keep it relevant, support us, keep the content here free and allow the idea to reach as many people as possible. **
-------------------------------------------------------------------------------
💸💸💸💸💸💸
👇 👇 👇 👇 👇 👇

BTCUSD: 1H Death Cross might be dangerous but expect $100k if inBitcoin remains bullish on its 1D technical outlook (RSI = 61.614, MACD = 2557.800, ADX = 37.923) despite the correction since Friday's high. This is because the underlying pattern is a Bullish Megaphone which just bottomed. On the other hand, the 1H timeframe just formed a Death Cross. If this is invalidated and the price remains inside the Bullish Megaphone (also see that the 1H RSI is on a Bullish Divergence), we can see $100k on the next leg up (1.5 Fib extension like the 2 HH before). If the Bullish Megaphone breaks, testing the 1D MA200 at least, is veyr likely.
## If you like our free content follow our profile to get more daily ideas. ##
## Comments and likes are greatly appreciated. ##

BITCOIN Support Ahead! Buy!
Hello,Traders!
BITCOIN is trading in an
Uptrend but is making a
Local bearish correction
However, a horizontal
Support level is ahead
Around 92,191$ so after
The retest we will be expecting
A local bullish rebound
And a move up
Buy!
Comment and subscribe to help us grow!
Check out other forecasts below too!
Disclosure: I am part of Trade Nation's Influencer program and receive a monthly fee for using their TradingView charts in my analysis.

BITCOIN 1st 1W MACD Bullish Cross in 7 months!Bitcoin (BTCUSD) is ahead of completing this week a Bullish Cross on its 1W MACD, which will be the first one after 7 months (since October 14 2024).
This is a major technical bullish development as since the very first one (Sep 26 2022) right before the November 21 2022 Bear Cycle bottom, it has always kick-started the Bullish Legs of this 2.5-year Channel Up.
In addition to that, this was accompanied by an Ichimoku Bullish Cross, where the Conversion Line (green) crossed above the Base Line (black). Considering also that exactly 4 weeks ago BTC found Support and rebounded on the 1W MA50 (blue trend-line), we can safely confirm a Bottom there and call for the minimum +100.73% rise, similar to the first Bullish Leg of this Channel Up. We remain consistent to our $150000 Target.
So do you think this 1W MACD Bullish Cross is the final confirmation we need for the new Bullish Leg? Feel free to let us know in the comments section below!
-------------------------------------------------------------------------------
** Please LIKE 👍, FOLLOW ✅, SHARE 🙌 and COMMENT ✍ if you enjoy this idea! Also share your ideas and charts in the comments section below! This is best way to keep it relevant, support us, keep the content here free and allow the idea to reach as many people as possible. **
-------------------------------------------------------------------------------
💸💸💸💸💸💸
👇 👇 👇 👇 👇 👇

Bitcoin H4 | Potential bullish bounceBitcoin (BTC/USD) is falling towards a swing-low support and could potentially bounce off this level to climb higher.
Buy entry is at 91,933.60 which is a swing-low support that aligns close to the 23.6% Fibonacci retracement.
Stop loss is at 87,400.00 which is a level that lies underneath a pullback support.
Take profit is at 99,342.60 which is a swing-high resistance.
High Risk Investment Warning
Trading Forex/CFDs on margin carries a high level of risk and may not be suitable for all investors. Leverage can work against you.
Stratos Markets Limited (tradu.com):
CFDs are complex instruments and come with a high risk of losing money rapidly due to leverage. 63% of retail investor accounts lose money when trading CFDs with this provider. You should consider whether you understand how CFDs work and whether you can afford to take the high risk of losing your money.
Stratos Europe Ltd (tradu.com):
CFDs are complex instruments and come with a high risk of losing money rapidly due to leverage. 63% of retail investor accounts lose money when trading CFDs with this provider. You should consider whether you understand how CFDs work and whether you can afford to take the high risk of losing your money.
Stratos Global LLC (tradu.com):
Losses can exceed deposits.
Please be advised that the information presented on TradingView is provided to Tradu (‘Company’, ‘we’) by a third-party provider (‘TFA Global Pte Ltd’). Please be reminded that you are solely responsible for the trading decisions on your account. There is a very high degree of risk involved in trading. Any information and/or content is intended entirely for research, educational and informational purposes only and does not constitute investment or consultation advice or investment strategy. The information is not tailored to the investment needs of any specific person and therefore does not involve a consideration of any of the investment objectives, financial situation or needs of any viewer that may receive it. Kindly also note that past performance is not a reliable indicator of future results. Actual results may differ materially from those anticipated in forward-looking or past performance statements. We assume no liability as to the accuracy or completeness of any of the information and/or content provided herein and the Company cannot be held responsible for any omission, mistake nor for any loss or damage including without limitation to any loss of profit which may arise from reliance on any information supplied by TFA Global Pte Ltd.
The speaker(s) is neither an employee, agent nor representative of Tradu and is therefore acting independently. The opinions given are their own, constitute general market commentary, and do not constitute the opinion or advice of Tradu or any form of personal or investment advice. Tradu neither endorses nor guarantees offerings of third-party speakers, nor is Tradu responsible for the content, veracity or opinions of third-party speakers, presenters or participants.

Bitcoin Technical AnalysisFenzoFx— Bitcoin began consolidating after peaking at $98,000, dipping toward the $93,565 support and now trading slightly above it. The Stochastic Oscillator sits below 25, suggesting BTC is oversold and may rebound.
Immediate support lies at $92,565. If this level holds, the uptrend could resume, targeting $98,000, with potential to push toward the $99,560 resistance if buying pressure increases.
Bearish Scenario: A drop below $91,720 would invalidate the bullish outlook, potentially extending the decline to $88,830.
>>> Prop Trading
>>> No Deposit Bonus
>>> %100 Deposit Bonus
>>> Forex Analysis Contest
All at FenzoFx Decentralized Forex Broker

Eyes Fresh Upside Within Ascending Channel 📈🟢 BTCUSD Eyes Fresh Upside Within Ascending Channel 🚀💰
No time to wait for the open – this dip might already be the setup! 🔍
Bitcoin continues to respect the ascending channel, with the latest touch on the lower boundary lining up perfectly with the 95,568 zone. Historically, each visit to this trendline has produced a strong bounce – and we can see it clearly through the green arrows across the chart.
As of now, price is holding just above the key support at 95,120, and unless we see a strong break below that level (with confirmation below 94,806), this looks like another textbook “buy the dip” scenario. 🛒
Upside targets remain:
🔹 97,432 – mid-channel resistance
🔹 99,161 – channel top, potential exhaustion zone
I’ll be watching for a minor pullback or consolidation (as shown), but I’m not waiting on the sidelines for the open – structure supports continuation. Don’t fight the trend when the channel is this clean. 📊
Key support levels to monitor on downside invalidation:
⚠️ 94,806
⚠️ 94,120
⚠️ 93,806
⚠️ 92,709 (channel invalidation below here)
Stick to structure, trust the levels, and respect the momentum. And if we end up under the channel remember it becomes resistance. Long ONLY over 95600 here.
One Love,
The FXPROFESSOR 💙

Bitcoin: First Leg Of Wave 5 To 109K.Bitcoin has lingered around the 95K resistance area over the previous week. In my opinion this is a sub wave iii completion (5 mini waves can be counted within the bullish breakout leg). This implies there is a greater probability of a retrace or sub wave iv (see wave count on chart). The retrace can go as low as the 90K support without overlapping sub wave i which would keep the bullish impulse in play. Also there is enough evidence here to suggest this structure is likely the first wave of the broader Wave 5 which can see a test of the 109K high over the coming months.
The current high (see arrow) shows signs of potential reversal at a location where such a pattern can be expected. The question is, when will it retrace and how far? It is anyone's guess. This is where you have to have the ability to adjust as the market provides new information. Until then the best we can do is assess loose probabilities and wait to see how the market aligns or not.
The adjustment process is two fold: evaluating support/resistance levels and assessing the RISK associated with a given scenario. For example, the illustration on the chart shows a retrace back to 90K, this or some variation of this scenario may or may not unfold. The key is to have levels identified in advance and then WAITING to see how the market behaves at such levels. Does it confirm our idea or not? In the case of Bitcoin now, the 95K area resistance is sticking and a reversal pattern has appeared which adheres to the retrace scenario, but how far it retraces is up to Bitcoin. We have to wait and see what type of bullish reversals appear and where they appear before RISK can be assessed for a swing trade on this time frame.
Markets that linger around levels can be very hard to trade if you are the type that forces trades or assert opinions. Slow grinds are especially tough to sit through which is why I always suggest evaluating smaller time frames while keeping this bigger picture in mind. There are plenty of smaller opportunities to capitalize on if you can recognize the support/resistance levels and trend structure on the smaller time frames without losing site of the bigger picture.
On this time frame for swing trades, I am not interested in the short side. I prefer to wait for the retrace (wave iv) measure to see how far it goes, WAIT for the reversal confirmation, then quantify the RISK from that point. IF this scenario appears, I would be anticipating a retest of the 100K resistance and expecting a greater chance of a breakout to a higher high (low to mid 100ks)? This can take at least two weeks to play out in my opinion. And if this scenario does not play out, then adjust to the whatever new information the market is presenting.
Thank you for considering my analysis and perspective.
