Bitcoin Tests March HighsBTC tests March highs after 2 weeks of bullish price action and a double bottom / reversal pattern on Apr 9.
Currently testing significant price levels around FWB:88K and 1D 200MA, a decisive break above could signal a push towards $92k.
Failing to reclaim FWB:88K - GETTEX:89K could lead to a retest of $85k - $86k before attempting to reclaim previous R as S.
Bitcoin-btcusd

Bitcoin H4 | Potential pullback before bouncing higher?Bitcoin (BTC/USD) could fall towards a pullback support and potentially bounce off this level to climb higher.
Buy entry is at 88,033.50 which is a pullback support.
Stop loss is at 85,500.00 which is a level that lies underneath a pullback support.
Take profit is at 92,708.20 which is a swing-high resistance.
High Risk Investment Warning
Trading Forex/CFDs on margin carries a high level of risk and may not be suitable for all investors. Leverage can work against you.
Stratos Markets Limited (tradu.com):
CFDs are complex instruments and come with a high risk of losing money rapidly due to leverage. 63% of retail investor accounts lose money when trading CFDs with this provider. You should consider whether you understand how CFDs work and whether you can afford to take the high risk of losing your money.
Stratos Europe Ltd (tradu.com):
CFDs are complex instruments and come with a high risk of losing money rapidly due to leverage. 63% of retail investor accounts lose money when trading CFDs with this provider. You should consider whether you understand how CFDs work and whether you can afford to take the high risk of losing your money.
Stratos Global LLC (tradu.com):
Losses can exceed deposits.
Please be advised that the information presented on TradingView is provided to Tradu (‘Company’, ‘we’) by a third-party provider (‘TFA Global Pte Ltd’). Please be reminded that you are solely responsible for the trading decisions on your account. There is a very high degree of risk involved in trading. Any information and/or content is intended entirely for research, educational and informational purposes only and does not constitute investment or consultation advice or investment strategy. The information is not tailored to the investment needs of any specific person and therefore does not involve a consideration of any of the investment objectives, financial situation or needs of any viewer that may receive it. Kindly also note that past performance is not a reliable indicator of future results. Actual results may differ materially from those anticipated in forward-looking or past performance statements. We assume no liability as to the accuracy or completeness of any of the information and/or content provided herein and the Company cannot be held responsible for any omission, mistake nor for any loss or damage including without limitation to any loss of profit which may arise from reliance on any information supplied by TFA Global Pte Ltd.
The speaker(s) is neither an employee, agent nor representative of Tradu and is therefore acting independently. The opinions given are their own, constitute general market commentary, and do not constitute the opinion or advice of Tradu or any form of personal or investment advice. Tradu neither endorses nor guarantees offerings of third-party speakers, nor is Tradu responsible for the content, veracity or opinions of third-party speakers, presenters or participants.

The Bitcoin Trust Flow Cycles Model: What Comes Next (chart)b]📉 The Bitcoin Trust Flow Cycles Model: What Comes Next
Video idea here:
Friends, if you’ve seen my last two posts, you already know — we’re no longer relying on broken halving cycles or outdated narratives.
We’re now in the realm of The Bitcoin Trust Flow Cycles™ by FXPROFESSOR — a framework that maps how trust moves between Bitcoin and traditional assets like U.S. Treasuries .
And today’s update? It might be the most important one yet.
🔁 Quick Recap: What Is This Model?
This model tracks Bitcoin’s relationship to long-term U.S. Treasury Bonds (TLT), cycling between:
• Correlated Periods (Blue): BTC and TLT move in the same direction
• Inverted Periods (Green): BTC and TLT move in opposite directions
And here’s the magic:
These flips often occur right at key structural levels in the bond market.
🧠 Where Are We Now?
We’re still in an Inverted Period — the 6th major one.
• TLT (Treasuries) are dropping again
• Bitcoin is rising against that backdrop
• The previous support at ~86.8 failed — we are now sliding toward the next major level
That level?
📌 71.32 – the all-time structural support for TLT going back to 2004
It’s the same zone that sparked Bitcoin’s explosive moves in the past.
📉 My Expectation:
• TLT continues sliding lower
• It finds support around 71–76
• Once that happens, we enter a Reversion Phase — where Bitcoin and TLT rise together again
• Bitcoin doesn’t just “survive” the macro shakeout — it thrives on it
This would be the 6th inversion-to-correlation flip in the model — and historically, these have marked powerful Bitcoin trends.
📊 Why This Model Matters
This isn't just about price.
It’s about trust .
It’s about rotation .
It’s about macro capital flow .
Forget halving hype — this model focuses on how institutional trust migrates between old systems (bonds) and new systems (Bitcoin).
When TLT fails, Bitcoin rises.
When TLT finds support, Bitcoin joins in.
This is not just a macro hedge.
This is the new cycle narrative .
🔍 What to Watch:
• Does TLT drop to 71?
• Do we find a bottom and reverse?
• Does BTC correlate again and break out above 115?
If so — we may be on the cusp of a new correlated bull leg .
This post builds on the foundation I laid here:
📌
📌
This is part 3.
The signal is there.
The rotation is happening.
The trust is shifting.
Are you watching?
One Love,
The FXPROFESSOR 💙

Bitcoin Pi Cycle Top Risk IndicatorIn this idea, I’ll walk you through the Bitcoin Pi Cycle Top Risk Indicator — a tool based on the well-known Pi Cycle Top Indicator.
By the end, we’ll have a new lens to analyze INDEX:BTCUSD market cycles. 👇
First, a quick recap of the original Pi Cycle Top Indicator. It uses two moving averages:
— 111-day MA (111DMA)
— 350-day MA × 2 (350DMA x 2)
A bullish crossover (111DMA crossing above 350DMA×2) historically predicted BTC tops within 3 days.
However, one sould know that in 2021 the signal occurred in April (the first peak). The higher November peak didn’t trigger the indicator.
Now let’s take the ratio: 111DMA / (350DMA × 2) → this gives us the Pi Cycle Top Ratio (orange line). When the ratio crosses 1 from below, that’s equivalent to the original Pi Cycle Top signal.
As you can see: each new major peak is lower than the previous. In 2021, the ratio barely touched 1. This implies that in this cycle, the moving averages may not cross — and Pi Cycle Top Indicator may not generate a signal .
Can we forecast the next peak of the Ratio? (Keep in mind: Ratio peaks ≠ BTC price peaks but we'll get back to it later.)
Turns out the Ratio peaks fit nicely along a logarithmic curve — let’s plot it. And the lows sit on a straight line. We add both bounds, plus a midline.
Now we have a band within which the Ratio tends to move — useful for anticipating turning points.
Next, let’s normalize the Ratio within this band:
— bottom bound = 0
— top bound = 1
This gives us the Pi Cycle Top Risk indicator — a clean, scaled version of market risk.
Currently, it sits at 0.47 , right around the mid-range.
Now let’s compare Pi Cycle Top Risk to past BTC tops and bottoms (using daily closes).
We’ll treat April 2021 as the last cycle top.
The chart shows:
— BTC tops occurred when Risk ≥ 0.79
— Bottoms occurred when Risk ≤ 0.24 (or ≤ 0.10 excluding 2011)
Summary:
1. Right now, Pi Cycle Top Risk ≈ 0.47 and has been hovering near 0.5 for the past year.
This reflects a relatively low volatility during this market cycle — BTC has been rising steadily, with pauses for consolidation, no mania phase and blow-off top.
2. How can we use this going forward?
I can’t say whether the Risk will rise or fall — and there’s no guarantee it’ll hit the boundaries.
But if it's ever:
— Above 0.9 (bright-red zone) → strong signal to consider selling
— Below 0.1 (bright-green zone) → potentially good buy opportunities
Not financial advice.
We’ll keep tracking it.

BITCOIN Most POWERFUL Signal Activated—Former ATH IS NOW SUPPORTBitcoin (BTCUSD) completed two straight green 1W candles and has started off this week equally impressive, approaching 4-week Highs! This is a direct consequence of the 1W MA50 (blue trend-line) holding as a Support, similar to what happened on the last two Higher Lows of the 3-year Channel Up on August 05 2024 and September 11 2023.
The hidden catalyst perhaps behind this strong move may be the fact that the April 07 2025 Low, besides the 1W MA50, it also rebounded on the former All Time High (ATH) Resistance Zone (red), which now turned into Support (green). This is the Zone that started with the November 08 2021 Cycle High and rejected BT on March 11 2024, April 08 2024, June 03 2024 and July 29 2024.
As long as this critical Support cluster (1W MA50, 2021 ATH Zone) holds, we are expecting the 1W MACD to form a new Bullish Cross, the first since October 14 2024, which technically confirmed the new Bullish Leg of the 3-year Channel Up.
In fact all previous 3 Bullish Legs got confirmed by a 1W MACD Bullish Leg and the minimum the rose by was +105.30%. As a result, after the Bullish Cross is confirmed, we will be expecting to see at least $150000 on this current bull run.
But what do you think? Can this hugely important Support cluster lead Bitcoin to $150k? Feel free to let us know in the comments section below!
-------------------------------------------------------------------------------
** Please LIKE 👍, FOLLOW ✅, SHARE 🙌 and COMMENT ✍ if you enjoy this idea! Also share your ideas and charts in the comments section below! This is best way to keep it relevant, support us, keep the content here free and allow the idea to reach as many people as possible. **
-------------------------------------------------------------------------------
💸💸💸💸💸💸
👇 👇 👇 👇 👇 👇


Bitcoin: Watch For These Break Out Scenarios.Bitcoin is consolidating within a very tight range: between 83 and 86K. Which way it breaks is a matter of catalyst, but recognizing the break can help to better shape expectations on this time horizon. IF 83K breaks, I will be watching for the higher low scenario (see blue square), for confirmations to go long. IF 86K breaks, I will be anticipating a test of the 88 K resistance (see arrow). What happens after that is anyone's guess. This is NOT about forecasting the future, it is about considering multiple scenarios and then adjusting as the market offers new information.
This evaluation can be helpful on multiple time frames if you know how to use it. For example, a break of the 83K support can be a great day trade opportunity on time frames like the 5 minute. A test of the 78K to 80K area followed by a confirmation can offer a long opportunity on the swing trade or day trade time frames. A test of the 88K or 90K resistance levels can offer aggressive short opportunities on smaller time frames as well. You have to be prepared for the possibility of the corresponding pattern to appear (bullish/bearish reversal) and confirmation. From there risk can be effectively quantified and taking action becomes reasonable.
Getting stuck on 1 scenario rather then being prepared for multiple possibilities makes you inflexible because there is NO precision in financial markets (unless you're on the micro structure level MOST retail traders are NOT). The scenarios I explained here can unfold over the week or take longer, AGAIN is it a matter of catalyst or surprise news event.
As far as the bigger picture, nothing has changed. The 76K AREA low is a double bottom, which translates into a broader higher low when you look back over the year. This higher low structure implies Bitcoin is still generally BULLISH which means betting on resistance levels can be considered a lower probability outcome. This also means current prices are still attractive investment levels as long as you are sizing strategically. IF price manages to break below 65K over the next quarter, then I would say investing should be more limited since such a break implies the impulse structure is no longer in play.
Other than that, seasonal volume typically peaks around this time of year in the stock market, which means the next few months are more likely to be less eventful and contain smaller price ranges etc. There are always exceptions and news catalysts will still cause price spikes, but the dramatic nature like we have seen will likely be smaller. So unless there are any surprises in Bitcoin, be prepared for slow grinds or less eventful movements generally speaking.
Thank you for considering my analysis and perspective.

Bitcoin Monitoring- This is not a trade setup.
--------------------------------------------
- Zones to keep close surveillance :
--------------------------------------------
- 25,200$
- 27,300$
--------------------------------------------
Happy Tr4Ding!

BTC Diamond Ser ?- While bears see bearish pennants, I see diamonds in the rough.
- I remain bullish, not due to the price, but for the sake of humanity.
- This isn’t an analysis, just a light-hearted joke, so please don’t roast me too hard! 🙏.
- Remember, diamonds are forever.
- Hodl!
Happy Tr4Ding!

BITCOIN BULLISH TO $114,000 - $116,000In Q1 2025 I said I expect a retracement back towards $86,000 - $78,000 as Wave IV retracement.
BTC has now hit our Wave IV target. So according to my report & analysis, our next target is Wave V. Priced around the $114,000 region.
Market Structure Invalidation: $74,450❌

BITCOIN just triggered the ultimate post-Halving BUY SIGNAL!Bitcoin (BTCUSD) hit last week the top of the green Gaussian Channel (GC), a key indicator as last time it did (September 02 2024), kickstarted the massive 2024 rally towards the end of the year.
In fact, it can be argued that when BTC makes contact with the GC during a Bull Cycle, it is the ultimate pull-back Buy Signal after Halving events. More specifically, during the previous Cycle and after the May 2020 Halving, the price touched the GC three times (August 31 2020, July 19 2021 and September 20 2021), all of which were the most optimal pull-back Buy Entries as Bitcoin rebounded instantly.
So far during this Cycle and after the April 2024 Halving, this is the 2nd time the GC is tested. As mentioned the first also initiated an instant rebound. As a result, the current GC test is technically considered a very strong buy opportunity for the remainder of the Cycle, which based on the Time Cycles of the last 2 Cycle Tops, it should peak around October 06 2025.
So what do you think? If buying now towards a potential October 2025 Top, the perfect opportunity? Feel free to let us know in the comments section below!
-------------------------------------------------------------------------------
** Please LIKE 👍, FOLLOW ✅, SHARE 🙌 and COMMENT ✍ if you enjoy this idea! Also share your ideas and charts in the comments section below! This is best way to keep it relevant, support us, keep the content here free and allow the idea to reach as many people as possible. **
-------------------------------------------------------------------------------
💸💸💸💸💸💸
👇 👇 👇 👇 👇 👇

BITCOIN Sell everything in October!Yep, kind of a clickbait title but it doesn't fail to serve justice to this very important Bitcoin (BTCUSD) chart.
Today's analysis displays in the most illustrative way the extremely tight symmetry between BTC's Cycles and how this can help us time our Sell at the Top of the Cycle and equally have the patience to buy as close to the next Bottom as possible.
As you see, in the past +10 years since the 2014 Bear Cycle, every Cycle has almost identical time ranges/ durations. All three Bear Cycles since then, lasted for approximately 1 year, and both Bull Cycles for almost 3 years (152 weeks, 1064 days to be exact). More specifically, the last two Bear Cycles were exactly 1 year long, the 2018 one started on the week of December 11 2017 and ended on December 10 2018 and the next Bear Cycle started on November 15 2021 and ended on November 07 2022. So it's been December-to-December and November-to-November Bear Cycles respectively.
If this high degree of symmetry continues to hold, counting 1064 days from the last Cycle Bottom o November 07 2022, gives a time estimate for the next Cycle Top on (the week of) October 06 2025. If also that holds for the Bear Cycle, expect an October-to-October duration, with an approximate bottom on October 12 2026.
So Sell everything up to October 2025 and Buy back as we get close to October 2026 is the strategy?
Feel free to let us know in the comments section below!
-------------------------------------------------------------------------------
** Please LIKE 👍, FOLLOW ✅, SHARE 🙌 and COMMENT ✍ if you enjoy this idea! Also share your ideas and charts in the comments section below! This is best way to keep it relevant, support us, keep the content here free and allow the idea to reach as many people as possible. **
-------------------------------------------------------------------------------
💸💸💸💸💸💸
👇 👇 👇 👇 👇 👇

Bitcoin - This Is Just Wonderful!Bitcoin ( CRYPTO:BTCUSD ) creates textbook market stucture:
Click chart above to see the detailed analysis👆🏻
The entire stock market is selling off significantly but Bitcoin and most cryptocurrencies are still holding their strong levels. This is clearly a sign of bullish strength and even if we see a retest of the previous all time high, the overall uptrend remains perfectly valid over the next months.
Levels to watch: $70.000
Keep your long term vision,
Philip (BasicTrading)

The Bitcoin Trust Flow Cycles- by FXPROFESSOR🏆 The Bitcoin Trust Flow Cycles™ by FXPROFESSOR
Video:
Friends, today I’m sharing what may be the most important Bitcoin framework of 2025.
Forget the broken halving expectations. Forget the chaos of macro headlines.
What if the real signal has been here all along?
What if Bitcoin’s true rhythm follows the capital rotation between itself and the U.S. Treasury market?
📊 Introducing: The Bitcoin Trust Flow Cycles™
This is not a model of where Bitcoin could go (like Stock-to-Flow)…
This is a model of when and why it moves — based on the trust rotation between U.S. Treasury Bonds (TLT) and Bitcoin.
What I’ve found is a repeating structure — not based on supply or halvings, but on macro trust dynamics.
🔁 The Two Core Phases:
• Correlated Periods 🟦 (Blue zones): BTC and TLT move together — both rising or falling
• Inverted Periods 🟩 (Green zones): BTC and TLT move in opposite directions
These aren't random — they're structural rotations that occur at key technical levels in the bond market.
🧠 The Cycle Timeline:
Jan 2019 – Feb 2020 → Correlated (pre-COVID calm)
Feb 2020 – Sep 2021 → Inverted (Fed QE, Bitcoin moon)
Sep 2021 – Nov 2022 → Correlated (everything dumps)
Nov 2022 – Oct 2023 → Inverted (TLT collapse, BTC recovers)
Nov 2023 – Aug 2024 → Correlated (sideways digestion)
Aug 2024 – Now (Apr 2025) → Inverted again — and compressing fast
We're now in Period 6 — an Inverted Period — but all signs point to an upcoming Reversion.
📉 What Happens at Each Flip?
These transitions tend to occur when:
• TLT hits major channel support or resistance
• Macro fear or liquidity shocks drive trust shifts
• Smart money starts reallocating across asset classes
Right now, TLT is at channel support — a zone that has previously triggered reversions into correlated periods.
📌 What Comes Next:
According to the Bitcoin Trust Flow Cycles™:
→ We are statistically due for a reversion** back into correlation
→ If TLT bounces from 76–71 zone… BTC may follow — not fight
→ The target remains: BTC breaking above 115 resistance
This flip — from inverse to correlated — has historically marked breakout windows for Bitcoin.
🔮 This Is Bigger Than a Halving
Plan B’s Stock-to-Flow gave us valuable insight into long-term valuation.
But it doesn’t explain timing.
This model isn’t about supply mechanics.
It’s about macro trust mechanics.
When institutional confidence leaves Treasuries…
And enters Bitcoin…
That’s the rotation we track.
That’s what moves the chart now.
🎯 Watchlist: • TLT support: 76 → 71 zone = reversal signal
• BTC breakout trigger: 115 resistance
• Cycle shift: Reversion = Bitcoin joining TLT upside
If this plays out, it could mark the most important trust cycle breakout we’ve seen since the COVID inversion.
Bitcoin doesn’t need permission anymore.
It just needs a macro trigger. And this model helps us spot it.
One Love,
The FXPROFESSOR 💙
📌 Missed the full credit market breakdown? Check my recent posts on BKLN, HYG, LQD, and TLT to understand the full Trust Flow rotation.
Forget halving hype. This new model tracks when Bitcoin moves with (🔄) or against (🔁) U.S. Treasuries — based on macro trust flows.
And right now? We're at the edge of an EPIC reversion.📈📈📈
👇
#Bitcoin #Macro #TrustFlow #TLT CRYPTOCAP:BTC

Market Update - This Stock Market Analysis Aligns With Bitcoin..What if I told you that the stock market’s pattern could actually reveal what’s coming next for Bitcoin—would you stick around and watch the entire video? That’s exactly what I’m diving into here. I didn’t force this analysis to fit; somehow, over the past week, it just lined up this way.
In this video, I break down exactly why the next market move could be more severe than anything we’ve seen in our lifetime—yet it’s not the end of the world. In fact, if approached correctly, this could be the opportunity of a lifetime. The rebound that follows could be massive.
I’ve always had a gut feeling about this, but now the patterns are speaking loud and clear. This is the reason I created AriasWave—and this is exactly where we are right now.
This also aligns with my latest Euro analysis linked below in related ideas.

BITCOIN's 1D MA50 Flip = GREEN LIGHT for the NEXT BIG PUMP!Bitcoin (BTCUSD) closed Saturday's 1D candle above the 1D MA50 (blue trend-line) for the first time in more than 2 months (since February 03)! The 1D MA50 got tested and rejected the price 6 times since then. At the same time, the price marginally broke above the Lower Highs trend-line that started on the January 20 All Time High (ATH).
This is the most powerful short-term bullish combination as it was staged on a Bullish Divergence 1D RSI, which is on Higher Lows against the bearish trend's Lower Lows. Technically such break-outs immediate Target is the 2.0 Fibonacci extension, which now happens to be just below the $100k mark at $99500. In not such a coincidental fashion, that is he last Resistance level that run through February 05 - 21 before BTC's strong tariff sell-off.
So do you think the 1D MA50 break is the green light for a $99500 rally? Feel free to let us know in the comments section below!
-------------------------------------------------------------------------------
** Please LIKE 👍, FOLLOW ✅, SHARE 🙌 and COMMENT ✍ if you enjoy this idea! Also share your ideas and charts in the comments section below! This is best way to keep it relevant, support us, keep the content here free and allow the idea to reach as many people as possible. **
-------------------------------------------------------------------------------
💸💸💸💸💸💸
👇 👇 👇 👇 👇 👇

Bitcoin: Anything Goes Inside The Range.Bitcoin has rallied out of my anticipated 76K AREA reversal zone (see my previous week's analysis). I anticipated this move BEFORE all of the news and drama that transpired over the week because I focus on relevant information that came from this chart. As of now, price is fluctuating in the middle of a consolidation. While price is still attractive in terms of the bigger picture for investment, the fact that it is in the middle of a short term consolidation must be strongly considered for day and swing trade strategies. Here's my perspective.
A double bottom (failed low) has been established around the 74 to 76K area. It does NOT matter why, all that matters is the structure is now in place. This is very important for two specific reasons: 1) it is a broader higher low (Wave 4 bottom?) which implies a higher high or at least test of high is more likely to follow. This means test of 109K over the coming months is within reason. 2) Resistance levels have a greater chance of breaking while supports have a greater chance of being maintained. Current prices up into the 90K resistance are attractive for dollar cost averaging while broader risk can be measured by the 76K area low.
As for swing trades, price is fluctuating at a mid point of a consolidation. The range low is around 76K, the high around 88K (see arrow). When it comes to smaller time frame strategies, consolidation mid points are HIGHLY random areas. This is where you either WAIT it out for a support or resistance to be reached before taking a signal OR go with continuation patterns (Trade Scanner Pro great for this). The higher probability scenario would be a minor retrace into the high 70Ks or low 80Ks for a swing trade long. Otherwise WAIT for the 88K to 90K resistance area for short signals which would be EXTREMELY aggressive given the fact Bitcoin is generally bullish.
And day trades strategies have a similar outlook. Being in the middle of the range means smaller time frame supports and resistances within the area 83K to 88K are going to be less reliable or more random until price momentum asserts itself on the bigger picture. Beginners should simply avoid this environment, but if you must participate, the best way to adjust is work on smaller time frames like 5 minute or less and accept the whatever the R:R ratio is for that time frame. Either way do NOT expect BIG moves until price makes its way to one of the outer boundaries of the range. The Trade Scanner Pro quantifies the R:R for your chosen time frame and gives you a much better idea of what to expect.
The illustration on the chart points to a short term rejection of the 88K to 90K area resistance. This can be attractive for those who are willing to accept greater risk and operate on smaller time frames. IF Bitcoin breaks 90K, it can easily squeeze into the 95K area and all it takes is an unexpected news announcement which seems to happen regularly in this environment. NO ONE knows where the market is going, we can only assign probabilities which is why RISK must be assessed and RESPECTED before ANYTHING else.
This game is hard not because traders lack intelligence, it is because MOST participants believe they are consuming information that is relevant, especially if this behavior has been reinforced by random wins. As retail traders we have to operate with a blind fold while a small minority of participants operate with HIGH quality information. Here's a hint: you will not find truly relevant information on public platforms like Twitter, mainstream news, etc., yet people still turn to these sources when they feel the need to be "informed". Everything you NEED is on your chart.
Thank you for considering my analysis and perspective.

Bitcoin looking to break higherIntraday Update: Bitcoin over the weekend is challenging the descending channel trend line and above the channel is the 38% retracement at 87848. This level is being tested as headlines over the weekend suggest that tariffs will not be applied to phones, computer and chips. This should allow for risk assets like Bitcoin to continue to rise higher over the weekend.

BTC USD We're seeing a strong bullish shift across monthly, weekly, and daily timeframes, with significant volume supporting the move towards higher targets. We expect to see increasing volume as we approach those targets. Keep a close eye on the market during weekends and throughout the week; the upcoming weeks should be highly profitable. We've taken long positions and closed all short positions. This decision is based on strong divergences observed in our order flow analysis tools. We're optimistic after the long-awaited sideways price action.

Bitcoin wave 5 almost doneBitcoin is now in final wave 5. Ideally it needs one more high to complete all of it. The long term perspective is that Bitcoin has made all of long term wave 3 and a wave 4 will be in progress very soon. Wave 4 resides around 5000

Bitcoin (BTC/USD) Slammed Back Into Channel SupportBitcoin shed -2.46% today, reversing sharply lower from the top of its descending channel and the 50-day SMA, reaffirming resistance just below $88,700. The rejection puts focus back on the 200-day SMA and mid-channel support.
🔻 Price remains firmly inside the falling channel
📉 MACD is flattening below zero — no bullish crossover yet
⚖️ RSI sits at 44 — modest bearish momentum without being oversold
If price breaks below $79,000, eyes may turn to the lower channel boundary near $72,000, and eventually the long-term trendline closer to $68,000.
Momentum is weak and trend pressure remains tilted downward unless bulls can reclaim the 50-day SMA and break out of this channel decisively.
-MW

Litecoin LTCUSD Completing Final Leg Down Before LaunchAs you can see Litecoin is forming a very similar pattern. I think the rest of March will be corrective. Litecoin will likely come down and bounce off the trend line which coincidental also is a major support level. April will be slightly bullish, May and June will be majorly bullish which I believe Bitcoin will also fly up to 140k as well in this time. I believe Litecoin will outperform the majority of the market. Major hyperinflation will begin this summer which will be very positive for crypto. Many cryptos will die in this hyperinflation period. Only some will survive. Dollar is going to crash. Get ready for a wild ride into 2026. People calling for a bear market are ill informed and will kick themselves for selling. This is the beginning of the biggest run in some cryptos, we've ever seen. Buckle up. Good luck. Not financial advice.

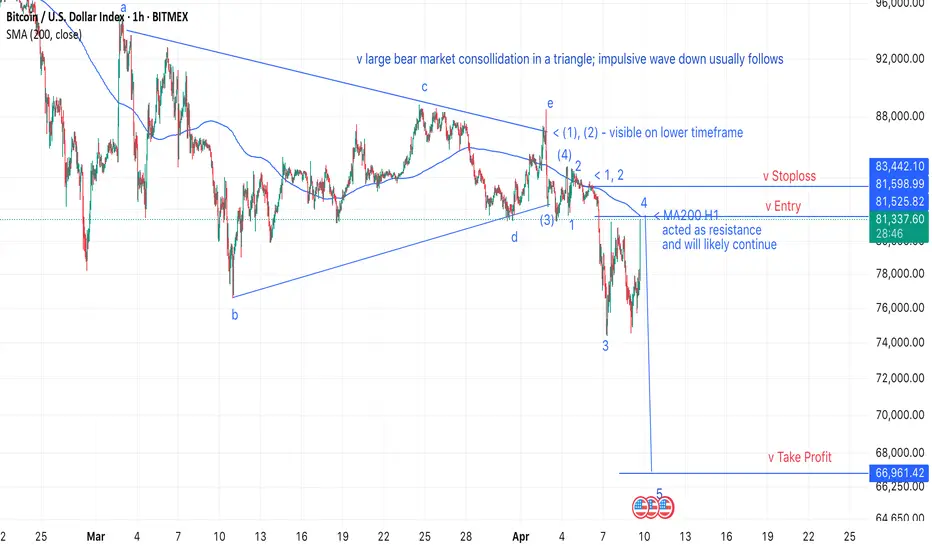
[BTC short] Entry: 81.5k, SL: 83.5k, TP: 67kThe backdrop is my prediction of a 2008-style crash, with Bitcoin (BTC) dropping to $26k (see related ideas).
During the crash, I’ll aim to capitalize on short-term moves, targeting clear patterns with high reward-to-risk ratios.
Following a prolonged consolidation—resembling a triangle—an impulsive wave down has begun to form. I now expect the 200-hour moving average (MA200 H1) to act as resistance, pushing the price to a new low and trade accordingly.