BTC / Gold: Will history repeat itself?In the past, Bitcoin has made great gains over gold. Measure in the price of gold, Bitcoin did a 10x in 2013 and a 14x in 2017. Will history repeat itself in 2021? Will BTC do another 10x to 14x on gold?
Bitcoin-gold

Trading - Expectations VS RealityHey Traders,
In this post we will aim to clear some of common misconceptions of trading and how we can help you go further in your trading career by giving you all the tools you need to better understand the market and kill the game.
____________________________________________________________
1. Trading is easy.
Trading is relatively easy IF you know the rules of the market and use certain analytical techniques. Once you have a full arsenal of technical tools, you can easily understand the market and figure out where it may go next.
2. Market moves in one direction.
That can be true to a certain extent where we have trending markets. However, within that trend there are various types of pullbacks. Once you understand the different market phases, you can make money whether it's a trending or ranging market. Opportunities are endless!
3. Buy when low. Sell when high.
If only things were that straight forward, right? Sometimes the lows aren't really the lows and the highs push higher and higher. This is when you need to understand the different patterns and structure of the market to help you figure out where the best possible place is to buy or sell.
Once we understand the market, we need a trading plan. How do we enter? Where do we enter? Where is the stop loss? This is where having rigid checklist really helps! You can tick things off the list and grade the trade setup from good to bad and then enter accordingly using various entry methods.
It may sound like a lot of but once broken down into little bits, you can learn this EASILY and know exactly how to analyse and enter trades!
____________________________________________________________
What we will be covering:
- Market structure: Impulse & Corrections
- Using Index charts to correlate your trades (Very important Topic!)
- Drawing a trendline and levels correctly – There’s a hack to it!
- Using Moving Averages Correctly
- Combining higher timeframe & lower timeframe
- Different patterns and how to trade them
- More topics to come!
Comment below on what other topics you would like to see!
I hope this post help clarify some of the misconceptions of trading and the different elements involved.
See the links below for information on how we can help you!

BTCUSD, Interesting Day Trading Setup The market appears to have formed an inverted head and shoulders setup, which presents a potential upside movement.
We have a broken out resistance above 34k, and price is likely to retest a previous resistance ~ current support, before presenting further confirmations for upside movements.
All in and all looking pleasant for an upside movements towards 35k.

Bitcoin's Relationship with GoldHello everyone!
This post will explore Bitcoin’s relationship with gold and how we can extract trading signals from it.
The idea behind this is based on a research paper published about lumber’s relationship with gold: papers.ssrn.com . The paper seeks to build a model that will accurately foretell future economic conditions and inflationary expectations using two functionally opposite commodities: lumber and gold.
Housing is the lifeblood of the economy. Housing prices are sensitive to lumber prices. Lumber, therefore, provides an accurate barometer for risk around the economy. As lumber rises, investors are confident in the current economic landscape, as they believe in growth.
On the other hand, gold is considered a safe haven, so investors flock to this commodity once they become wary of current economic conditions or expect inflation to rise.
Increasing lumber prices relative to gold signal investor confidence and economic growth. Increasing gold prices relative to lumber indicate investor fear or caution.
Bitcoin and Gold:
A similar relationship can be drawn between Bitcoin and gold. Over the past decade of Bitcoin’s development, Bitcoin’s scarcity and difficulty to create mimic gold, which has led to it being called “digital gold.”
Bitcoin and gold can therefore both be grouped in the same category as safe havens that protect against inflation. However, of the two, Bitcoin is obviously the riskier asset because it is much more volatile and sensitive to external news.
Drawing a parallel to the lumber/gold relationship, a rise in Bitcoin relative to gold indicates rising investor risk appetite, while the opposite occurs with gold’s rise relative to Bitcoin. The next chapter will attempt to create a trading signal from this rate of change.
The signal:
Bitcoin is the best performing asset of all time, so simply plotting it against gold will yield a graph with continuous upwards momentum. However, instead of plotting it directly, the rate of change of this graph can instead be measured. With this relationship, Bitcoin’s rising rate of change relative to gold indicates belief in its upward momentum. In contrast, a negative rate of change would suggest that investors believe that Bitcoin’s run is possibly over and are rotating to safer assets such as gold.
To draw a relationship with this, I built this Bitcoin vs Gold chart with a Weekly 9-period Rate of Change Indicator.
The signal for this indicator is the following:
1. Buy once the ROC crosses above 100
2. Sell once the ROC crosses below the zero line
The chart demonstrates that utilizing this method predicted the long-term and intermediate tops pretty accurately, including this one.
The following list details the returns obtained when using this strategy since 2013:
February 11, 2013 – June 3, 2013: 401%
November 4, 2013 – January 20, 2014: 294%
May 22, 2017 – January 22, 2018: 481%
May 13, 2019 – July 22, 2019: 29%
December 21, 2020 – April 19, 2021: 145%
Total return: 362 times the initial investment! (Assuming total reinvestment)
As can be seen, this strategy has consistently demonstrated gargantuan gains while never having a negative signal since its inception.
2021 Bitcoin Bear Market:
We crossed to the downside on April 19, 2021 when Bitcoin was at 56k. This cross anticipated the last high before the precipitous decline over recent weeks. Historically, this cross has been followed by periods of large downside spanning large periods of time.
So does this mean we are entering a bear market?
Not necessarily. Past performance is not indicative of future results. But I would say the charts remain bearish until we get a cross from the ROC to the upside.
If you have any questions or any other topic you would like to be covered, please let me know in the comments below.
Note: All credit for this idea goes to Michael from Figuring Out Money. You can check out his video on the topic at the following link:
www.youtube.com

Bitcoin : Worst Case Scenario in a Bull MarketIf at all Bitcoin is going to make a lower low, any price action below the Pink Line should act like a spring. Despite the fear in the market, we are still in a Bull Market.

USDJPY(ENJOY YOUR PROFIT)So sweet! congratulations, enjoy your profit, just look at the accuracy of a trade, thanks god...

XAUUSDBig sell opportunity for gold,
If it breaks about the trendline shown in the idea post, this idea will be failed.

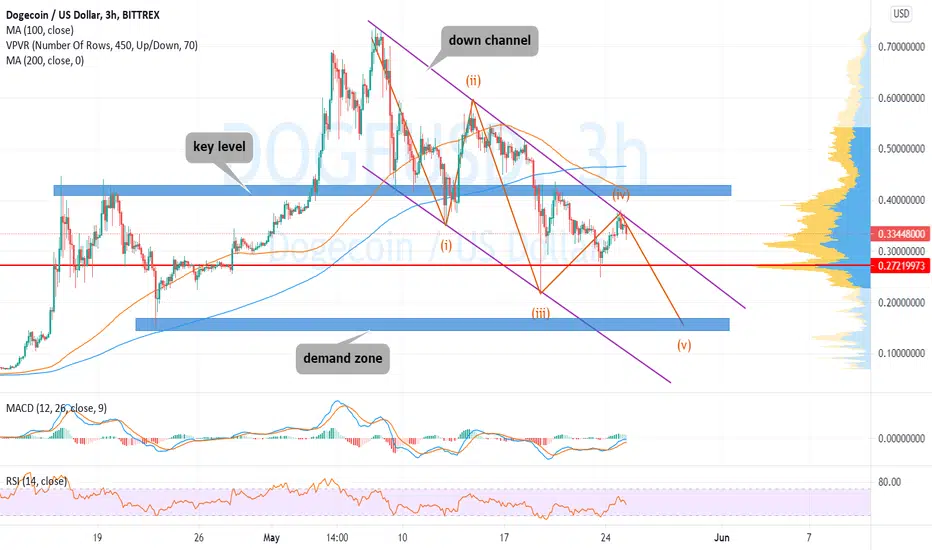
DOGECOIN ANALYSISDogecoin rebounded from upper limit of down channel pattern
Price is based below key level at 0.43052510
Below SMA 100
RSI is below level 50
It's expected forming bearish Elliot wave 5 to target demand zone at level 0.1530030
CARDANO ANALYSISCardano rebounded from uptrendline with strong bullish movement forming pin bar candlestick on H4 frame
Price is based above key level at 1.5515
Above SMA 100
It's expected to target level 2.1500

BTCUSD VS XAUUSDLEFT BITCOIN VS GOLD AND RIGHT GOLD VS BITCOIN. GOLD IS OUTPERFORMING BITCOIN AT THIS POINT AND TIME


Bitcoin -the new gold?So I overlaid bitcoin over gold chart and you can see clear negative correlations, as bitcoin moves up gold moves down and vice versa.
Is bitcoin the new store for money? Share your thoughts!

OUR NEXT TARGET FOR BITCOIN ARE 59K EXPECTING HUGE WHALE MD !Hello trading friends,
And here we confirm our next trade for bitcoin with a golden target of 59k!
our before target already hit.
# There is huge data whale trends on us that can enter bitcoin in short term. and the best whale that owns the most buys more and more. this means he expect also a huge increase coming time.
Take a look also at our best altcoin Helium (HNT) , We expect a mega increase trend depending on more reasons that we did add before.
Have good trades.
Follow /like for more updates.
Thank you

VirnetX Holding CorpI recommend investing in this, which is expected to rise this entire week, depending on our analysis
VirnetX Holding Corp : is a publicly traded Internet security software and technology company based in Zephyr Cove, Nevada. VirnetX has been described as being a patent troll, accused of marketing no actual products or services and instead earning its revenue through licensing patents and suing anyone that infringes them.The company has won intellectual property litigation against various technology companies.The firm is run by Kendall Larsen and his family.

Will bitcoin ETF effect the price?Looking back to the first gold ETF, I think bitcoin has a big potential left for institutional adoption.

EURJPY - FOREX - 18 April 2021Look at the #EURJPY chart on 1h timeframe!
i'm waiting for wedge pattern breakout and then after I see any good opportunity I'll enter a trade.
Look at the 4h timeframe chart:
Show me some love with following my tradingview page and please do not forget to like.❤️🙂
Post your comments!

90 Days USDT uncertainty turning to PAXGIn my opinion cryptomarket,will bleed huge. My fundamental analysis: NYAG needs documents from $USDT within 90 days, USDT market cap still rises as they print money, but in my thought at some point they need to redeem and burn their tokens in order to get their documentation in place. Every crypto (altcoin,bitcoin) graph draws head and shoulders on the chart, I don't want to keep USDT either. Lokking at USD/Gold chart we have strong support level at $1690, where we should bounce to $1750. Looking at Btc/Gold chart I showed all the resistance levels (my targets): resistance red lines not as strong as resistance blue horizontal lines and black is very strong resistance level.
If you dont understand something, I would gratefully answer all of your questions. Not financial advise, do your own research and good luck

NOW THE MOST USERS ARE AT TOP OF FOMO AND WHEN CRASH 90% REKTHello trading friends,
We are now exactly at the top of FOMO , And you don't be a whale to see this.
Most users are now 100% long - and whales know that also. when they enter sell trend - it will happen unexpectedly with first a fake increase trend. when happened a crash trend? when there is a top of FOMO. and I can confirm that this is now the case.
Means now you should sell? of course not - you should follow your plan if that buys or sell, it's up to you you should never take this as advice, this idea just shows that we are now at top of FOMO.
We know the markets change, and whales have different thinking than the most normal users - we call this hit into the trend - and that what most used by whales when they have a top FOMO trend.
WE ARE NOW ABOVE 60K and all looks fine and great - but I just give you the idea that this is the top of FOMO effect.
Time will learn if we had this signal right or not. but depending on our ETN tool where we have done a lot of these updates, can we say for 90% right.
# you can and will see next time possible small whales try to increase the trend - but when its time to end the long trend - bitcoin will break down to at last 56K or below trend.
@@Follow/like for more 24/7 Live updates on tradingview.@@
Discipline is the key to success - Take profit - Learn from your mistakes and never give up!
The reason 1 that 90% of traders lose, not because they can't trade, but because they trade emotionally.
if this appeals to you then learn yourself first before starting with trading.
#Always do your own research don't follow us or someone else blindly * this is not an advice
---> Have a great day

BE ALERT FOR POSSIBLE CRASH TREND BITCOIN - 2017 SIGNALS SHORT.Hello trading friends,
I hope you have a great day trade.
What happened now on the markets? we did saw an increase to 61k+ and directly we did saw a rejection by bitcoin small whales.
we have seen this more times, and this is the 3rd time. we expecting depending on data that bitcoin will break down soon below 60K to the first target 56k.
# if we want to find good signals into the normally chart, than are a normally TA the basic step we can do.
---> check 2017 - there are some signals from 2017 into this chart, what makes it return into short trade.
whales run the bitcoin price, not the chart. they are high-profit whales into BTC, we see also whales from 8K into bitcoin, and there are whales over 1650% into btc. a long a very risk for trend - time will learn why we did add this warn before as we are now above 60K
@@Follow/like for more 24/7 Live updates on tradingview.@@
Discipline is the key to success - Take profit - Learn from your mistakes and never give up!
The reason 1 that 90% of traders lose, not because they can't trade, but because they trade emotionally.
if this appeals to you then learn yourself first before starting with trading.
#Always do your own research don't follow us or someone else blindly * this is not an advice
---> Have a great day

Confirmed whale trend - 56K possible next targetHello trading friends,
We confirm here the whale trend where we did talk before above 60500, and it looks its on way to break down bitcoin to 56K or below.
We study at this moment the further data. and we will confirm soon more details. know that free fall are possible for btc.
The trend can looks to increase - but the trend and what the whales shows into data are short trend.
@@Follow/like for more 24/7 Live updates on tradingview.@@
Discipline is the key to success - Take profit - Learn from your mistakes and never give up!
The reason 1 that 90% of traders lose, not because they can't trade, but because they trade emotionally.
if this appeals to you then learn yourself first before starting with trading.
#Always do your own research don't follow us or someone else blindly
---> Have a great day 😃

GOLD Beating Bitcoin Gains? 👀In this video,
I share my In-depth analysis on $GOLD - and where it can go in the next few months.
Would love to know your views on GOLD.
Cheers 🥂.

BCH INTO 1 WEEK TO OUR TARGET 800+ - TIME FRAME UPDATE ITS TIMEHello trading friends,
As promised here is the chart with the trading time frame - we expecting depending on our Tool ETN where we have expected before more targets, and last one EOS, THAT BCH, will break out this week to 800+.
# we already know that BCH goes with the BTC trend, but there will be a moment that it will break out.
There will be coming 1 update, and that will be the last update for BCH.
As always we have said it at time. use good riskmangement.
@@Follow/like for more 24/7 Live updates on tradingview.@@
Discipline are the key to success - Take profit - Learn from your mistakes and never give up!
The reason 1 that 90% of traders lose, not because they can't trade, but because they trade emotionally.
if this appeals to you then learn yourself first before starting with trading.
#Always do your own research don't follow us or someone else blindly
---> Have a great day 😃

Combination StructuresHello guys
Double combination structures consists of two corrective waves which are too sharp.
This can be seen in sideway markets.
In the next lesson I will teach you triple combination structures.
Follow me for tutorials.
Cheers :)
