GBPUSD NEEDS SOME MORE TIME!!... 😎😎😎 Hi Traders
Please see our updated analysis on Gbp/Usd.
We were initially looking for a short position yesterday however price has continued its bullish momentum and we think we have a day or two more of bullish momentum before we start seeing price reverse. We did mention before that price may need a deeper move before seeing some kind of downside movement.
Notice price retraced exactly to the 0.5 Fib Retracement.
We were looking for USD strength coming in but it looks as if the US Dollar also has a deeper correction to make before continuing its bull run.
If you are more comfortable with a safer entry on this pair wait on the ascending trend breaking before entering or wait for a new lower low to be printed whilst rejecting a higher high.
Let me know in the comments below your thoughts on this pair.
As always remember trade safely with proper risk management!
The Fx Chartist
Bitcoin-gold

GBPJPY - I REALLY LIKE THIS ONE!!... 💖💖💖 Hi traders [/b}
Please see our analysis for GBPJPY.
Now GJ is one of my favorite pairs to trade I just think its extremely easy for trading. Let me know in the comments below your favorite pair to trade?
Price has been trading within the range of the ascending channel for quite some time and as we have p.
We are anticaptingsome further USD strength and GBP weakness.
We would like to see a deeper retracement right into the highs of the neckline marked to the left and the neckline or the preiouis double top set up.
I will link previous rerated idea .
If you like this be sure to hit the like buton or but yet give a a,
The Fx Chartist

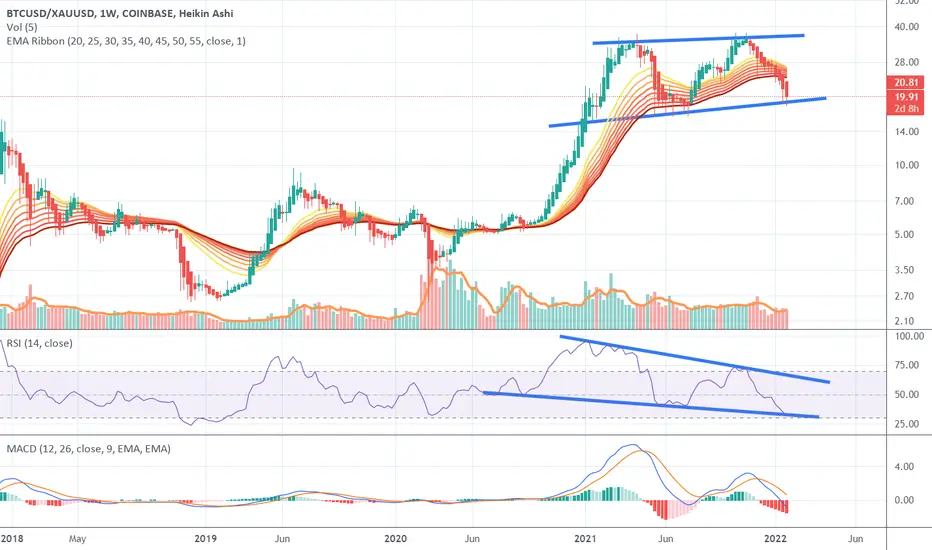
BTC/XAU (1w, Heikin-Ashi) - Bitcoin to GoldHi,
I do not know how to interprete... I see bearish divergences... Momentum loose etc., etc...
Or maybe I am wrong...
Regards,
Paweł
KNC Long term Halloween Spot trade for you profit goblins!Hello Traders,
I have put together this trade set up and information for you to help you in your research. Please see chart for details and be mindful of your stop losses along the way moving them beneath the pullbacks to stay in profit the whole trade.
KNC Price Live Data
The live #Kyber Network Crystal v2 price today is $1.73 USD with a 24-hour trading volume of $48,869,324 USD. We update our KNC to USD price in real-time. Kyber Network Crystal v2 is up 6.77% in the last 24 hours. The current #CoinMarketCap ranking is #256, with a live market cap of $307,680,364 USD. It has a circulating supply of 177,809,350 KNC coins and the max. supply is not available.
If you would like to know where to buy Kyber Network Crystal v2, the top exchanges for trading in Kyber Network Crystal v2 are currently #Binance, #Mandala Exchange ,#OKEx, #Huobi Global. You can find others listed on our crypto exchanges page.
What Is Kyber Network (KNC)?
Kyber Network is a hub of liquidity protocols that aggregates liquidity from various sources to provide secure and instant transactions on any decentralized application (#DApp). The main goal of Kyber Network is to enable #DeFi DApps, #decentralized exchanges (DEXs) and other users easy access to #liquidity pools that provide the best rates.
All transactions on Kyber are on-chain, which means they can be easily verified using any Ethereum block explorer. Projects can build on top of Kyber to utilize all the services offered by the protocol, such as the instant settlement of tokens, liquidity aggregation, and a customizable business model.
Kyber looks to solve the liquidity issue in the decentralized finance (DeFi) industry by allowing developers to build products and services without having to worry about liquidity for different needs.
The Kyber Network Crystal (KNC) token is a utility token that is the "glue that connects different stakeholders in Kyber's ecosystem." KNC holders can stake their tokens in the KyberDAO to help govern the platform and vote on important proposals --- and earn staking rewards in Ethereum (ETH) that come from trading fees.
Who Are the Founders of Kyber Network?
Kyber Network began its development in 2017 and is built on top of the Ethereum blockchain. The project was founded by Loi Luu, Victor Tran and Yaron Velner, and currently has its headquarters in Singapore.
Loi Luu is a blockchain researcher and an advisor for various blockchain projects. He developed #Oyente, the first open-source security analyzer for Ethereum smart contracts, and co-founded SmartPool, among other decentralized projects.
Victor Tran is a senior backend engineer and Linux system administrator. He was the CTO at Clixy and 24/7 Digital Group as well as a developer for several projects in Vietnam.
Yaron Velner is the current CEO of B.Protocol, a decentralized backstop liquidity protocol, and was a postdoctoral researcher. Velner stepped down from his CTO position at Kyber in October 2019 but remains as an advisor.
The Kyber team is also composed of several executive advisors, engineers and designers. According to the official Kyber Network LinkedIn page, the company has over 50 employees --- most of which are based in Vietnam or Singapore.
What Makes Kyber Network Unique?
Kyber Network is the first tool that allows anyone to instantly swap tokens without the need of a third-party, like a centralized exchange. The unique architecture of Kyber is designed to be developer-friendly, which enables the protocol to be easily integrated with apps and other blockchain-based protocols.
DeFi has many use cases and possibilities. Therefore, no single liquidity protocol can fit the needs of all liquidity providers, takers, and other market participants. Kyber's liquidity hub architecture allows developers and the Kyber team to rapidly innovate and integrate new protocols into the overall Kyber Network to cater to different liquidity needs.
In April 2021, Kyber launched the Kyber DMM, the world's first dynamic market maker protocol (DMM). Kyber DMM is a next-generation AMM designed to react to market conditions to optimise fees, maximise earnings, and enable extremely high capital efficiency for liquidity providers, especially for stable pairs with low variability in price range (like USDC/USDT, #ETH/SETH). They will be able to support pools with extremely high amplification factors, which means given the same liquidity pool and trade size, slippage can be 100x (or more) better than typical AMMs. Depending on their amplification strategy, liquidity providers can maximise the use of their capital and have the opportunity to earn much more fees relative to their contribution size, while takers can enjoy extremely low slippage on their trades.
Kyber DMM is the first of many new liquidity protocols that will be launched on the Kyber 3.0 Liquidity Hub.
In the Kyber #ecosystem, KNC token holders play an important role in deciding new #growth and value-capture opportunities and incentive mechanisms. Through KyberDAO, KNC holders can participate in the #governance of the network by voting on important proposals. Kyber's #community is sizable and made up of a wide range of developers, in addition to other members of the blossoming DeFi industry.
Kyber's fully on-chain design enables the protocol to maintain full transparency and verifiability. The platform claims to be the most used liquidity hub in the world.
How Many Kyber Network (KNC) Coins Are There in Circulation?
As of May 2021, Kyber Network has a total supply of 210 million KNC tokens. Out of this, just over 200 million tokens are in circulation. The KNC token is dynamic, with the KyberDAO having the ability to vote to increase or decrease the supply in order to drive innovation, bootstrap liquidity, and reward early adopters of new protocols such as the Kyber DMM.
Kyber concluded its initial coin offering (ICO) on September 15, 2017, raising $52 million by selling each KNC token at a price of 0.00166 ETH. According to the official token distribution paper, 61.06% of tokens were sold in the ICO, 19.47% were saved for the founders, advisors and seed investors, and the remaining 19.47% was reserved for the company.
How Is the Kyber Network Secured?
As an ERC-20 token, Kyber is built on top of and secured by the Ethereum blockchain. In addition, Kyber uses an extensive trust and security model that protects users from misbehaving administrators or exchanges, thanks to security measures built in both at the protocol and smart contract level.
The platform has been audited by several third-party security firms and researchers, including #Chainsecurity, which have determined that the protocol is secure and hence free of vulnerabilities.
Where Can You Buy Kyber Network (KNC)?
KNC tokens can be purchased and traded on a variety of exchange platforms, including prominent names like Binance, Coinbase Pro, Huobi Global and Kraken. The token is currently listed on more than 20 exchanges and has more than a dozen trading pairs, including #stablecoins like #Tether (USDT) and Binance USD (BUSD).
If you are looking for a guide on how to buy KNC tokens or other cryptocurrencies using fiat, check out our detailed guide to get started.
Have a green week,
Savvy

the rare mcdonalds sign formation$35,000 BTC. It was a major support on the monthly. MAJOR. It MUST hold.
What's even more ominous, is we've formed the very rare McDonalds sign formation, who as we know, will be flooded with resumes if this pattern hits the measured move target of $956, as shown.

Time to fill your Bags, fib levels from ATHsimple idea. Cant go wrong. best time to fill your bags is now

Detailed explanation of the harmonic model 5-05-0 pattern discovered by Scott Carney and published in his book “Harmonic Trading, Volume Two”
It is a unique model that has precise corrections of the Vibonachi ratio to check the health of the model.
Although the 5-0 pattern is a reflective pattern, because the 50% recovery level is the most important in the possible reflection area, and the correction ratio is slightly different from the Bat or Gartley pattern.
The 5-0 category falls within a family of 5 point harmonious reflection models and is essentially defined by the B point, which is mandatory for all compatible patterns.
The basic pattern assumption is to determine reactions after finishing the opposite direction, and 5-0 patterns usually represent the first retreat to reflect the large direction.
In many cases, the AB rib of structure is the final failing wave of direction.
“The buying pattern”
-Rib 0X beginning of formation of model structure.
XA rib does not require a certain correction, but provided it does not break the top of the rib 0X.
- AB rib between fibonachi extensions 1.13 to 1,618 from XA rib.
-C point between fibonachi extensions 1.618 to 2,224 from AB rib.
-Dot D from here we need to see one lower final comeback complete at the BC Correction Level 50.
- CD rib should D be equal in AB rib length.
“The Selling pattern”
-Rib 0X starting to be the model structure.
The XA rib does not require a certain correction, but provided that the bottom of the rib is not broken.
- AB rib between fibonachi extensions 1.13 to 1,618 from XA rib.
-C point between fibonachi extensions 1.618 to 2,224 from AB rib.
-Dot D from here we need to see one lower final comeback complete at the BC Correction Level 50.
- CD rib should be equal in AB rib length.
Take a look at some of our previous analyzes with this analysis
And don't forget to hit like so we can continue to publish such useful posts

XRP - Heading back to $1?XRP
Daily Time frame
We have seen XRP make an impulse / correction / impulse to the down side finding support at the 70cent where we have monthly structure. Price has rejected this structure level twice and price has now broken out of the counter trend line. You can see after the first rejection of the monthly structure level price made an impulsive move to the upside but failed to break past the $1 region. After rejecting $1 price fell back down to the monthly structure creating an arguable double bottom but what we should focus on is how price moved down in a corrective manner giving indiction that the selling pressure is slowing down and that we could expect another impulsive move to the upside. Now that price has broken the daily counter trend line i will be looking on the lower timeframes for entries to go long (H4 & H1) with the first target being $1 where i will take partial profits or close the whole position depending on what price action develops.

EURUSD TA Daily TF : 01.10.22 $EURAs you can see, the euro / dollar is still in the neutral range and can still be one of the best currency pairs for Trading Range .
Follow our other analysis & Feel free to ask any questions you have, we are here to help.
⚠️ This Analysis will be updated ...
👤 Arman Shaban : @ArmanShabanTrading
📅 10.Jan.22
⚠️(DYOR)
❤️ If you apperciate my work , Please like and comment , It Keeps me motivated to do better ❤️

EURUSD FORECAST 1HReason:
- Resistance at 1.3599
My prediction:
1) Reversal at 0.618 line
2) Resistance becomes Support

The Federal Reserve Effect on AssetsHello friends, today I am showing you six charts - US Dollar (DXY), 10 Year Treasury Interest Rate, Gold, Bitcoin (BTCUSD), WTI Crude Oil and S&P 500 Index (SPX). These are some of the biggest traded assets in the world. The vertical lines on each chart represents the beginning of the month.
Over the three months since September 2021, the US Federal Reserve has been pointing to a reduction in balance sheet and dropping in hints of what the are considering (such as tapering, rate hikes and so on). This has directly impacted assets classes across the world as shown in these charts. There is no doubt that interest rates will go up if the Fed is openly saying they want to raise rates so it is with no doubt that the 10 year treasury is up. With that though oil has also been going up while other asset classes like Bitcoin, Gold and S&P 500 are going down. Interestingly the S&P 500 Index has not suffered as bad as Bitcoin has even though many consider them correlated in some way. This may be an indicator of what is to come soon. Lastly, the US Dollar seems to be getting stronger over the past few months and from my prior analysis of it (see ideas below), there is a strong potential for it to keep going higher. 2022 into 2023 will be a surely interesting year with what the Federal Reserve is looking to do.
There are many other asset classes I didn't review on this analysis. If you want to drop in others, feel free to do so. What are your opinions on this?
If you enjoy my ideas, feel free to like it and drop in a comment. I love reading your comments below.
Disclosure: This is just my opinion and not any type of financial advice. I enjoy charting and discussing technical analysis. Don't trade based on my advice. Do your own research!

SafePal Daily TA : 12.27.21 : $SFPAs we can see, the price is in an important range and recommended to keep an eye on it ... 😉
Follow our other analysis & Feel free to ask any questions you have, we are here to help.
⚠️ This Analysis will be updated ...
👤 Arman Shaban : @ArmanShabanTrading
📅 27.DEC.2021
⚠️(DYOR)
❤️ If you apperciate my work , Please like and comment , It Keeps me motivated to do better ❤️

MONERO Daily TA : 12.23.21 : $XMRAs we can see, the price is in an important range and recommended to keep an eye on it ... 😉
Follow our other analysis & Feel free to ask any questions you have, we are here to help.
⚠️ This Analysis will be updated ...
👤 Arman Shaban : @ArmanShabanTrading
📅 23.DEC.2021
⚠️(DYOR)
❤️ If you apperciate my work , Please like and comment , It Keeps me motivated to do better ❤️

NOW, WE'RE READY TO START | BTC/USDYou can see everything on this chart,
On marketcipher you can see some tips that we are going to explode.
A lot of btc were sold in a loss,
You can see the red line that is the trend line, built on candles bodies.


EURUSD 12H TF Analysis : 12.13.212 different scenarios tof EUR/USD trend:
In this case, we have to wait for the support or resistance to be broken by the price and then take action to get a position.
Possible Buy Position Targets : 1.1372, 1.143, 1.147 🟢
Possible Sell Position Targets : 1.1189, 1.11294, 1.1069 🔴
Follow our other analysis & Feel free to ask any questions you have, we are here to help.
⚠️ This Analysis will be updated ...
👤 Arman Shaban : @ArmanShabanTrading
📅 13.DEC.2021
⚠️(DYOR)
❤️ If you apperciate my work , Please like and comment , It Keeps me motivated to do better ❤️

dollar indexWe can say goodbye to the dollar now , dollar to the ground soon, You can enter dollar deals now eurusd ,gbpusd,audusd,nzdusd for long

₿ DOGECOIN 1D ₿ : 06.DEC.2021 : $DOGEWill #DOGECOIN reach to 1$ ?
Examining the #DOGECOIN chart in the weekly time frame : we see that the price has been fluctuating in the range of 16 to 35 cents since May 24, 2021, and does not follow a specific trend (trading range). We expect the price to start to rise again this week and Grow and reach its first target at least up to 34 cents! The first condition to reach this target is the failure of the dynamic resistance indicated on the chart.
An interesting scenario could be the formation of the Triple Bottom Pattern pattern, which is completed when the price reaches the level of 34 cents, and with the failure of the neck line, the price can grow up to the specified targets.
Targets are $ 0.34, $ 0.45, $ 0.51, $ 0.57 and $ 0.74, respectively, and $ 1 at the end.
What is Triple Bottom Pattern ?
A triple bottom is a bullish chart pattern used in technical analysis that's characterized by three equal lows followed by a breakout above the resistance level .
KEY TAKEAWAYS
A triple bottom is a visual pattern that shows the buyers (bulls) taking control of the price action from the sellers (bears).
A triple bottom is generally seen as three roughly equal lows bouncing off support followed by the price action breaching resistance.
The formation of triple bottom is seen as an opportunity to enter a bullish position.
What Does a Triple Bottom Tell You ?
The triple bottom chart pattern typically follows a prolonged downtrend where bears are in control of the market. While the first bottom could simply be normal price movement, the second bottom is indicative of the bulls gaining momentum and preparing for a possible reversal. The third bottom indicates that there's strong support in place and bears may capitulate when the price breaks through resistance levels.
There are a few rules that are commonly used to qualify triple bottoms:
1- There should be an existing downtrend in place before the pattern occurs.
2- The three lows should be roughly equal in price and spaced out from each other. While the price doesn't have to be exactly equal, it should be reasonably close to the same price, such that a trendline is horizontal.
3- The volume should drop throughout the pattern in a sign that bears are losing strength, while bullish volume should increase as the price breaks through the final resistance.
How to Trade a Triple Bottom
The price target for a double bottom reversal is typically the distance between the lows and the breakout point added to the breakout point. For example, if the low is $10.00 and the breakout is at $12.00, the price target would be (12 - 10 = 2 + 12 = 14) $14.00. Stop-loss points are usually placed just below the breakout point and/or below the triple bottom lows.
Source : Investopedia
Follow our other analysis & Feel free to ask any questions you have, we are here to help.
⚠️ This Analysis will be updated ...
👤 Arman Shaban : @ArmanShabanTrading
📅 06.DEC.2021
⚠️(DYOR)
❤️ If you apperciate my work , Please like and comment , It Keeps me motivated to do better ❤️

₿ SOLANA 1D ₿ : 04.DEC.2021 : $SOLAppealing price ranges for long-term investment and HODL in #SOLANA : 150$ - 180$
Important support and resistance ranges are marked on the chart and everything is clear ...
Follow our other analysis & Feel free to ask any questions you have, we are here to help.
⚠️ This Analysis will be updated ...
👤 Arman Shaban : @ArmanShabanTrading
📅 04.DEC.2021
⚠️(DYOR)
❤️ If you apperciate my work , Please like and comment , It Keeps me motivated to do better ❤️

50MA Support? BTC is using 50ma as support for the third time since July.
Will it hold? Normally acts as a trampoline that makes price bounces at least 65%
Will we now see $70k + ?
What to watch for:
- Bounce from here
- If no bounce, might be some danger ahead.

Triple Bottom Pattern of #Doge Chart ?Will #DOGECOIN reach to 1$ ?
Examining the #DOGECOIN chart in the weekly time frame : we see that the price has been fluctuating in the range of 16 to 35 cents since May 24, 2021, and does not follow a specific trend (trading range). We expect the price to start to rise again this week and Grow and reach its first target at least up to 34 cents! The first condition to reach this target is the failure of the dynamic resistance indicated on the chart.
An interesting scenario could be the formation of the Triple Bottom Pattern pattern, which is completed when the price reaches the level of 34 cents, and with the failure of the neck line, the price can grow up to the specified targets.
Targets are $ 0.34, $ 0.45, $ 0.51, $ 0.57 and $ 0.74, respectively, and $ 1 at the end.
What is Triple Bottom Pattern ?
A triple bottom is a bullish chart pattern used in technical analysis that's characterized by three equal lows followed by a breakout above the resistance level.
KEY TAKEAWAYS
A triple bottom is a visual pattern that shows the buyers (bulls) taking control of the price action from the sellers (bears).
A triple bottom is generally seen as three roughly equal lows bouncing off support followed by the price action breaching resistance.
The formation of triple bottom is seen as an opportunity to enter a bullish position.
What Does a Triple Bottom Tell You ?
The triple bottom chart pattern typically follows a prolonged downtrend where bears are in control of the market. While the first bottom could simply be normal price movement, the second bottom is indicative of the bulls gaining momentum and preparing for a possible reversal. The third bottom indicates that there's strong support in place and bears may capitulate when the price breaks through resistance levels.
There are a few rules that are commonly used to qualify triple bottoms:
1- There should be an existing downtrend in place before the pattern occurs.
2- The three lows should be roughly equal in price and spaced out from each other. While the price doesn't have to be exactly equal, it should be reasonably close to the same price, such that a trendline is horizontal.
3- The volume should drop throughout the pattern in a sign that bears are losing strength, while bullish volume should increase as the price breaks through the final resistance.
How to Trade a Triple Bottom
The price target for a double bottom reversal is typically the distance between the lows and the breakout point added to the breakout point. For example, if the low is $10.00 and the breakout is at $12.00, the price target would be (12 - 10 = 2 + 12 = 14) $14.00. Stop-loss points are usually placed just below the breakout point and/or below the triple bottom lows.
Source : Investopedia
Follow our other analysis & Feel free to ask any questions you have, we are here to help.
⚠️ This Analysis will be updated ...
👤 Arman Shaban : @ArmanShabanTrading
📅 02.DEC.2021
⚠️(DYOR)
❤️ To give us energy and motivation , please like and leave a comment. ❤️

TRX (TRON) UpdateHi Traders,
Welcome to my update regarding TRON TRX technical analysis. As you can see we popped out of the down trend with a nice bullish run. The technical pattern that broke out was a falling wedge idea. In this trade I took 50% of my profit at the first target thus to give myself a better entry if we pulled back. Which as you can see in the chart we have came back down to the entry zone of the original breakout. After making a new local high and a new local higher low I have been given extra confidence that this trade will head to the second target area that I posted in the original trade. Therefore, I entered at the original breakout area giving myself an extra 40% profit potential on this specific trade.
Fell free to ask questions in the comments.
Have a green week!
Savvy

₿ Cardano 1D ₿ : 28.Nov.2021 (ADA)The real Black Friday and Cyber Monday discount is just the price of Cardano right now :))) #Buy_Recommendation
Follow our other analysis & Feel free to ask any questions you have, we are here to help.
⚠️ This Analysis will be updated ...
👤 Arman Shaban : @Ar_M_An_4
📅 28.Nov.2021
⚠️(DYOR)
❤️ To give us energy and motivation , please like and leave a comment. ❤️
