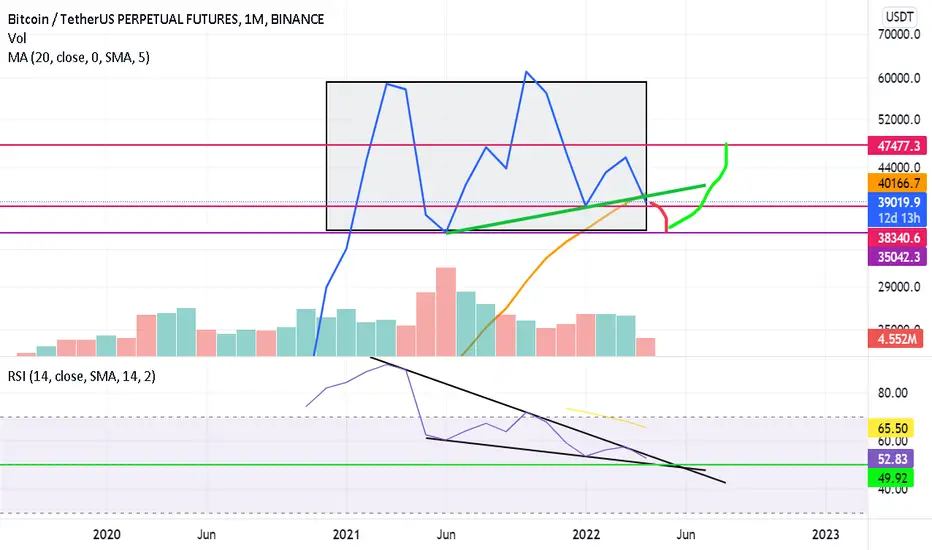
this is my idea in bitcoin for aprilthis is my idea.
i think we have there great RR.
dont forget about rate hikes. :)
Bitcoin-short

BITCOIN BEARS WILL DOMINATE THE MARKET|SHORT
Hello, Friends!
A recent breakout signals
That the bears are still strong
And I am growing in confidence
That a bearish selloff is coming!
SELL!
✅LIKE AND COMMENT MY IDEAS✅

Simple and most possible ACT!At this time (5/7/2022) BTC price is 35930 , you can take Short to 29-30 K , then long and go for 46K range.
It is very unlikely that the price break 29-30k restraint and go down! ( but careful before Long!!!)

BTC ShortBitcoin seems to be riding a new down trend, I think BTC will fall to 37k within the next 1-2 days. It could possibly even go down to 35.5k zone in 2-4 days. I've been tracking BTC since its rise on March 14th, my bias is short I expect it to keep dipping. If Bitcoin does continue to dip down towards 35k I think bulls will then eventually take over and create a new uptrend.

BITCOIN Will Move Lower! Short!
Hello,Friends!
Indecision in the market is changing
Towards a well defined bearish sentiment
And the price action on the lower timeframes
Is clearly supporting this narratve
Therefore, I think it is a goodidea to go short!
Like and subscribe and comment my ideas if you enjoy them!

Short bitcoinWarning! Possibility of bitcoin falling in the weekly period to the specified areas due to being in the uptrend channel

BTC - SHORT Possible scenario for BTC. A Market crash looks to be upon us, a capitulation moment is likely to occur.
Whats your thoughts on BTC in the LONG RUN

BTCUSD short intradayBTCUSD sellers are in control. A short trade is shown with entry/stop/target. I'm not trading this today, and I'm not advising you to FOMO into this. This video is simply to help me clarify my trade ideas and get public feedback on trade set up/analysis.

BITCOIN BEST PLACE TO SELL FROM|SHORT
Hello, Friends!
Anyone who looks at the chart of BITCOIN today
Can tell that bears will win this battle
So we are opening a short position!
SELL!
✅LIKE AND COMMENT MY IDEAS✅

BITCOIN SHORT #BTCI repeat that I previously mentioned that the bitcoin will go down, and now I repeat that, sell the bitcoin and wait for your profits

Bitcoin 1HR ShortBig wick showing heavy sell pressure and an inability to regain previous levels. Daily and 4HR breaking down as well.
I have a stop at 39350, above the retest, targeting 38.2, 37.6, and 36.4.

bitcoin can go to 35 k again!? hi friends ..
first look at the chart .. i prefer the line chart for monthly time frame
we have 2 important poin in this chart :
first :
The price is breaking the green uptrend line.
On the other hand, price is breaking down moving average 20 days (MA 20).
Since this is a monthly time frame, all of these breaks may appear as shadows
You can also see in the RSI indicator that the price has not yet broken the downward trend.
I think the price will go down to 35k.
BTCUSDon weekly time frame, I am still considering we are on bearish trendline - major trendline support - broken back to the week on 17th of January, BTC still struggling to got back above this trendline 47.5 / 48.5k area with confirmed candle closed above. Also looks like perfect example of BEAR FLAG forming recently. Looking also from combination of Elliot waves patent (1/2/3/4/5 - bullish back to MARCH 2020 till MARCH 2021) then ABC correction / potentially final leg down to complete C wave.

BITCOIN SHORT #BTCI do not recommend keeping the bitcoin , according to my studies and mathematical equations, it turns out that the bitcoin will touch 28 thousand approximately in the month of October.
- I know it's hard for you to believe this, but this remains a personal analysis and I accept the discussion.


BTC retest $42000 (short)Bitcoin about to retest the magical $42.000 area, before eventually move on higher, we will see.

when the price rejected many time's🔥. hi there guys👋 .
in the liquid markets when we see that the price is rejected 3 time's or more and stuck in a price area(range) it can be a warning that maybe the price cant get through and its time to turn in another direction.
please feel free to share your comments below.
cheers 🥂.

🔥Second signal, another possibility to entry📉👀I will make quick, the larger view on this assets will be develop in the LDTP update that I will do next, so follow me to be notified when it will come out.
On this setup, I already took position on the first signal, more complexe and on scalping session I didn't had time to post it. So with this second signal it's another opportunity that I see. The pattern is more common and completed. If you follow me you know it's not a hazard where it took place. I developped a 4 hour timeframe Wyckoff pattern and lately when someone asked me in comment where we are going I said to take care of this area particulary like show this image :
You can find the full description of it in the related idea under this one.
Like some know I'm also positionned long on a daily signal, I rarely short, except to edge my positions. Here we are on a key area between going long and follow the daily signal and go back to the support and probably spring in the wyckoff pattern which mean take a loss on the long daily position. That why I'm positionning myself ON SIGNAL and ON THE KEY AREA to cover my possible losses and in the case it break up I admit to loss a part of my gain to secure the profitability of the long term strategy.
"Making money in trading is math and respect of strategy, so never let your emotions guide you in uncomfortable positions"
Also, this signals are interesting, of course because it happen on a daily resistance but also because we did a breakout of the last resistance & AR of the Wyckoff pattern which create an imbalance and like I already explain imbalances are anomalies of market and have to be closed. So price should be attracted from it to rework on and fill it with volume. If we don't we create a trend which is really promising for the future of the long daily position. If we do it, it will occur to two possibilities : pullback on the broken resistance before to go back up - or reintegration of the range and so of the Wyckoff pattern which mean return to the support area.
Technical here but I will try to give more precisions in the upcoming LDTP update. Follow to be part of it ;)
Like, follow or comment if you like, it give me some strength to continue !
I will update this idea with evolution of the pattern.

BITCOIN BEARS WILL DOMINATE THE MARKET|SHORT
Hello, Friends!
After some time of sending us mixed signals
BITCOIN is finally giving us a solid bearish bias
And judging by the price action at the lower timeframes
The pair is about to go down!
SELL!
✅LIKE AND COMMENT MY IDEAS✅

BITCOIN 40 K ???! #BITCOIN #CRYPTOI previously mentioned in my previous analysis that Bitcoin will go down and now I renew my warning.
All indications indicate that Bitcoin will experience a decline, perhaps 39 thousand


BTC Short Trade Setup April 1stI am going to be opening a Short trade on Bitcoin on April 1st at $48,666.
Let's see what happens.
Not financial Advise.
#777

BITCOIN SHORT FROM RESISTANCE
Hello, Friends!
BITCOIN appeared on my radar today
With the recent news and corresponding price action
Making me bearish on the pair
Therefore, a move down is to be expected
SELL!
✅LIKE AND COMMENT MY IDEAS✅
