BITCOIN Long From Support! Buy!
Hello,Traders!
BITCOIN is approaching a strong support level
From where I will be expecting
A bullish rebound
And a move up towards the target above
Buy!
Like, comment and subscribe to boost your trading!
See other ideas below too!
Bitcoin-trading

BTC / USDT 4H PATTERNAs you can see right now BTC in 4H time frame it's in this pattern so just keep eye on the chart for the break out and confirmation for entry short or long
I do trading based on patterns and breakouts that is why I usually post about patterns and take the advantage of the market movement
THIS IS NOT FINANCIAL ADVICE IT'S JUST MY PERSONAL OPINION
DO NOT FORGET TO USE STOP LOSS

BTCUSD m15 - 08/04/2022 There is a beautiful flag on the bitcoin chart. I expect there will be another sell-off before we witness the next rally
Good luck.

its the update of my Feb 21 idea (go to related ideas)As you can see, Bitcoin has hit the middle blue resistance. The first static support is in the price range of 42400-42k.
The level of 42,000 is very important. In the first stage, I think the price will respect to this level.
Otherwise there is a possibility of moving to the next dynamic support line.
Another point is the weekly RSI . its near to the 50 line .it usally is the suporrt.

Bitcoin - Swing Trading Idea Till End of April - 7 April 2022BITFINEX:BTCUSD recently drops to a strong support zone as my expectations from my previous trading idea last Thursday. Bitcoin conference is in progress and a big announcement coming soon - over 16:30 Miami time. In short term, such a conference is a bearish indication, but in the long run of course means more adoption.
What is the supported thesis technically for the expected uptrend on Bitcoin
- price finished symmetrical A-B-C correction with A=C wave
- MACD indicator is at the low of 1-st April with the potential to reach the target
- 25% move will be good for price action and an indication of a parabolic 5-th wave
- huge probability price to range in 47-48k - day or two when starting exploding
If you have any questions related to this trading idea I will be happy to provide you with answers.

FTM - Short to $1It is clear that FTM had difficulty breaking the downward momentum. It had three touches at the resistance on the daily TF, but was unable to hold it as support. I can see this coin going back to $1 or lower. Furthermore, based on my indicators, it tells me that the trend is exhausted, whale money flow and stoch rsi is overbought on the daily timeframe

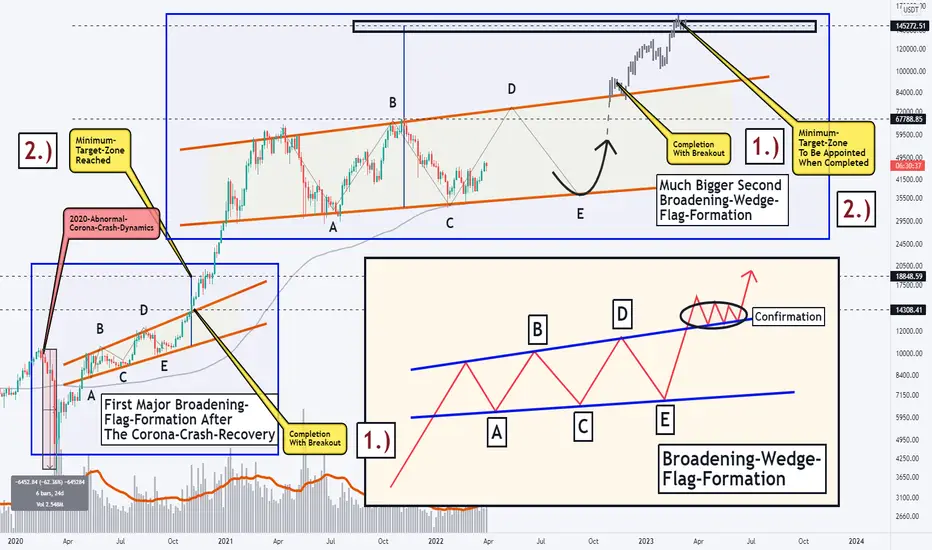
BITCOIN - The FORMATION That Can Lead To A SURGE ABOVE $100,000!Hello,
Welcome to this analysis about Bitcoin on the 4-day timeframe perspective. In recent times Bitcoin is developing crucial determinations from a fundamental as well as technical perspective. As mentioned in my previous analysis of Bitcoin there is a higher possibility given that Bitcoin has the ability to manage to hold above the $35,000 area and to form a reversal formation above this area. In this case now when looking on the more broader global perspective I detected a massive formation that Bitcoin is forming which already formed severely in Bitcoins history. This formation when completed will have a massive impact on Bitcoin's further development. Of course, it is also necessary to consider the fundamental side nevertheless in this case we can also watch positive movements going forward as the technological adoption of Bitcoin is moving forward with Exchanges adopting the Lightning Network, Bitcoin-ETF establishments making progress, and authorities looking to legalize Bitcoin. If there do not come any major disruptions or recession/depression dynamics as we have seen it within the Corona-Crash in 2020 these processes can go further. In this case, I detected the most important structures from a technical view and what to consider in this manner.
As when looking at my chart we can watch there how Bitcoin already once completed this decisive Broadening-Wedge-Flag-Formation which came along after Bitcoin managed to recover from the devastating abnormal Corona-Crash-Dynamics which hit all global markets in May 2020. The Broadening-Wedge-Formation has completed after these critical events and from there on Bitcoin showed up with greatly expanded volatilities. The Broadening-Wedge-Flag-Formation that forms a second time now is having a much bigger scale and completion of this formation will just have a much stronger effect as the formation completed after the Corona-Crash-Dynamics. In this case, there is wave D and E remaining with approaching the upper and lower boundary of the formation before completion can show up. The completion of this paramount formation will activate targets above the $100,000 mark. For now, it will be important how Bitcoin completes this pattern and if it finalizes appropriately Bitcoin is looking into a bright development with the completion of the formation, it will be an interesting development.
In this manner, thank you for watching the analysis, all the best!
"There are many roads to prosperity, but one must be taken."
Information provided is only educational and should not be used to take action in the markets.
Bitcoin - 10 Days Ahead Swing Trade - 31 March 2022BITFINEX:BTCUSD correcting as expected. In the next couple of hours, the price will reach a region of $45'000 and will find strong support. In the past weeks, there was a wedging consolidation, which connected two major waves - wave 4 with wave 5. I think wave 5 by Elliot Wave Theory started and there is a huge probability for a strong quarter and reaching levels even above $100'000.
In short term coming uptrend is confirmed by:
- On 1-hour time frame correction is Zig-Zag
- Dynamic support trendline on 1 hour TF
- Tests of previous swing highs
- Confirmed price action from daily & weekly
If you have any questions related to this trading idea I will be happy to provide you with answers.

IH&S forming on the 15mins bitcoinPossible IH&S forming on the15mins bitcoin forming. This could get UGLY (short term)

WTC / USDTAs you can see in the chart WTC is trying to break its resistance and the GOLDEN LINE OF FIBO
if this happens you can see our next target in the chart in fibo
GOOD LUCK, DO NOT FORGET TO USE STOP LOSS
THIS IS NOT FINANCIAL ADVICE THIS IS JUST MY OPINION

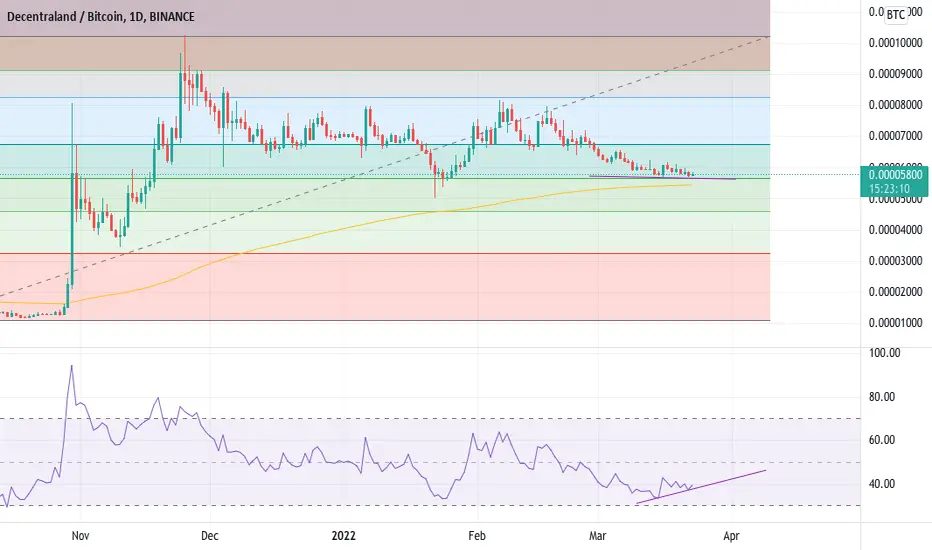
MANA/BTC pair at support?MANA/BTC pair at support?
Looks like theres a weak bullish divergence also, albeit the RSI did fully go oversold.
At the 0.5 fib not fib line lol, so the initial bull trend is still in tact.
also at the 200 ema which might serve up as support.
BITCOIN - Depending on TA into new uptrendHello trading friends,
This is a trend update for BTCUSDT with the last trends.
Into the last trend, we did show some no trading zones - also where the first confirmation could be - as it shows on this last trends:
Bitcoin is now depending on TA into a new uptrend - At the same time, we are now exactly in the time frame area.
it's important to hold coming time the trend in the watch - as it can breakout - but same time we should follow the confirmations on the time frame.
Know its crypto - and trends could change with time - that's why it's important to follow the last trends of TA.
There is not a trend that goes only up or down - but sometimes we have cycles that could take a long time to increase - all of this we should confirm with a time frame and live updates.
The whale setups zone did stay strong.
Give your nice like - if you like content or trading/studying the trend of BTC.
and if you want to get alerts with the next BTC updates - follow the channel - Thank you
Have a great day.

KCS 4 HR BreakdownOrange Area = 4 Hour Imbalance
If we trade above this on a 'closing' basis
then think higher prices - possibly $21.50.
If we failed to do so, the first objective is $17.50,
if we remain heavy the second objective is $16.00
BTC sentiment still appears bearish , this makes be bearish on crypto assets across the board.
I'm not selling.. I may trade these a bit in the coming weeks.
I'm waiting for extreme discount scenarios so I can invest.
I honestly don't trade crypto but these markets seems really nice for swing trades.
- Maradona Capital
Happy learning

BTC ON RED ZONE - SINCE LAST TRENDSHello trading friends,
Coming times are very important for BTC - since BTC trends are in the red zone - also since the last trends on Ukraine and Russia.
its possible that the 40k+ was a fake bull trend - the time frame will confirm it, the trend did change for the breakdown trend to 38.7 since last trends
There was before an update about that breakdown tren can start from 37.8 as you can see here below into this chart.
weekend volume is not the best volume trend - but since the last trends from Ukraine and Russia, it could make a change.
Manage in all-time you works well - as BTC can show unexpected trends.
This is not a trading call - but a reminder of the before chart.
Ukraine and Russia's side looks not good - I hope for all people the best - and peace.
Have a great time.

BTCUSD Weekly Updategetting rejected twice at EMA55, which tells me we are going to go down.
I think the price will test weekly EMA200 in the future.

Short ARUSDTShort ARUSDT
Im looking to short ARUSDT after around 33.20
1st Target - 28.21 zone
2nd Target - 23.46 zone
invalidation daily close above 36

Bitcoin LTF Current Update#BTC/USDT
#BTC still act strong resistance at $42800
Many time rejected from This Resistance.
If break above $42800 then bullish
Otherwise ready toward $40000
Support:- $40600
Resistance:- $42800

short MANAUSDTShort MANAUSDT
Im looking to short MANAUSDT after a 6h close below monthly open of 2.833
1st Target - 2.52 zone
2nd Target - 2.31 zone
invalidation daily close above 3.03

BITCOIN, HEAD-SHOULDER, Set-Up For BEARISH CONCLUSIONS!Hello,
Welcome to this crucial analysis about Bitcoin on the 4-hour timeframe perspectives and the current situation. Currently, there are people in the cryptocurrency space that became already completely bullish and are calling for the next all time high to emerge by next week which is actually a highly speculative approach at the moment. In this endeavor, we should not keep from the desk that Bitcoin since November of last year showed up with heavy bearish conclusions and continuations and that it is yet not confirmed if Bitcoin is in a validated uptrend again or further declines are likely to follow from a technical as well as a fundamental perspective as Bitcoin becomes many top-down regulatory pressures from authorities to ban and restrict Bitcoin. This is why it is highly pivotal to look at the actual facts and form an individual opinion about what is going on, therefore it is a relevant approach to look at the technicals which I am doing in this analysis, looking at the current formational structures and what to expect in the next times.
In this case now, when looking at my chart we can watch there how Bitcoin recently finalized and completed this major decisive head shoulder formation with the breakout below the neckline and the breakout below the 40-EMA, these two levels are now strong resistances for Bitcoin. With the breakout below the levels, Bitcoin now confirmed the high likelihood continuation and activated the lower target zone as seen in my chart between the $38,600 and $39,200 level. Now below the neckline and below the EMA Bitcoin is forming this confirmational formation as marked in my chart and with a breakout below the lower boundary, this formation will be completed with Bitcoin setting up to the further conclusions. Once the target zones have been reached it will be highly crucial if Bitcoin manages to reverse in this structure and form a substantial stabilization or a setup for a Wave-C-Continuation follows as it is seen in my chart. These are the two scenarios we need to watch out for when Bitcoin appoints the target-zone, in any case, for now, we should not underestimate the bearish scenario that Bitcoin currently points out to and be prepared for these upcoming volatilities.
In this manner, thank you for watching the analysis, all the best!
"The high destiny of the market is to explicate, rather than to speculate."
Information provided is only educational and should not be used to take action in the markets.

ETN - EDUCATION TRENDS - THE CODE OF WHALES.Hello trading friends,
This is an education trend for BTC Depending on backtesting.
Those trading for years know that trading has different cycles - and for those that invest for the long term want to be into the green cycle, and end the trading on the red cycle - their high goal is not to trade but building capital.
Backtesting of the BTC chart shows different cycles, like the ones here below in the cycle model example.
As you can see above into the chart - those following a cycle system wait for some time as months before canceling the cycle, This is also the best investing way. It's also low stress and all are managed before taking any long-term cycle order.
Most will ask how to find a cycle trend this depending on monthly expecting.
If you see for example The next month did make a confirmation above the last month, then it's interesting to check why this happen, this is only a small reason for starting a new cycle, but there is a need for more to confirm.
the cycle like following the interest of the project and also counting with TA.
Month 3 is very important in the cycling world. this month makes in most time a difference into a trend. These are also for the month may as confirmation.
THE CODE OF WHALES.
Every whale wants to connect with other whales to be a powerful whale. some whales know each other. but some whales not, but even then they can meet each other with no word on the trading connecting world. They have learned the code of the chart. what means some times a chart shows a way of trending where the whales get a signal that the trend looks to breakdown or to increase by other whales . I have seen personally many patterns that come seem out, and I believe they work on the chart code.
What I mean with the code is this could be a number, that come by any crash trends, and also on another trend of the way with the star move that a trend makes.
Not anyone can win into trading - because when you win someone else loses. but you can win as a group and that's the goal of whales. so connecting them together is them a most important goal, even they can't see each other.
When its possible to make good profits?
The most users that did make good profits are those who did hold the cycle of the green trend of the crash. this hodl should be not more than 10% of your totally assets. and also most check to the price of coins, it's more important to check to the project and the market cap. also, a trend that ends most time into profit is buying when there is a crash trend. also, dollar cost avenge has a good option for the long term.
We can read more books about how to manage our losses and all things, but if we don't change ourselves it will be always the same. so it's important to change ourselves first.
Hope that I have given a small view about cycles trends, that's interesting to read self more about it.
# The goal of whales into breakdown trends to let you feel there is a new bull trend coming - making fake pump trends that end with crash trends - this happened into backtesting of history more times as the chart shows - so not every pump are real, and not every breakdown trend. but one thing is confirmed more times when there is high fomo know its a very risky zone. because whales - market makers should take the profits. there is not a chart that is going only up.
Have a great day - which you best trades coming time.
If you like this content give it a like - and follow - thank you.

Short CHRUSDTShort CHRUSDT
Im entering this Short on CHRUSDT close to the entry trigger 0.603
1st Target - 0.543 sat zone
2nd Target - 0.52 sat zone
invalidation daily close above 0.66

Long XAVAUSDTLong XAVAUSDT
Im entering XAVAUSDT on a retest of 7.00
1st Target - 8.96 zone
invalidation daily close below 5.45

Bitcoin LTF breakout and Target could be $46000#BITCOIN
$BTC currently trading at $44100
Breaking out Resistance in 1H time frame.
Above Yellow TL bullish toward $46000
$44300 is also Resistance in LTF
Bullish above $44300
1H candle also closed above Yellow TL
Let’s see $44300 resistance break or not.
Keep an eye on this level.
Support:- $43300
Resistance:- $44300
